Crypto Academy / Season 3 / Week 8 - Homework Post for professor @cryptokraze | Trading Sharkfin Pattern
It was on the 20th of April 2020, the Corona Virus had hit really bad, factories had shut down, there was almost zero need for oil.
With a very fast diminishing oil demand, and a constant supply, oil reserves had overfilled, companies were paying oil merchant vessels to hold their oil, causing a negative price on oil.
Oil had slumped down below 5 dollars, investors were scared, but traders were watching.

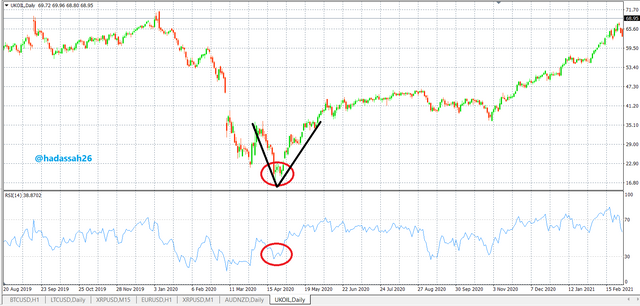
With the Oil price hitting below $6 causing a sharp deepening of price , the RSI was seen to have crossed below the 30 margins. Smart traders watched for a reversal and bought at the start of the other arm of the V formed shape. And yes they made a lot of profit on the retracement.
This was the very recent biggest case of a Sharkfin pattern in the financial market. Traders who had bought the position with high leverage had made tons of money. Let us now snap back to cryptocurrency, and how to trade Sharkfin in the crypto market.
Good day beautiful Steemians, welcome to my Steemit Crypto academy season 3 week 8 lectured by Professor @cryptokraze on
: Trading Sharkfin Pattern.

"1. What is your understanding of Sharkfin Patterns. Give Examples"
The Sharkfin pattern is a "spike-like" price pattern majorly happening at major support and resistance or liquidity levels.
The Sharkfin price pattern which usually shows areas of oversold or overbought positions can be better recognized with the Relative Strength Index Indicator (RSI) and the V formed shape of price.
The RSI which reaches the oversold or over-bought bands of its scale (the 70 or 30 margin) alerts traders of an incoming Sharkfin, and on its reversal, quick positions are entered on price to trade the Sharkfin pattern.
The Sharkfin Trading Strategy is built on the idea of price retracement, relating back to traders' psychology, greed and fear. With price hitting major support or resistance zones, seeming an oversold or over-bought position, traders get weary and withdraw some of their holding from the market, this causes a quick retracement, sometimes a spike in volume(new traders coming in, older traders going out).
The volume also is a good sign of the Sharkfin pattern, with high trading activity around that region, there is a spike in volume.
With these visual indications, traders can now successfully trade the Sharkfin patterns profitably.
Advantages of Sharkfin Trading
- It helps in fast retracement catching, a good trade for accuracy traders.
- It is good for scalp trading and works well on shorter time frames, so just searching for the pattern and trading it can give one quick profits.
- It uses very few indicators and doesn't necessarily need experience before trading, basic rules great for newbie traders.
Disadvantages of Sharkfin Trading
- Institutional Money may play liquidity games with price causing losses for traders.
- It takes patience to spot them and sometimes even spotting them, they may have already passed the right entry point, becoming risky to enter.
"2. Implement RSI indicator to spot sharkfin patterns."
As stated in number one, the RSI (Relative Strength Index) Indicator is a good indicator for the Sharkfin trading strategy as it gives a good visual of likely pattern and more giving traders a scale to look up to.
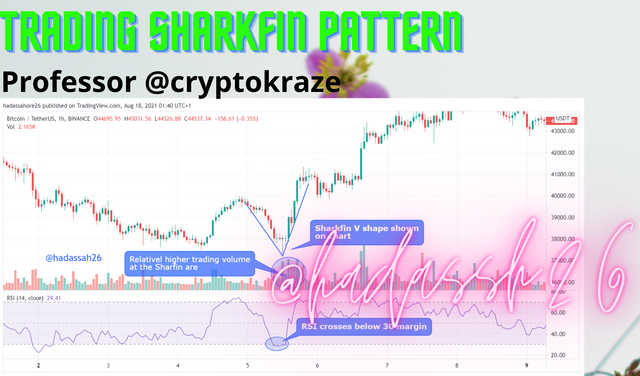
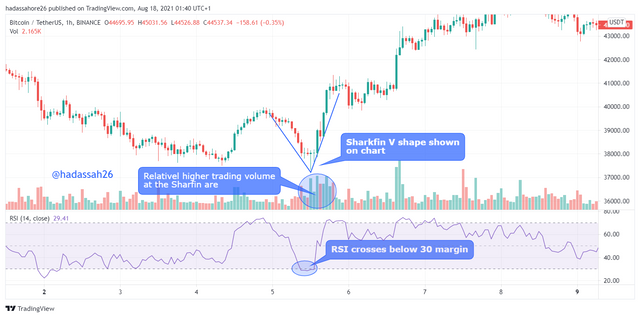
Bearish Situation
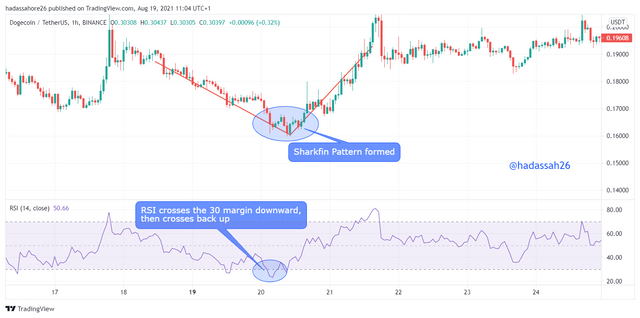
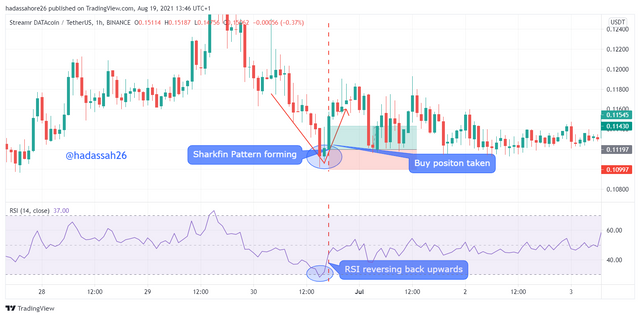
Using the RSI to detect a bearish Shakfin pattern, we have to first watch the price for a steep downtrend, this movement may hit major support. Our RSI should show the same price movement in the downward direction, with it steeping down too to hit the 30 margin.
Then now we use the RSI to watch if the price really turns back up by watching for when it crosses back up above the 30 margin. This gives us an easy method of knowing there is a retracement. We can now place our buy order. Example is shown in the picture below.
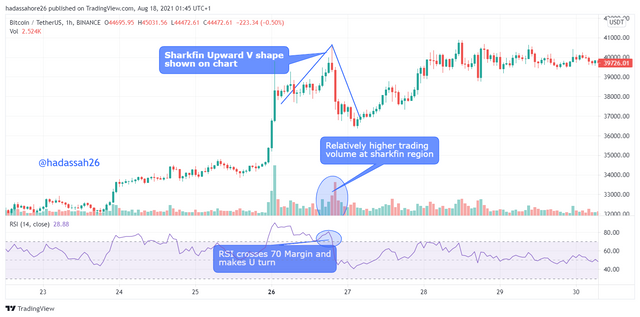
Bullish Situation
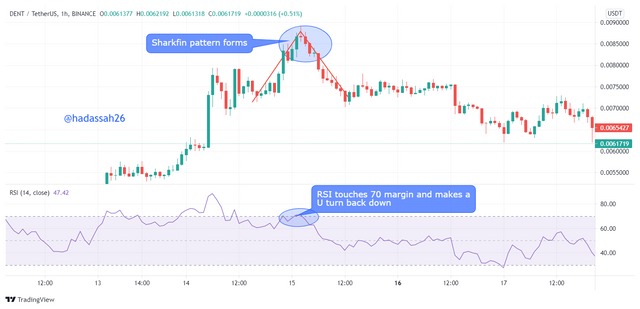
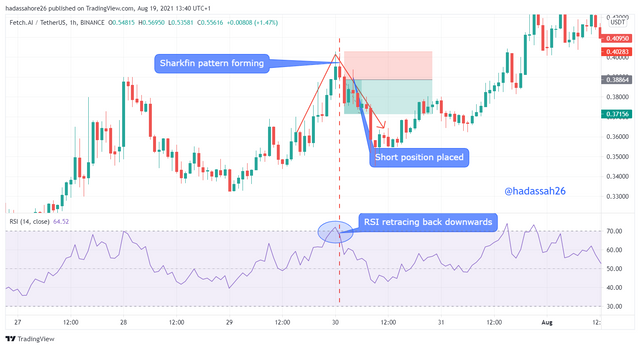
Using the RSI to detect Bullish Shakfin Pattern, Like the bearish situation we have to watch for price to make a bull run, spiking upward we then watch our RSI. The RSI serves as a meter to ready if the price has now overbought as it crosses the 70 margin.
Now we wait for it to make a reversal crossing back down, here we know price is making a retracement we can now place a sell order and hope to catch the retracement making some profit.
"3. Write the trade entry and exit criteria to trade sharkfin pattern"
The Sharkfin pattern can be very easy to spot, well with patience, and applying the RSI, and also watching for volume changes. So below I am going to give detailed but simple criteria to follow in trading and exiting either a bearish or bullish trade on the Sharkfin pattern.
Bearish Sharkfin Trade Entry Criteria:
- Add the RSI indicator to the chart, setting it at period 14 (default settings) with the lines: 30 and 70 very visible.
- Watch for a Bearish move of price, usually having a steep trend.
- Watch the RSI indicator to hit the 30 margin.
- Watch for price to make a quick retracement tending back up.
- Watch the RSI indicator to turn now going back above the 30 margin.
- Place your Buy trade quickly, trying to catch the retracement.
Bullish Sharfin Trade Entry Criteria:
- Add the RSI indicator to the chart, setting it at period 14 (default settings) with the lines: 30 and 70 very visible.
- Watch for a Bullish move of price, usually having a steep up trend.
- Watch the RSI indicator to hit the 70 margin.
- Watch for price to make a quick retracement tending back down.
- Watch the RSI indicator to turn now going back below the 70 margin.
- Place your Sell trade quickly, trying to catch the retracement.
Bearish Sharkfin Trade Exit Criteria:
- We should place our stop loss, placing it a little below the wick of the immediate previous swing low candle.
- With this set stop loss, it should be able to accommodate minor market noise, but should also be quick to close the trade in case of reversals.
- We should set our take profit hoping the trade goes in our favour.
- Using the risk to reward ratio of 1:1, we set our take profit.
Bullish Sharkfin Trade Exit Criteria:
- We should place our stop loss, placing it a little above the wick of the immediate previous swing high candle.
- With the above set stop loss, it should be able to accommodate minor market noise, but should also be quick to close the trade in case of reversals.
- We should set our take profit hoping the trade goes in our favour.
- Using the risk to reward ratio of 1:1, we set our take profit.
"4. Place at least 2 trades based on sharkfin pattern strategy"
To carry out these demo trades I go to my MT5 mobile app and search through my cryptocurrency pairs for the forming sharkfin patterns on different timeframes.
First Trade
On the LTC/USD 1 minute chart, we can see the price has made a peak at the 167.52 USD price. We see the RSI has also shown a good over-bought position and the price is beginning to fast retrace.
We enter the sell trade after the RSI has crossed back down. This is a good example of the Sharkfin pattern in trading.
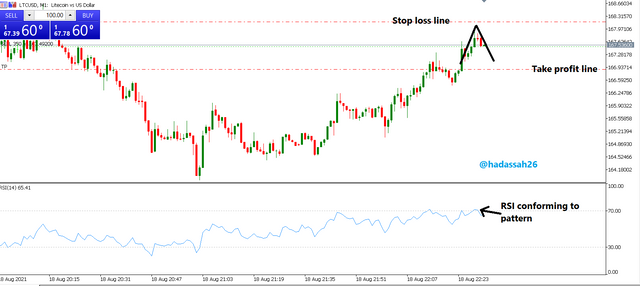
We place our stop loss at a considerable distance a little above the wick of the previous bullish candle. Our take profit is set with a ratio of 1:1.
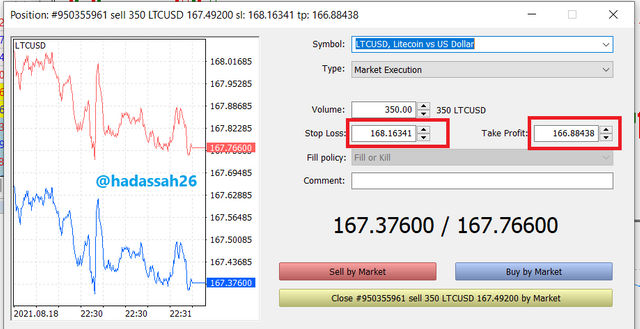
Trade Data:
| Price | 167.3755 |
|---|---|
| Stop loss | 168.1634 |
| Take profit | 166.8843 |
Second Trade
On the XRP/USD 1 minute chart we see another Sharkfin buy entry pattern forming. We see price hit the 1.067 USD line and forming a V shape. We take the trade a little late as the price runs fast on the 1-minute chart. We enter at 1.095 USD.
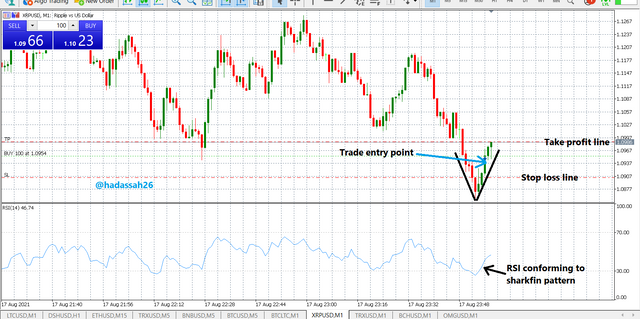
We place our stop loss at a considerable close position since we are entering late and price may soon reverse, so also we set our take profit at a ratio of 1:1.
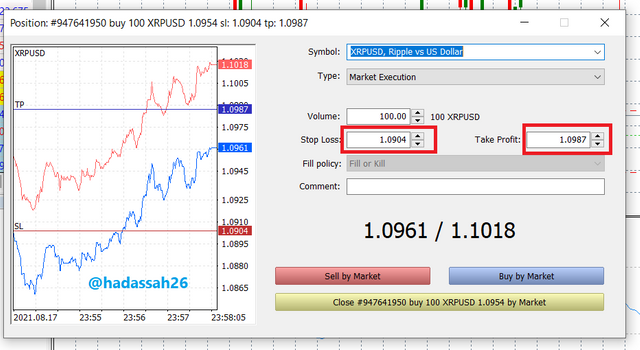
Trade Data:
| Price | 1.0961 |
|---|---|
| Stop loss | 1.0904 |
| Take profit | 1.0987 |
In conclusion, the Sharkfin price pattern trading strategy is a quick-accuracy trading strategy.
Fitting well in all timeframes, it is easy for newbie traders to master and make some profit from it.
Making use of the RSI (Relative Strength Indicator) makes the Sharkfin easier to detect and eliminates the need for many indicators.
Trade cautiously.
Thanks.
CC @cryptokraze