Crypto Academy / Season 3 / Week 7 - Homework Post for @kouba01 | Trading Crypto with Average Directional Index (ADX) Indicator
Andreas Thalassinos, Head of Education FXTM in his book, 50 successful Traders habit said: “The trend is your friend”.
The concept of financial market trading and in our context crypto trading is majorly about catching the trend and riding with it till its safe to pull out.
How then do we catch this trend, lets us read on.
Good day beautiful Steemians, I am @hadassah26, welcome to my Steemit crypto academy season 3 week 7 homework for professor @kouba01 on: Trading Crypto With Average Directional Index (ADX) Indicator.
.png)

”1. Discuss your understanding of the ADX indicator and how it is calculated? Give an example of a calculation. (Screenshot required)”
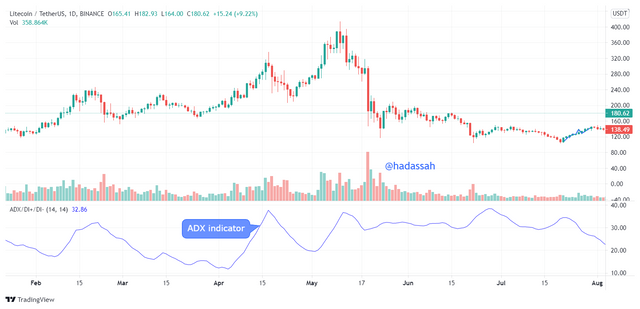
The ADX (Average Directional Index) indicator is a “trend indicator”. Derived from the DMI (Directional Movement Index). The ADX Indicator basically only tells traders of when market is going into different levels of trend. This which can be categorized by the position of its oscillating line between the range of "0" and "100".
The ADX indicator line position can be categorized into:
- 0 to 25: No Trend/Trend weakness
- 25 to 50: Strong trend, Good time to get into the trend
- 50 to 75: Very Strong trend, traders should start getting out of the trend
- 75 to 100: Extreme trend volaitility. Time to leave the trend to avoid retracement
But going into a trend isn’t all there is about a trend right, we also need to know which trend the market is going into, here is where the father of ADX comes in play.
The DMI (Directional Movement Index) developed in 1978 by the technical indicators wizard John Welles Wilder Jr, creator of the RSI (Relative Strength Index) indicator and the Parabolic SAR gives a full signal of when price is about to go into trend, and what trend it is.
The DMI is an indicator of three sub indicators, which are:
- The Directional Movement Positive (DI+)
- The Directional Movement Negative (DI-)
- The ADX
With the DI+ always trending up in an uptrend, and the DI- trending up in a down trend, while the ADX trending up when the space between the DI+ and DI- increases, the ADX can be calculated through the DI+ and DI- as:
First we calculate the Directional Movement Index Positive and Negative:
DMI+ =Current High - Initial HighDMI- = Initial Low - Current LowThen we calculate the True Range;
TR = MAX[(PH-PL),(PH-C),(PL-C)]Where:
PH = Highest Price of the Day
PL = Lowest Price of the Day
C = Current Price of the Day
Then we smoothen the True Range, this can be done any way, either finding the Moving average, or
Exponential moving average for a certain period, or the Wilders proposed smoothening method of:
ATR = ((ATRi - 1) - (ATRi - 1/n)) + (ATRi)Where n = The period of smoothening.
ATRi = Initial Average True Range.
Now we calculate the Smoothened Positive and Negative Directional Indices (DSI+ and DSI-). This is basically smoothening the Directional Movement Index.
DSI+ = (DSIi+(-1) - (DSIi+(-1 / n))) + (DSIi+)DSI- = (DSIi-(-1) - (DSIi-(-1 / n))) + (DSIi-)Where:
DSIi+ = Initial Smoothened Directional Index Positive
DSIi- = Initial Smoothened Directional Index Negative
Then we calculate the Directional Indices for the ADX: DI+ and DI-
DI+ = (DSI+/ATR)*100
DI- = (DSI-/ATR)*100
Then we calculate for the Directional Index, this is the absolute value of the DI+ plus DI- divided by
the absolute value of DI+ minus DI-
DI = |(DI+)+(DI-)|/|(DI+) - (DI-)|*100Then finally we can calculate directly for the Average Directional Index:
The ADX being a real time average indicator, we multiply the initial period's Directional Index minus 1
by 13 then add the new Directional index then multiply by 100.
ADX = (((ADXi-1)*(n-1))+(DI))/nN/B:
For all initial values, the Period used in calculating them must also be equal to n.
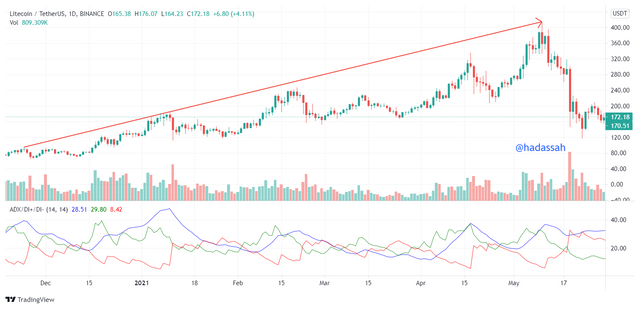
Let us take an example:
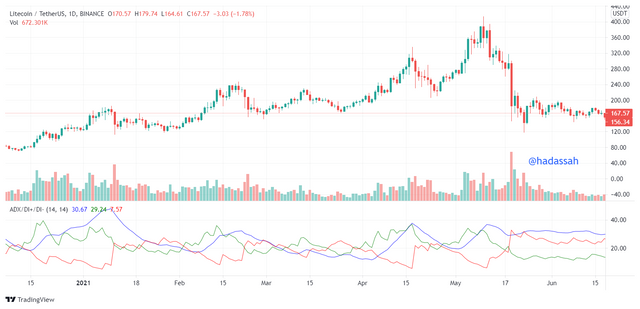
In the LTC/USDT chart above, the period is set at n = 14.
Parameters gotten shown below;
Highest Price of the Day PH = 180.09
Lowest Price of the Day PL = 165.75
Current Price of the Day = 165.37
Initial high = 176.50
Initial Low = 164.52
DSI+ initial = 30.15
DSI- initial = 8.56
ATRi = 28.82
Calculating the next ADX, we first calculate the DSI+ and DSI- =
DSI+ = (DSIi+(-1) - (DSIi+(-1 / n))) + (DSIi+)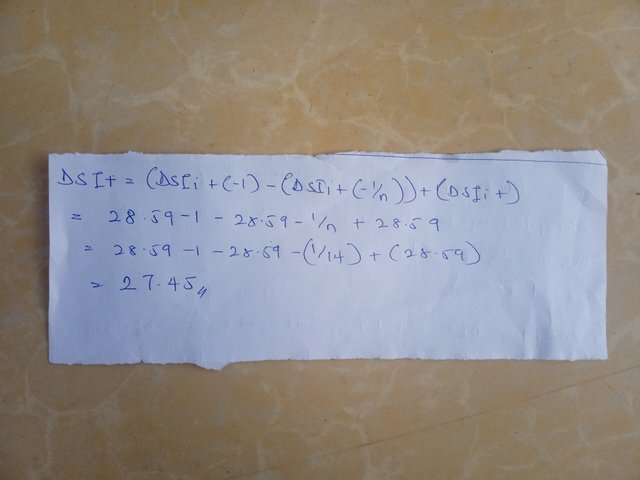
DSI- = (DSIi-(-1) - (DSIi-(-1 / n))) + (DSIi-)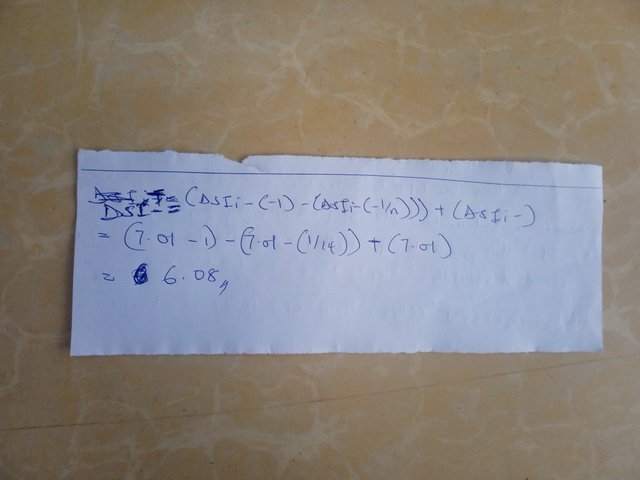
ADX = (((ADXi-1)*(n-1))+(D wI))/n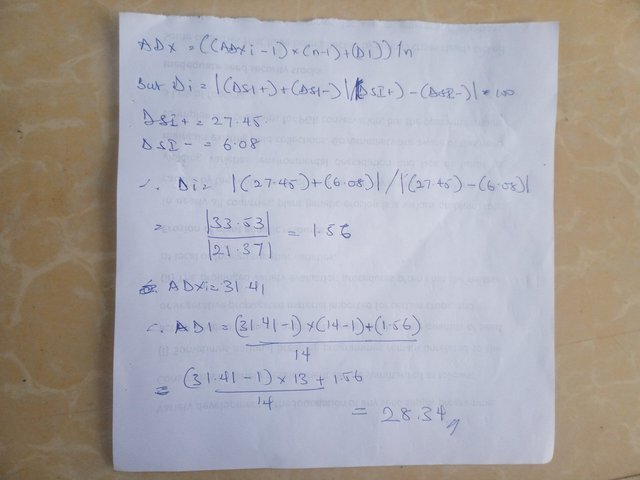
”2. How to add ADX, DI+ and DI- indicators to the chart, what are its best settings? And why? (Screenshot required)”
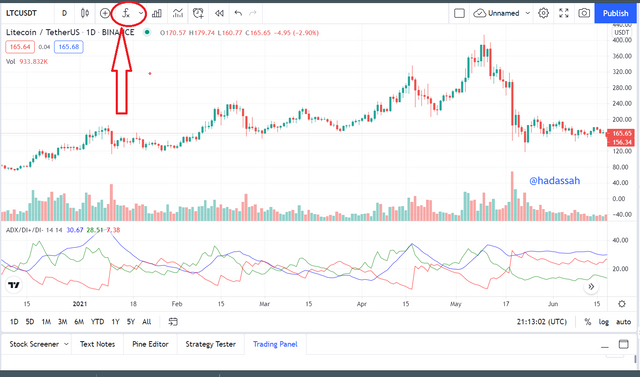
To add the ADX indicator to the chart, we open our Trading View, and select a chart as shown below:
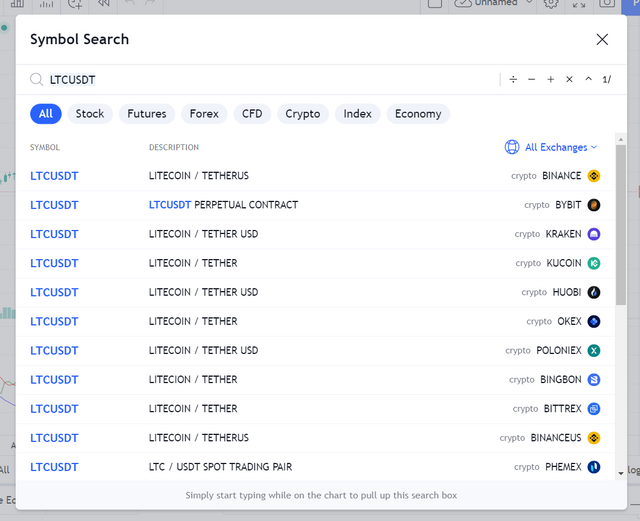
· We then click on the “fx” icon, and type in “Average Directional Index” and choose “Average Directional Index with DI + and DI-“
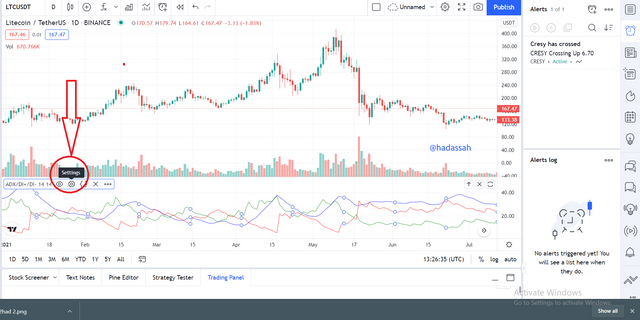
Now we have our ADX properly in the chart. We now have to set it up to suite our trading style.
· To set the ADX up, we click on the setting icon as shown below:
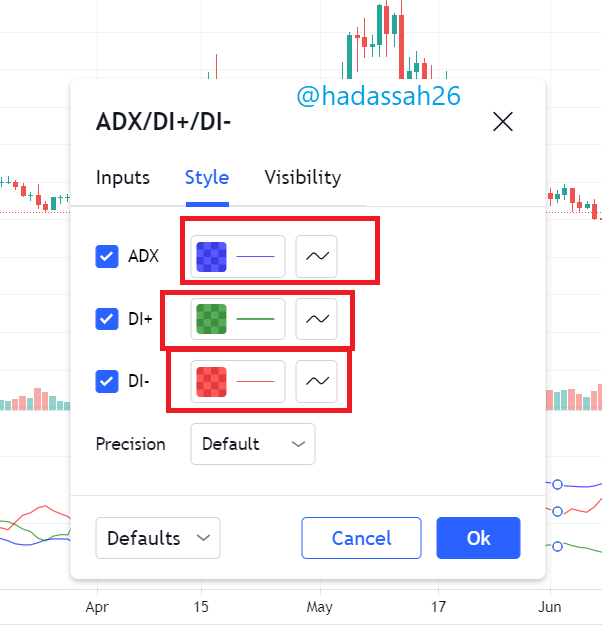
· Now we can make it easily visible by setting our style lines to bright colors as shown below:
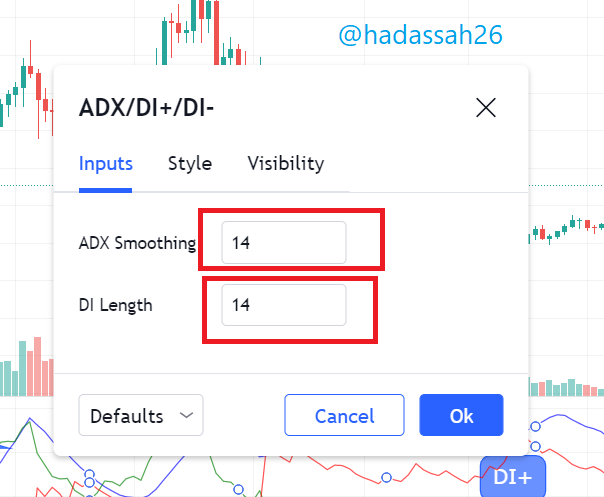
Now we fix our input.
On fixing our input settings as regards to the second part of the question, generally it is best not to set very short periods for our oscillatory indicators so they don’t become too fast, or very long periods also so they don’t become too slow.
So setting our input on the ADX, we put it at a 14 period. This because it is 14 by default so many traders may be trading with same setting therefore making our prediction in sync, and also 14 is not so short as say a 9, and also not so long as say 50 or even a 100.
”3. Do you need to add DI+ and DI- indicators to be able to trade with ADX? How can we take advantage of this indicator? (Screenshot required)”
Knowing there is a trend is one thing, what trend it is, is another. The ADX indicator which only tells of if there is a trend and the strength of that trend is a fairly good enough stand alone indicator.
But with the ADX being derived from the DI+ and DI- tell us already it will be a lagging indicator. The DI+ and DI- indicators which also tell us of the current direction of trend, and at a faster rate make them very necessary to be added to the ADX indicator when reading the chart.
So theoretically we must not add the DI+ and DI- to the ADX, but practically they are necessary for knowing where the trend is going and reading the trend at a faster rate.
The ADX indicator added with the DI+ and DI- indicators form the DMI indicator.
To take advantage of this indicator, we use the ADX to determine the start and intensity of a trend.
With the ADX as an oscillatory indicator that oscillates between "100" and "0" margin, we should majorly be concerned about the start of a trend which usually starts from the 20 to 25 line margin and when a trend has become very volatile between 75 and 100 margin.
So we start out by using the ADX to know if atall there is a trend, then we go ahead to use the DI+ and DI- to know if it is a down trend. Let us take an example below:
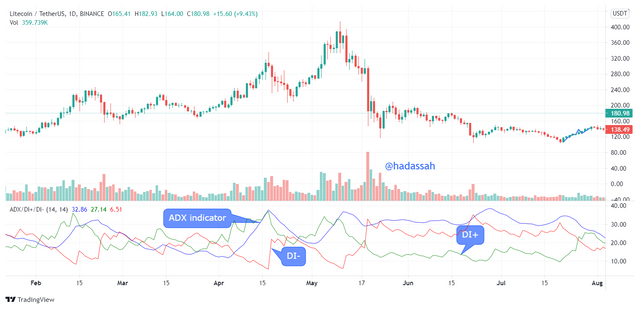
Looking at the LTC/USDT Daily chart shown below, from late last year as at 16th November 2020 we can see that as the ADX picks up from the 25 line, we can see a general but steady uptrend of price from then till very recently.
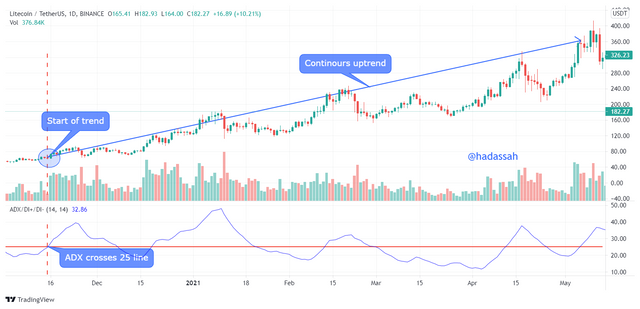
Adding the DI+ and DI-, we see the DI+ already picked up above the 25 line as of 6th November 2020, this tells us that the DI+ is faster than the ADX.
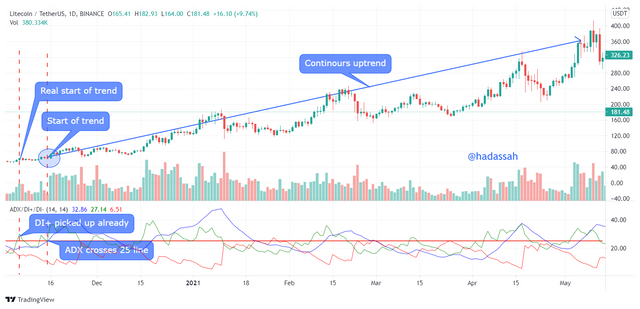
Next we notice the DI+ is predominantly higher than the DI- throughout the period, this again tells us of the consistency of the trend.
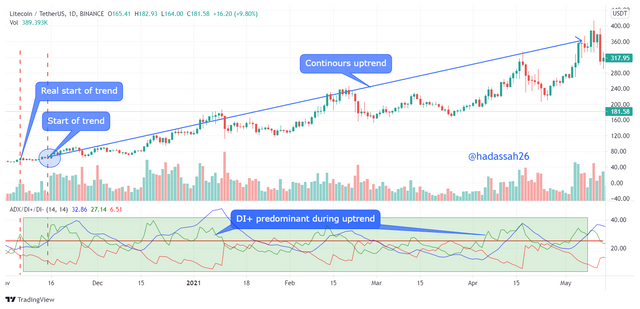
From the above simple analysis we have been able to predict a trend, taking advantage of the ADX indicator.
"4. What are the different trends detected using the ADX? And how do you filter out the false signals?"
The trends determined by the ADX indicator depend on the vertical position of its line.
We have four recognizable trends signaled by the ADX, they are:
· Neutral/Weakening Trend: The Neutral trend also known as a ranging market are periods of consolidation in the market.
At these times the ADX line is between the range of 0 to 25. Here we see price fluctuating within a box forming consolidation patterns such as the wedge , triangle etc.
It is advisable to avoid trading in such markets due to the uncertainty of the next direction of price.
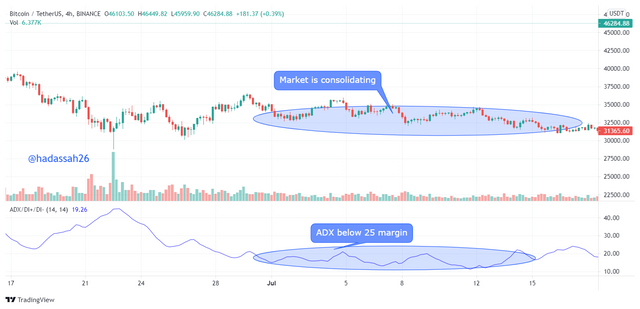
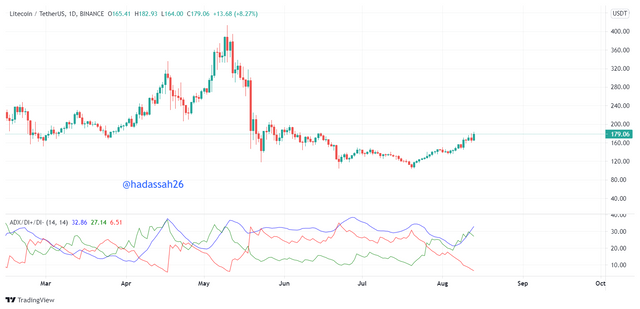
In the chart above, we can see the ADX is below the 25 margin, this is reflected on the chart, traders should now wait for a clear trend market signal and confirmation before entry.
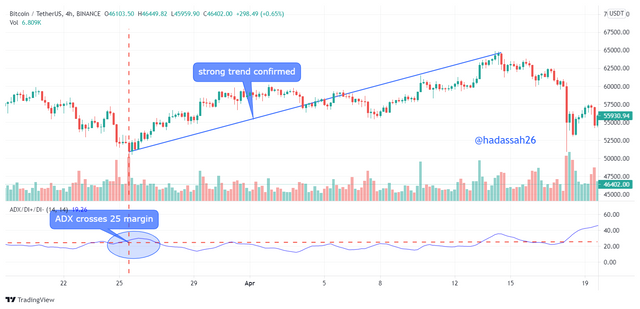
· Strong/Well Defined Trend: Traders always watch for a well defined trend, and the ADX signals this at points where its line is at a position between 25 and 50. Looking at the chart below, we can see price starts out to trend and we can notice it was already signaled by the ADX when it broke the 25 margin as shown. We can now take advantage of the trend to place good trades.
· Very Strong Trend: As the trend increases, the ADX increases fluctuating higher, traders can now spot these positions by searching for where the ADX line ranges between 50 and 75 margin. These positions can be used by scalp traders to quickly go into the market and ride the trend till its next resistance or support. Let us take an example:
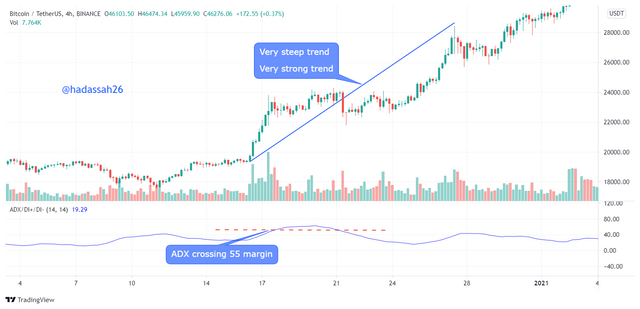
In the BTC/USDT chart above, we can see the ADX is at the 75 margin Level, from our categorization it is a very strong trend. Here we see price getting a little volatile, before consolidating a little and then continuing on the uptrend.
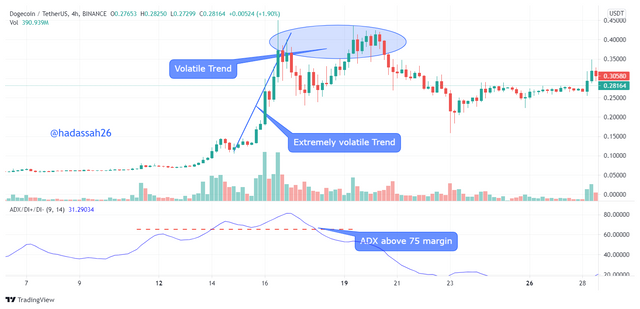
· Extreme Volatile Trend: Just as there can be no trend, the market may also show extreme price volatility. From spiking market to price being at high/low liquidity levels. At these points the ADX is usually at a very high position, above 75 margin. It is advisable to avoid such markets as retracement is imminent.
How to Filter false Signals
False signals are inevitable with technical indicators, they are only mathematical formulas not soothe sayers. With the ADX which is no exemption, it may sometimes give us "trend signals" at price spikes or may still be showing a "trend signal" when market is consolidating.
One way to filter false signals is by the addition of supporting indicators such as the RSI or moving averages and watching price action.
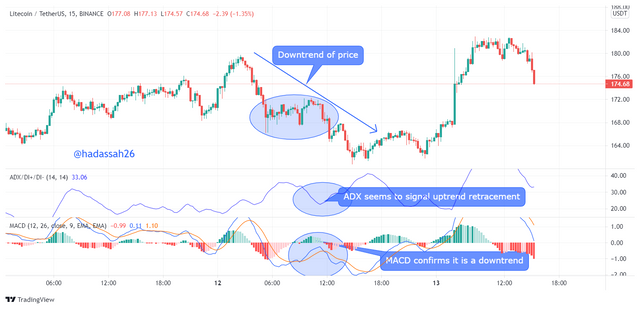
Taking a look at the chart above, we can see price is in a current downtrend. It soon starts consolidating and the ADX is seen to go below the 25 margin. Price soon continues trending back down and the ADX is seen to spike up.
Traders may mistake this as an uptrend retracement or take it as a false signal by the ADX.
We have now used our MACD to clarify and see our histogram has gone really high and is signifying a down trend is imminent.
We can then confirm this is a downtrend and the false signal is rectified.
"5. Explain what a breakout is. And How do you use the ADX filter to determine a valid breakout?"
Break outs are points in the market where it starts out either moving bullish or bearish usually after a consolidation.
Below is an example of a breakout.
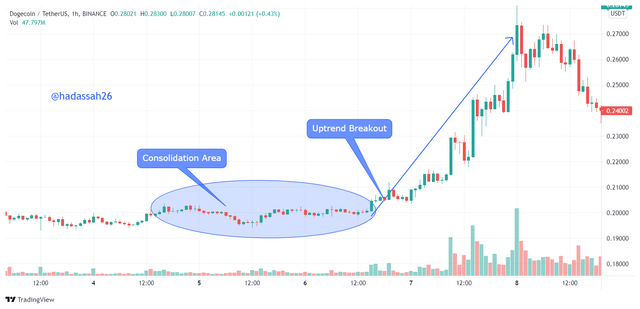
Using the ADX to detect breakouts makes it easier for traders to visualize since they majorly have to watch out for points where the ADX breaks through the 20 to 25 margin.
BUY scenerio Breakout
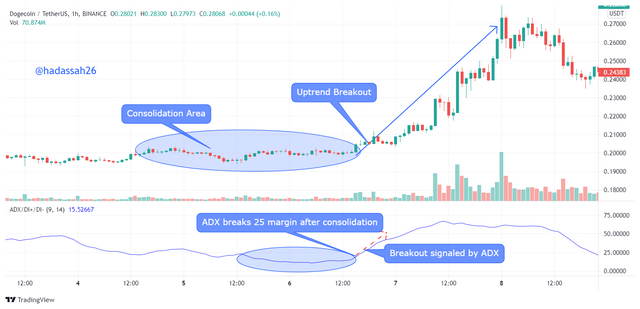
Looking at the DOGE/USDT chart above, we see price consolidating before the breakout. This is also shown on the ADX as it is also below the 25 margin before it makes a sharp move breaking the 25 margin. A breakout is formed on the chart.
Traders can use this signal of the ADX indicator to detect breakouts and trade profitably.
SELL scenerio Breakout
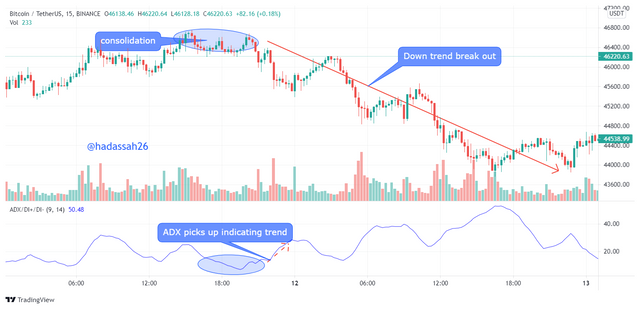
From our BTC/USDT chart above, we see a quick bearish breakout of price after little consolidation. we can confirm this with our ADX indicator as it ranges a little below the 25 margin then plunges back up, signifying a new trend, a breakout trend on the downside.
"6. What is the difference between using the ADX indicator for scalping and for swing trading? What do you prefer between them? And why?"
Scalping and Swing trading which are different types of trading patterns and used by different traders can both be done using the ADX.
ADX for Scalp Trading:
Scalp trading involves quick gains, catching quick market moves and getting out. Well this which needs fast moving indicators such as the Stochastic oscillator, can also be done with the ADX and then adding such fast indicators as supporting indicators.
On the role of the ADX in scalp trading, it should tell traders of quick breakouts but also not sending signals on noise/spikes of the market. It will thus be advisable to use a higher period for the ADX, say a 100, then trading lower timeframes. Adding the supporting indicators can then give a good visual signal to making quick gains.
let us take an example:
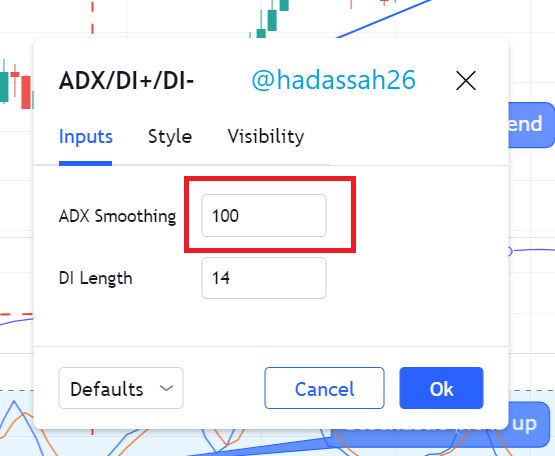
ADX period set at 100
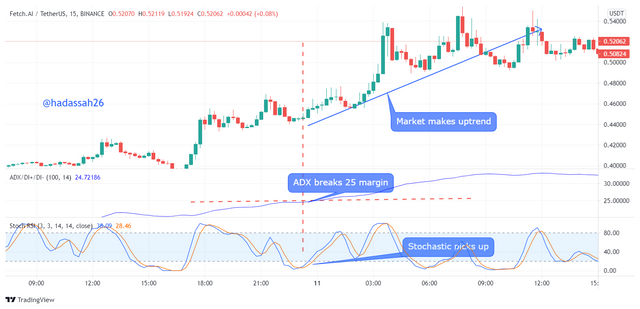
From the FET/USDT chart above, we can notice we set our ADX period to 100 to accomodate noise, and our watch timeframe is 15 mins.
On the chart, we can see our stochastic oscillator trends upward signifying some upward momentum.
Our ADX has also crossed the 25 margin signifying some trend, here in the upward direction. We can now watch price and seeing it is going upward we place a buy position.
Price goes some pips upwards, it is a good case of scalp trade made using the ADX and a supporting indicator.
ADX for Swing Trading:
Swing trading involves watching the market for good breakout/entry positions on higher timeframes ranging from daily to some few days.
Using the ADX for swing trading is seems more compatible, since the ADX shows of good starts of a trend and allows traders to confirm with price action.
Swing trading with ADX can be made better with using other trend detection/entry confirmation indicators such as the Ichimoku Uno, this way one can confirm the start of a trend with the ADX and enter after either a resistance or support using the Ichimoku Uno.
Let us take an example.
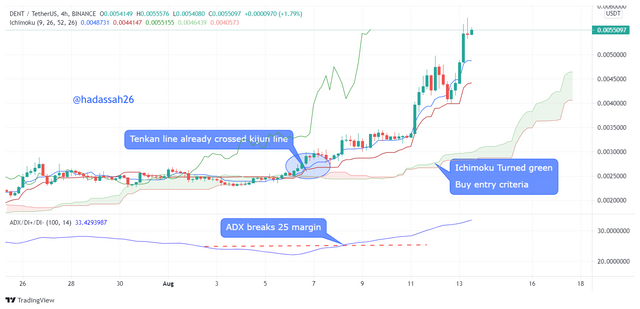
From the above DENT/USDT chart, we are swing trading using our ADX supported by the Ichimoku cloud.
Here we want to watch price action, and the Ichimoku Uno, still keeping our eyes on our ADX indicator.
The ADX indicator has broken the 25 margin, and we can confirm our Ichimoku with its cloud giving us a buy entry signal. We watch the price action and Chikou line and they have both crossed the cloud resistance.
The Tenken and Kijun lines also give us a buy entry, we can now place a BUY position. Price makes good uptrend, profit is taken.
MY CHOICE
From the above, I prefer the Swing trading method because it allows me the privilege of time and better confirmation.
Secondly scalp trading can be very fast and can incur huge losses since one might want to over leverage to meet up with profits.
Lastly price action trading is better with swing trading of which is my personal trading strategy. So finally I prefer swing trading is more preferable by me.
In conclusion, we can say the ADX is a very useful indicator as it tells us of basically what we are looking for: "The trend".
It also needs some experience as traders may easily mistake downtrend continuation as uptrend startouts.
Using the ADX with supporting indicators is very good as it eases reading other price parameters for the trader. But too many indicators can make the price blurry and confusing to read.
Thanks.
CC @kouba01
Hello @hadassah26,
Thank you for participating in the 7th Week Crypto Course in its third season and for your efforts to complete the suggested tasks, you deserve a 10/10 rating, according to the following scale:
My review :
Very excellent work which covered the subject in all its aspects in a superb manner and with a solid methodology. Most of the answers were precise and direct, which confirms your good understanding of the questions asked.
Thanks again for your effort, and we look forward to reading your next work.
Sincerely,@kouba01
Wow, So happy Sir @kouba01, atleast my hardwork paid out.
Thanks for the assessment.