Crypto Academy / Season 3 / Week 1 - Homework Post for @kouba01
Can you predict the future, can you go back in time. If you could take a glimpse at life, could you tell what the future held. I guess these must have been what was going through the mind of Goichi Hosoda As a financial market journalist on the financial markets, if he could tell the future of the market just by the charts.
Goichi Hosoda who developed the Ichimoku Cloud with the help of other Asian students prodigies ended up creating a unique indicator, one which tries to use the equilibrium of the market to predict its future.
Goichi Hosoda's Ichimoku Cloud and Mikhail Kalashnikov's Automat Kalashnikova (AK 47) which were produced around relatively same time have something in common, they were made to be a “standalone” instrument.
Good day beautiful steemians, I am @hadassah26, welcome to my Steemitcrypto Academy season 3 week 1 homework for professor @kouba01 on Trading Crypto With Ichimoku-kinko-hyo Indicator - Part 1.
I really do appreciate the Steemitcrypto Academy for the new structured setup, creating a 3 phase system, more thanks to @sapwood for the great idea.
Now to the Ichimoku.
"1. What is the Ichimoku Kinko Hyo indicator?"
The Ichimoku Cloud indicator/price direction predictor of Asian origin is a unique indicator which tries to give the momentum, the price volatility, the market trendiness and most importantly the projected future direction of the price in one chart.
The Ichimoku Cloud indicator which is the brain child of Goichi Hosoda was published as a paper in 1968, as a standalone indicator for Asian traders in the Asian market.
1b What are the different lines that make it up?
The Ichimoku Cloud which was designed in a unique way, has some great sub indicators which I will categorize into 3, they are the Current market Trend indicator equilibrium lines, Past/Lagging market reconfirmation line and the
Future/Support and Resistance cloud lines
These lines which follow the price closely realtime, are like simple moving average line giving trend indication on theri crossovers and general trend sentiment on their relative position to price.
• Tenkan-Sen: Looking so much like the simple moving average 9 set at close indicator line, the Tenkan line is rather the equilibrium of the past nine periods, meaning the tankan line is the sum of the highest price within the last nine periods and the lowest price then divided by two.
Tenkan line = (9PH+9PL)/2where: PH = Periods High
PL = Periods Low
I will be explaining more about the tankan line in question 3 on how to use the Tenkan line.
• Kijun-Sen : Also like the tekan line, the kijun line is an equilibrium line, though with a longer period.
The kijun line which takes the highest price within the last 26 periods and the lowest price within that same period sums them together and divides them by two.
Kijun line = (26PH+26PL)/2where: PH = Periods High
PL = Periods Low
I will be explaining more about the Kijun line in question 3 on how to use the Kijun line
This which is the price close replica line, tries to show traders the re-confirmations on resistance and support regions of current price:
• Chikou span*: The chikou span line is an intentional lagging indicator, this means it was made to lag behind price 26 periods. The chikou span which is set at close and projected backward gives the current close of price 26 periods behind.
I will be explaining further on the chikou span on question 4 on how to use the chikou span
Goichi Hosoda tried to project the future, what it may hold, this must have been the toughest part of his design, he came up with two lines which are:
• Senkou span A: The Senkou span a line which is the mean of the current tankan line and kujin line projected 26 periods ahead. This means:
Senkou span line A= (Current Tenken line value + Current Kijun line Value)/2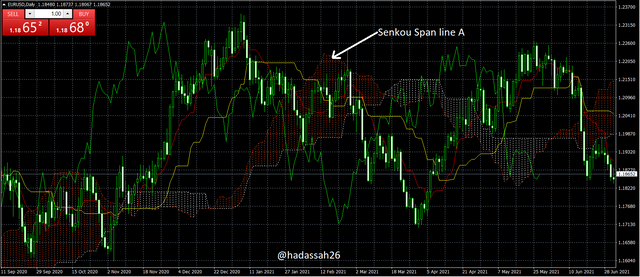
• Senkou span B: The Senkou span B line which is an equilibrium line, but on a much longer period, is the sum of the highest price in the last 52 periods and the lowest price in the last 52 periods divided by 2.
Senkou span line B = (52PH+52PL)/2where: PH = Periods High
PL = Periods Low
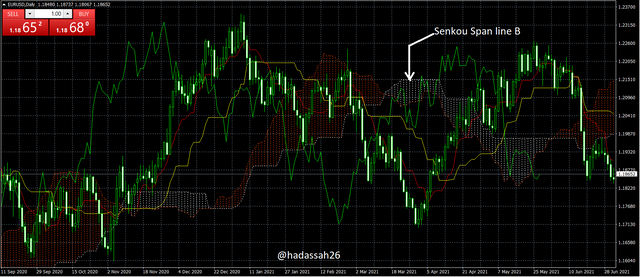
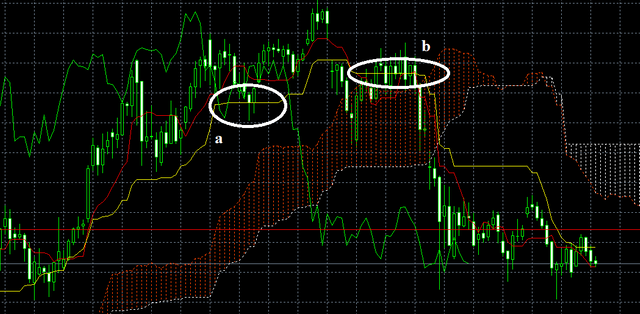
Working together, the Senkou span A and Senkou span B lines form the Ichimoku cloud, this which is a projection of the future sentiment of price, also serves as a support and resistance zone for current price.
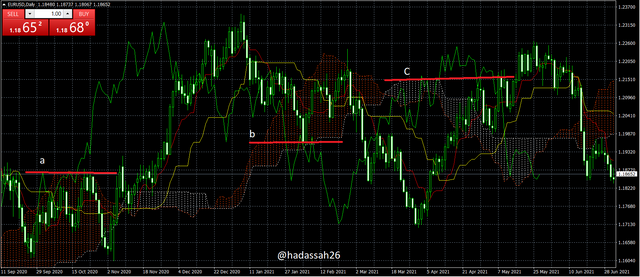
In the pic above we can see how the senkou span lines A and B act as a resistance line at a, as a support line at b, and as a resistance line at c.
"2. How to add the Ichimoku indicator to the chart?"
To add the Ichimoku cloud indicator to my chart using the MT4 app, first I open my MT4.
.png)
Then I select a chart (currency pair)
.png)
I click on the f+ symbol and navigate to trend indicators where I see the Ichimoku kyo uno indicator.
.png)
I put the needed setting and viola my Ichimoku cloud indicator is working already
What are its default settings? And should it be changed or not?
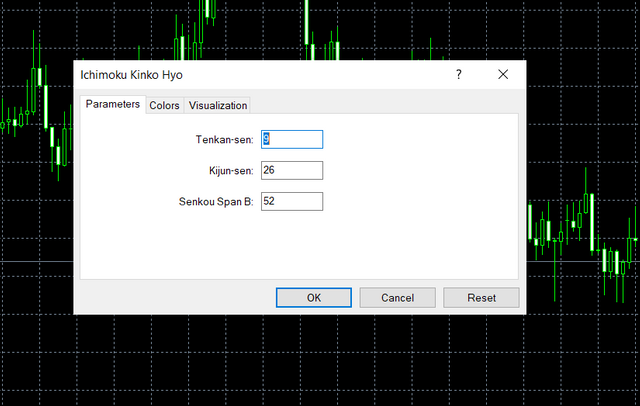
The default settings of the ichimoku indicator are the 9, 26, 52 for the Tenkan, Kijun and Senkou Span line B.
This settings which were derived empirically from the ancient japanese trading market/working day time can be well adjusted to fit your own trading time and style.
I choose to use the default settings since it synchronizes well with my price, and gives me good signals. the ichimoku default settings which also work well with volatile markets as the crypto market makes me advice the us of it.
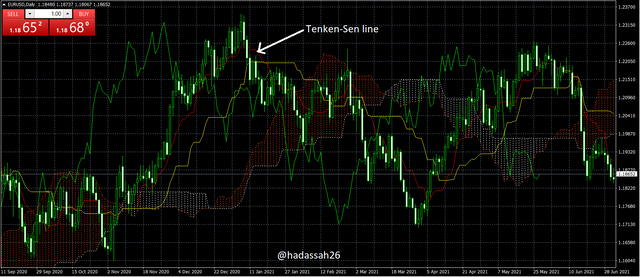
"3. How to use the Tenkan span line"
Tenkan line:
The Tenkan line which is an equilibrium line, and the faster of the two major equilibrium lines of the Ichimoku Cloud with its formula stated above, the tankan line has its very unique characteristics:
• Price action Detection: Unlike the moving average which it is mostly mistaken for, the tenkan line gives a more current status of the market.
Let me explain:
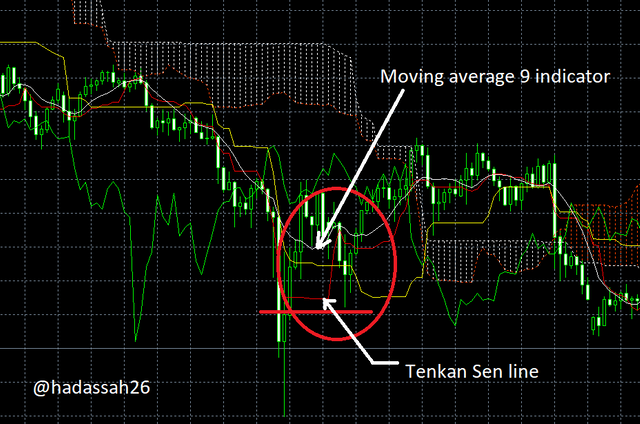
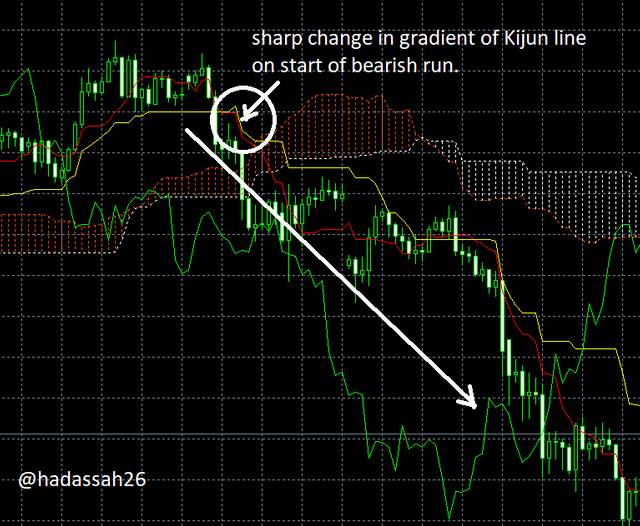
Looking at the picture of the moving average and tankan line above, we can see the moving average becomes bias on consolidating market since it still gives a trendy gradient. The Tenkan line on the other hand drops in slope and gives a more horizontal shape, this which tells better of the current price action can be very helpful especially to newbies.
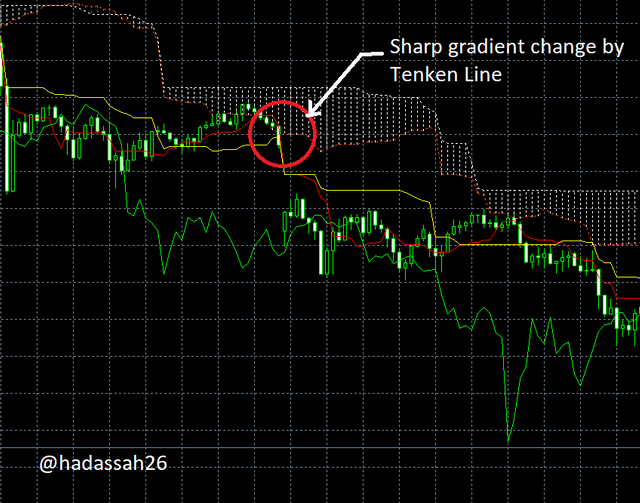
Also the Tenkan line gives us a view of price volatility with its sudden change in gradient telling us of price volatility and a good entry point if all signals show same trend confirmation. This becomes a good entry point, to tap on the new trend before it wears out.
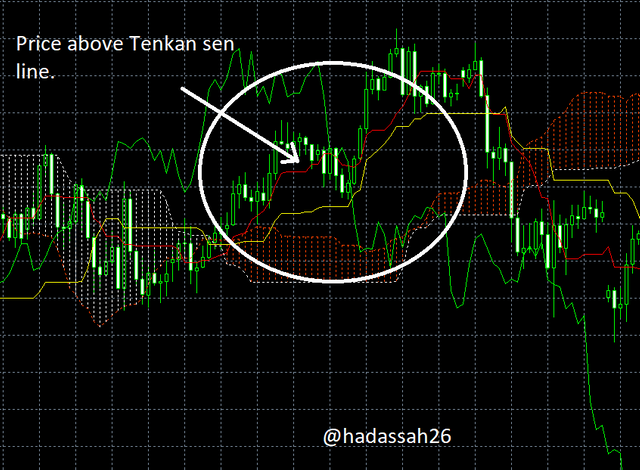
• Trend Detection: Now like every other trend indicator line, the Tenkan line also gives a signal of current trend, and change in trend of price by its position relative to price and the kuji line.
When price goes above the tankan line, it signals a current bullish sentiment, so also the reverse when price is below the tankan line.
How to use the Kijun Sen line?
Khuji line: kijun line, the second of the major equilibrium lines of the Ichimoku Cloud with its formula discussed above, the kujin line is the slower of the two major Ichimoku Cloud Equilibrium lines.
I personal call the Kujin line a confirmation line since its major moves or major moves on it are usually signals of confirmation.
The kijun line like the tankan line also gives two signals telling traders of the current status of price. These signals are:
• Price action/Momentum Indication: The kijun line which like the tankan line tells us of the current price action, although slower still gives us the current trendiness of price.
With the kijun line giving straighter lines on ranging markets, traders will be able to avoid trading uncertain markets and wait for right confirmation before entry.
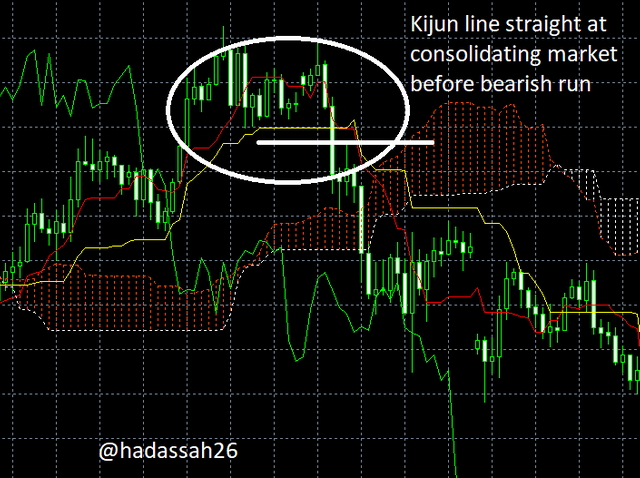
Also with increase in velocity of price, the kijun line changes gradient, telling us of an increase in price momentum.
• Trend/Support-Resistance Indication: The kijun sen line like slower moving averages can also act as a dynamic support and resistance to price. this which helps traders find new entry points in an already sailing trend market.
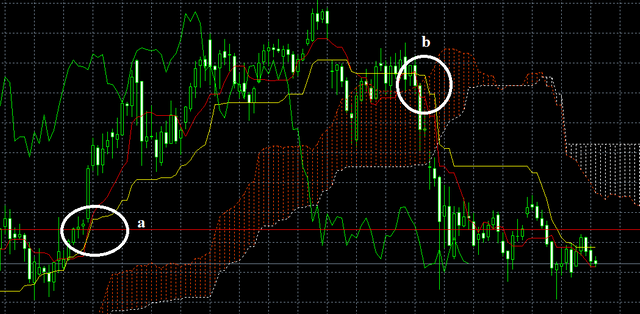
In the Screen short above on the chart, we see the Kijun span line acting as a support line at a and a resistance line at b.
And How to use them simultaneously?
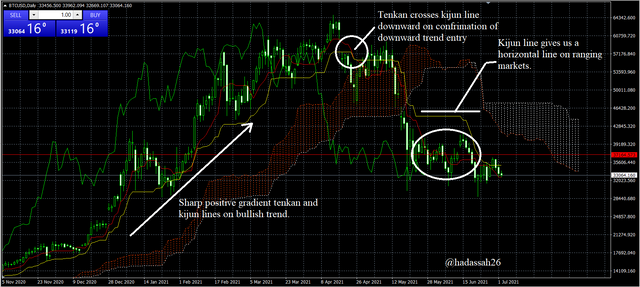
The Tenkan and Kijun lines work together as new trend entry confirmation/reversal confirmation signals. this which occurs when the tenkan line crosses the kijun line in either direction, where upward crossing means a buy trend signal and downward crossing meaning a sell trend signal.
In the picture above we can see that at a on the chart, the tenkan line crosses the kijun line confirming a bullish trend entry at a and a bearish trend entry at b.
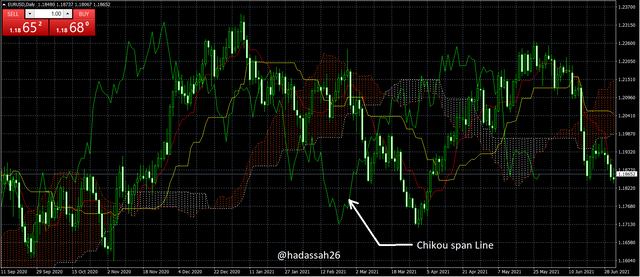
"4. What is the chikou span line?"
Chikou span line*
As I started in question 1 on the chikou spanning line* it is a present backtracked line created with the aim of trying to look at the current market if it was in the past. This which helps traders confirm resistance and support zones and make better trading decisions.
How to use the Chikou span line
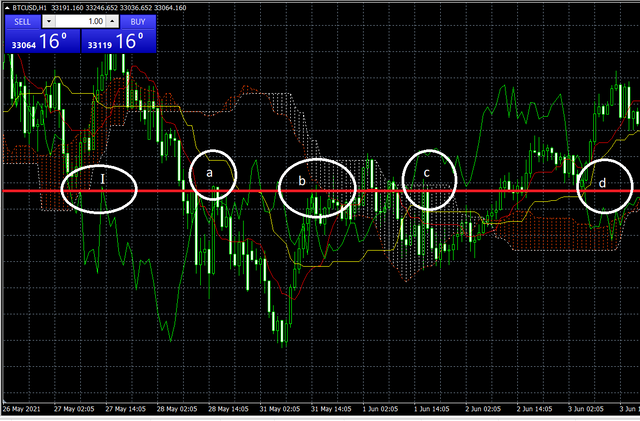
Looking at the chart above, we can see the chikou line gies us a re-confirmation of support and resistance points which spans through a, b, c and d, helping traders know points of market weakness and re-entry.
Why is it often neglected?
The chikou span line is usually neglected because traders are not usually conversant about its usefulness, the chikou span line is a great resistance and support confirmation line, and also it gives a view of the strength of price.
Also traders most times have other more reliable support and resistance indicators which make the chikou span line a little unnecessary.
"5. What's the best time frame to use Ichimoku?"
Trading styles differ among traders and like most other indicators, the Ichimoku Cloud works with periods so it should fit into any timeframe.
But looking at the origin and creators intent of the Ichimoku Cloud, we notice it was made to take into consideration the days of the week and month (as explained in question 2), so it was more built as a weekly price predictor and from intrinsic experience it works fine on the daily time frame.
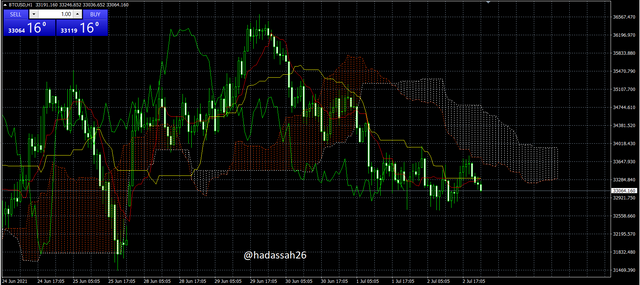
Looking at the daily chart of the BTC/USD, we see the Ichimoku Cloud Synchronizes well giving us good entry and exit points as marked up in the picture above.
So I will suggest using the Ichimoku Cloud on the Daily time frame as it is a higher timeframe(usually influencing smaller time frames) and more with the fact that the intent and settings of the Ichimoku Cloud indicator were made for daily chart analysis.
What is the best indicator to use with it?
As a big fan of the MACD, I will suggest using the MACD alongside the Ichimoku Cloud these two which work properly with each other can be explained properly with the pictures below:
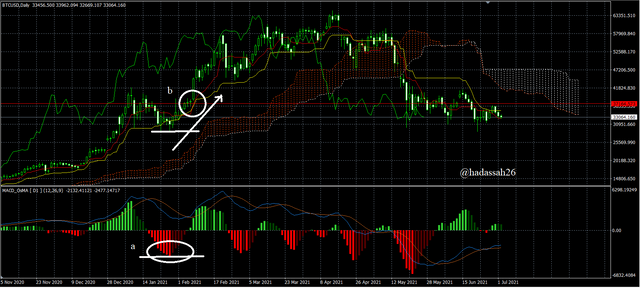
Here we see the MACD as a faster momentum signal indicator has its histograms already declining at a giving a entry point for the bullish run, the Tenkan and kijun lines soon confirm it above at b re-confirming the entry position.
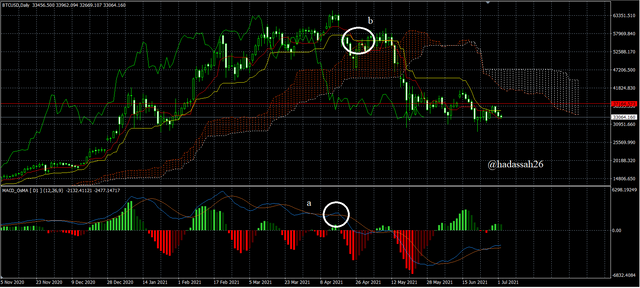
The MACD also gives good trend signals and at an earlier time, this which is then re-confirmed by the Ichimoku Cloud . looking at the chart above, we can see that at a, the MACD had already made a crossing against its signal line, then at b the Ichimoku Cloud then makes its own crossing. This confirmation is a good entry point and we can see the amount of profit we should have raked if we went in at such perfect time.
"6. Conclusion:"
I guess Goichi Hosoda was finally able to predict the future, atleast weighing the dynamic momentum of price and projecting it forward.
Again like the AK 47, the Ichimoku Cloud Is very easy to use, it can be used by traders of any level and more it works well on any timeframe and fits into most markets from stocks to cryptocurrencies.
N/B
when using the Ichimoku indicator, try confirming with a second indicator or price action as all indicators can sometimes give wrong readings.
Thanks
CC @kouba01
Wow you did a great job here thanks
Hi @mccoy02, thanks.
💲💲Earning rewards at Yamgo is super easy! 📲Just sign up and Boom! The reward is yours🤑🤑🤑. What are you waiting for? Register now! https://yamgo.com/ ⚡⚡
Hello @hadassah26,
Thank you for participating in the 1st Week Crypto Course in its third season and for your efforts to complete the suggested tasks, you deserve a 9.5/10 rating, according to the following scale:
My review :
An article with excellent content in which you addressed the subject in all its aspects by answering the questions accurately and through a clear methodology.
Thanks again for your effort, and we look forward to reading your next work.
Sincerely,@kouba01