Candlestick Patterns - Steemit Crypto Academy Season 4 - Homework Post For Task 10 by @giftye

QUESTION 1

EXPLAIN THE JAPANESE CANDLESTICK CHART?
A Japanese candlestick chart is a form of financial chart that has been adopted ad used in explaining the movements of theprice of a Currency, security or a derivative. Generally, each candlestick represents one day, inverably a chart may show a 15 days trade as 15 candlesticks. Candlestick charts can also be created with a time frame that isn't exactly one day,it can be longer or shorter than a day.
This candlestick here is labeled reversely in it's "open" and "close". This is because an open that is lower than the close is what a green candle signifies.
This concept "candlestick charting was brought forth by
Munehisa Homma(a Japanese rice trader)
. During his normal trading sessions he noticed that the emotions of traders had a way of affecting and influencing the the rice market ,he also payed attention to the effect of supply and demand forces of the rice price.
Homma then formulated candlesticks that showed the nature and movements of price graphically by identifying differences with colours. Traders can now make use of the candlesticks to understand price action patterns and make good decisions based on the direction of prices in a short term.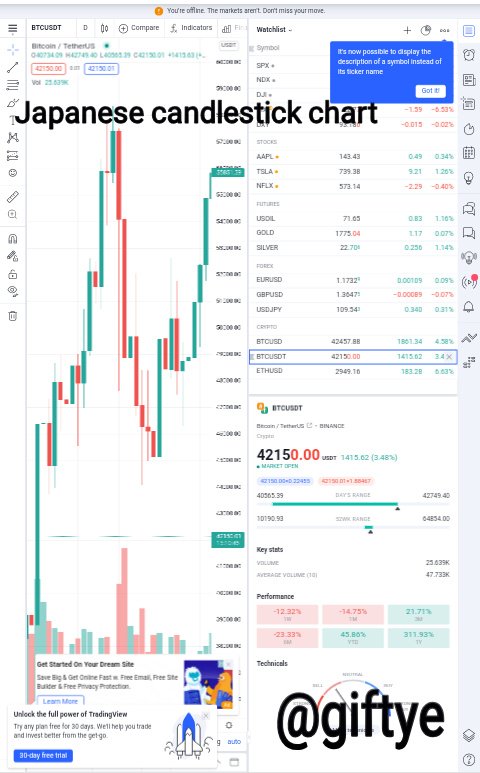
KEY POINTS ON CANDLESTICK CHART
- Candlestick charts are adopted by traders and used in technical analysis (to determine the possible movement of price based on it's past movements and pattern).
- Candlesticks are vital for trading as they show four points for price (open, close, high and low) according to the specified time of the trader.
- Emotions are often used to dictate trading, which is readable in the candlesick charts.
IN YOUR OWN WORDS, EXPLAIN WHY THE JAPANESE CANDLESTICK CHART IS THE MOST USED IN THE FINANCIAL MARKET
Comparing the Japanese candlestick and a bar chart, it's obvious that both charts presents the trader with the same kind of informations but in different ways and formats. Candlesticks are mostly used because of their ability to present the trader with a more adequate financial information, like:
- They are more visual. They provide a more graphically clear picture of the action and movements of price to the trader.
- They readily display the supply and demand forces graphically, which contributes to each interval of a price movement.
- One powerful attribute of the candlestick chat is that it shows reversal signals on time, faster than Western charting techniques.
- Just by having a glance at the market, traders will be able to tell if the market is either a bearish (weak) or a bullish (strong) one, by observing the length and colour of candlestick.
DESCRIBE A BULLISH AND A BEARISH CANDLE. ALSO EXPLAIN IT'S ANATOMY
This candlesick shows a way of trading price for a single security, it indicates a price trend reversal. Description of the bullish candlestick is as follows:
- A bullish candlestick pattern presents a stock price trend reversal ranging from a downward trend to an upward trend.
- A red candlestick that shows a downtrend is fully engulfed by a bigger green candlestick that shows an uptrend the next day.
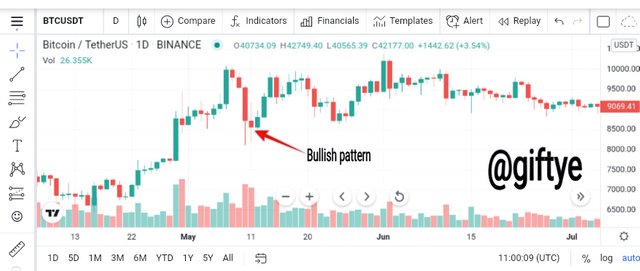
- This candle encourages traders to assume a buy position with the intention of selling it at a higher price on a future date. In other words, GOING LONG
When there's a security close at a price that it's higher than when it opened, the candlestick is coloured green or made hollow (then we have a green or hollow candlestick). Inversely, when the price at the closing lesser than the price at the opening, the colour of the turns red or black (then we have a red or black candlestick). A red candlestick represents or shows downward trend in price and shows a market phase that is bearish, but when the green candlestick engulfs the red one, we have a bullish engulfing candlesick pattern.
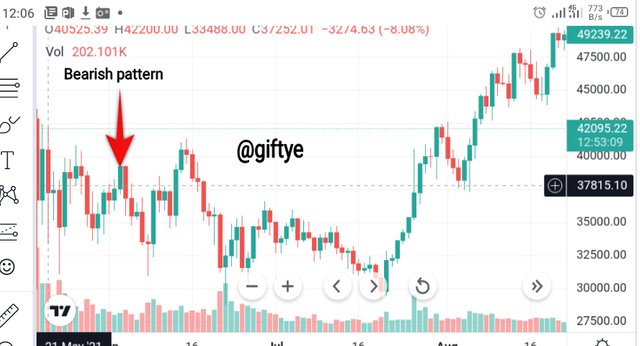
This pattern tends to give a signal of futuristic low in price. This pattern is made up of an up (hollow or green) candlestick closely followed by a larger down (red or black) candlestick that engulfs the smaller green candlesick. This is the opposite of the bullish candlestick pattern. This pattern indicates that buyers are have been overtaken by sellers and they are pushing the price down with a greater force than that of the buyers ,who try to push it up.
KEY POINTS
- This pattern is a lot less important in a choppy market.
- The occurrence of this pattern becomes significant after an advancement in price.
- Two small candles can succeed in creating an engulfing pattern,but significance is found when both candles are large.
- The real body is the difference between the closing and opening prices of the candlestick,and that's wat matters. The up candle must be engulfed by the down candle's real body.
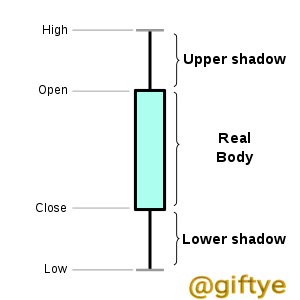
A complete candlesick is made up of the candlesticks (which is characterised by a rectangle) and the candlewicks (which are vertical lines found above and below the candle). The candlesticks show the precise time lag. The time lag can be a whole day's trading or a minute's trading for a trader:s buying and selling of financial functions in the process of a trade session. Where as,the length of the candle wicks presents the low and high prices for the covered time lag.
Another name for the wick is shadow and they are vital in showing potential reversal and also rejection signs. A wick gives a road map to take profits and also assists greatly in locating a good stop loss. A candlestick describes the prices (highest and lowest) that have been traded in a time interval by a security. The wide part of the candlestick is called "real body".
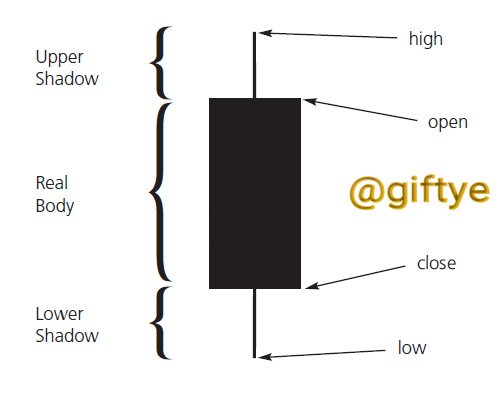
- UPPER SHADOW: Also known as the "upper wick" . This is the difference between the real body's top and the day's high.
- LOWER SHADOW: Also known as the "lower wick". This is the difference between the real body's bottom and the day's low.
- REAL BODY: The real body is that fat rectangular aspect of the chart as discussed and shown above . It shows the precise action of price in relation to the opening price and closing price .
- OPEN: This shows the initial price movement. It is usually recorded at the exact time price movement commences.
- CLOSE: This shows the last price that has been recorded in a candle.
- HIGH: This indicates the highest price recorded at a point in time.
- LOW: This aspect of the candle indicates the lowest price recorded at a point in time.
CONCLUSION
Candles are what relates the mind of the market to us . When we encounter a bullish candle,it simply tells us that the market is being dominated by buyers,but when the market is bearish then sellers are dominant. A candle can also take a neutral form ,which tells us that neither sellers nor buyers are dominating the market.
Candlestick patterns are a well calculated and effective approach implemented by traders around the world. The candlestick charts are used in the forex and derivative markets,among others.
cc: @reminiscence01
cc: @nane15
cc: @dilchamo
cc: @sapwood
Sort: Trending
Loading...