Crypto Trading with Moving Average -Steemit Crypto Academy | S6W2 | Homework Post for @shemul21

• Explain Your Understanding of Moving Average.
• What Are The Different Types of Moving Average? Differentiate Between Them.
• Identify Entry and Exit Points Using Moving Average. (Demonstrate with Screenshots)
• What do you understand by Crossover? Explain in Your Own Words.
• Explain The Limitations of Moving Average.
• Conclusion.

Introduction

Cryptocurrency analysis comprises the use of some mathematical tools and indicators that use the price history of an asset t predict the trend of the future. And this works because, the crypto market tends to behave in some particular pattern and if that happens, those trends tend to continue in that direction for some time.
There is no one or all-inclusive way to technically analyze cryptocurrencies. Every trader has his own preferred indicator or indicators he might use together. These indicators if they are of the same purpose are likely to give slightly different results. It should be noted that there is no technical analysis tool or indicator that is perfect for predicting the trends.
Some indicators used in technical analysis are;
• Relative strength index
• Average directional index
• Moving averages
• Support and resistance levels
• Etc.
All these have their purpose in technical analysis. however, in this post, we are going to be talking about Moving Averages. Let’s get started.

Question 1
Explain Your Understanding of Moving Average
Answer

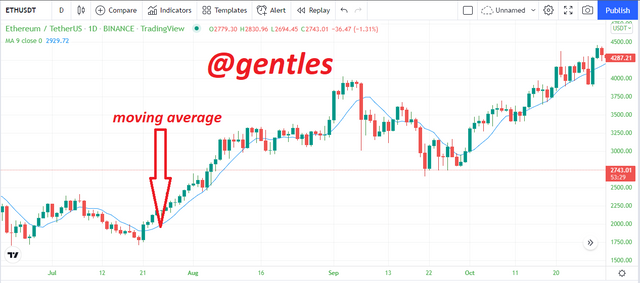
Moving averages is one of the various forms of technical indicators which can be used to aid in predicting the direction of a trend. Moving averages compile data points of an asset over a particular period and take a mean value or average by dividing the total by the data point accumulated. For instance, a 20MA is reached by dividing 40 total points by 20 data points. Due to how the number is taken in real-time by keeping it updated with the most current price information, it was given the name moving average.
The use of this indicator produces a steady and reliable price movement analysis, it also helps to remove price data that might prevent the trader to get the correct perspective on the underlying or actual trend which is an essential measure to yield profits from the crypto market. The decrease in the noise will help the traders to actually see the underlying price.
It should be noted that the moving average unlike some indicators does not predict the future price of the asset, they only show how the asset is coping at the moment. However, they can be used together with other indicators to predict the future price and also find the best market entry and exit points. To add a moving average to charts, the time frames can be adjusted to be either a high or low timeframe. They help the trader to have a clear view of the price action. Each type of moving average has the formula to aid in its calculation.

How to add moving average to a chart
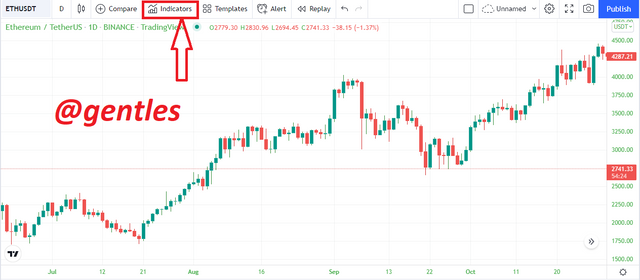
To add a moving average to a chart, click on indicators at the top menu of the chart
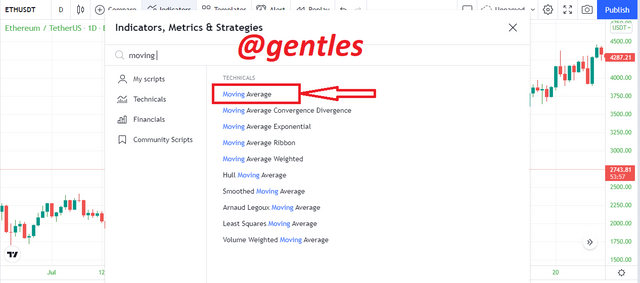
When the indicators dialog box opens, type in moving average or enter any of the types of moving averages to show
Click on it and it will be added immediately
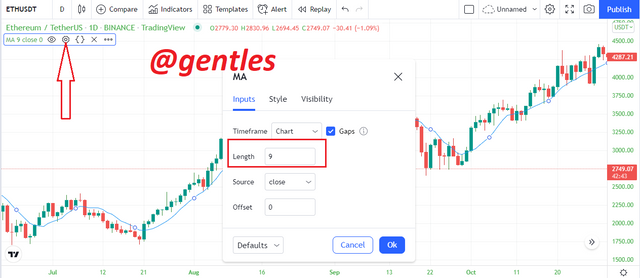
The MA can be configured to a preferred style and length depending on the trader
To do that just click on the configure button on the MA menu to open its settings. enter your preferred length, source and others
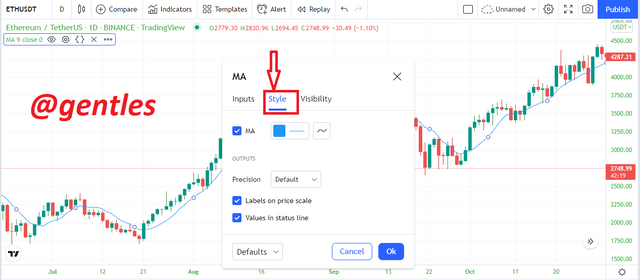
To change the colour and feel of the MA click on Style and configure to your preferred style

Question 2
What Are The Different Types Of Moving Average? Differentiate Between Them
Answer

There are different types of moving averages that we will be talking about in these coming paragraphs. Some of them are;
• Simple Moving Average
• Exponential Moving Average
• Weighted Moving Average

Simple Moving Average (SMA)
As its name suggests, it is the simplest to calculate. Here all the data in the period are considered to be of the same weight irrespective of their positions. The simple moving average uses the closing prices within a specified period to determine the MA. To calculate the simple moving average of a chart for let’s say 16period, 16 candles with their closing prices are summed up and divided by 16 to give the 16 period SMA value.
It is the simplest MA to calculate and also the slowest to reach price changes
For instance, using the ETH/USDT chart above to calculate the 16 period SMA of the selected region, we sum up their closing prices which will give us
3049.1 + 3095.33 + 3122.1+ 3124.53 + 3182.93 + 3185.36 + 3151.3 + 3151.3 + 3139.13 + 3170.76 + 3168.33 + 3122.13 + 3112.37 + 3066.14 + 2990.71 = 49943.89
Then we divide the total figure by the number of periods (49943.89 / 16) = 3121.49 and this will be the 16 period SMA. The SMA is also powerful like the long-term MA

Exponential Moving Average (EMA)
The exponential moving average offers greater weight to the immediate prices. It is a very reliable short-term indicator. This type adds an additional value to the specified period. for instance, when we take a 15 period EMA, it actually considers the immediate past period making 16
To deduce the EMA, a multiplier is used which gives a very smooth outcome.
Here is how to calculate the multiplier;
[2 / (number of periods + 1)]
For instance, if we have a 1hr timeframe and wants to calculate a 6 period EMA, the multiplier will be [2 / (6 + 1)] = 0.29
We now get to the EMA whose formula is = closing price x multiplier + EMA (previous day) x (1-Multiplier)
Assuming the previous EMA for the previous day was 70 then the EMAs will be;
1 EMA = 70(1) = 70
2 EMA = 0.29 x 45 + (1-0.29) x 70 = 62.75
3 EMA = 0.29 x 50 + (1 – 0.29) x 62.75 = 59.05
4 EMA = 0.29 x 55 + (1-0.29) x 59.05 = 57.88 will be the 3EMA

Weighted Moving Average
In this moving average, the periods are not treated equally. Each one of the periods is given its own weight. Most previous periods are given more importance compared to the old ones. In its formula, a coefficient is applied that multiplies each of the prices and increases as we approach the most recent price. Let’s say if the coefficient is x, then it increases as we get to the most recent price (x, x+1, x+2, x+3). This gives more importance to the recent prices than the old ones.
This is done because it is believed that the current prices have greater importance in telling the future price. Due to this, it has a faster reaction to price movement compared to the SMA line.
How to calculate WMA
For instance, if we are to calculate the WMA of some 4 periods with prices arranged in order of time, $25, $30, $50, $55. Then it will be done this way.
E [(1 * $25) + (2 * $30) + (3 * 50) + (4 * $55)] = 455
Then we add the periods which will give 1+2+3+4 = 10
We finally divide the weighted periods by the total number of periods
455/10 = 45.5 and this will be the WMA.

| Simple Moving Average | Weighted Moving Average | Exponential Moving Average |
|---|---|---|
| The closing prices of the periods are used to calculate it | it uses the last period in its calculation | it is calculated using the most recent periods |
| It is a good long-term indicator | it is a good intermediate-term indicator | it is a good short-term indicator |
| It is very slow in tracking price movement | it is intermediate when compared to the SMA and EMA | it has a very high speed |
| All periods are weighted equally | the weight of the periods is increased as it approaches the most recent data | the additional period is given more weight but the rest are of the same weight |
here is what they look like on a chart

Question 3
Identify Entry and Exit Points Using Moving Average. (Demonstrate with Screenshots)
Answer

When using moving averages to predict price directions, we can use two MAs, a long-term one and a short-term one. A bullish trend is usually anticipated when the short-term MA rises and crosses the line of the long-term MA. It is also called the Golden Cross. When this happens, it gives a strong buy signal.
When the short MA crosses the long MA from above, it also signals an upcoming bearish trend

Buy Order
In the chart above, I used a 100 MA and a 20 EMA line. As explained earlier, when a short MA line crosses the long MA line from below, a bullish trend is to be anticipated and that is when you should enter the market. It can be seen that the short MA colored orange crossed the long MA and a bullish trend followed.
We exit the market if the short MA crosses from above.

Sell Order
It can be seen that the short MA is crossing the long MA from above which is a good point to enter a sell order. After some time, the long MA line is seen to be crossed by the short MA line from below. This is an exit point for a sell order.

Question 4
What Do You Understand By Crossover? Explain In Your Own Words
Answer

A moving average crossover is when two MA lines intersect or bisect each other on a price chart. When they happen, they signal trend exhaustion and a possible trend reversal in the price movement of the asset. it can easily be seen when long-term and short-term MA lines are used together.
For instance, we can use a 20 EMA line as a short-term MA line with a 100 MA line as a long-term MA line in a chart and see a crossover.

Implications Of a crossover
The implications have been explained already but I will hit on them again.
When the short-term (fast) MA rises and crosses the long-term (slow) MA from below, it signals an upcoming uptrend. This will can be an entry to a long or buy trade or exit to a short or sell trade. This type of cross is called a Golden Cross
When the short-term (fast) MA falls and crosses the long-term (slow) MA from above, it signals an upcoming downtrend. This will can be an entry to a short or sell trade or exit to a buy or long trade. This type of cross is called a Death Cross

Question 5
Explain The Limitations Of Moving Average
Answer

Moving averages have their limitations just like every other indicator in the crypto market we know. We will be talking about them below.
• If the moving average is not used properly, it can mislead inexperienced traders to make wrong trade moves.
• The moving average does not take into account other factors other than the periods in the price chart. Some of the other factors could be external financial and economic events.
• This indicator gives results based on the present but uses a lot of old data that may not be necessary.
• Specific ways on how to use the moving averages are not given which gives beginners a hard time in using the indicator. Traders usually have to learn and gain experience in their own way.
• Alterations may occur with the average value and the value that has been predicted when new data is added to the chart.
• Moving averages are not perfectly accurate. They may need to be used together with other indicators to increase their accuracy.

Conclusion

Moving averages are one of the simplest indicators to use. They aid traders to identify entry and exit points during a trade. There are various forms of moving averages, we have the simple, exponential, and weighted moving averages.
They have their differences which I explained earlier, no one of them is better than the other. Each of them can be set to give very good accurate results. It will be best to try them with different periods and timeframes to see which one of them suits your style or trade.
MAs can also be used with other indicators like the Relative Strength Index (RSI) to give more accurate results.
Thanks to Prof.@shemul21 for this task.
