Bichi Indicative Strategy- Steemit Crypto Academy- S5W6-Homework post for @utsavsaxena11

Question 1
Give a detailed analysis of BICHI STRATEGY. Starting from introduction, identification of trends, trend reversal in market, entry, and exit from the market, one demo trade, and finally your opinion about this strategy.
Answer
Introduction
What is BICHI strategy
BICHI is a coining of two strategies, the Bollinger Bands and Ichimoku Cloud the combination of these two to a chart yields about 80-90% success rate.
What is Ichimoku Cloud
The Ichimoku cloud is a combination of technical indicators that depicts momentum, price movement, resistance and support levels. To make this possible, it uses multiple averages at the same time and places them on the chart. The averages are used to compute a form of “cloud” that tries to predict the support and resistance prices in the time to come.
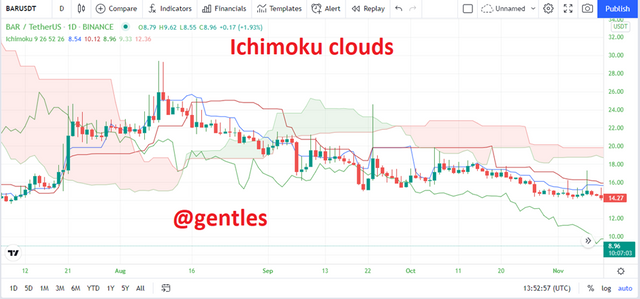
The Ichimoku cloud is made up of five different lines, the difference between the two of them get shaded to form a cloud. The lines comprise a fifty-two-period average, a 9-period average, a twenty-six-period average, an average of the nine and twenty-six averages, and a line the represents the closing price.
The cloud the lines forms are used to determine the price direction and the strength of the signal. When the price falls beneath the cloud, a downtrend is signaled and when it rises above the cloud an uptrend is signaled.
To determine the strength of the signal, see if the price is moving in the same direction as the price. In the case of an uptrend, the top part of the cloud heads upwards so the price should also move upwards in the same direction to tell that it is a strong signal, also, during a downtrend, the bottom of the cloud heads downwards so the price should also move downwards to tell a strong signal.
The purpose of the Ichimoku clouds in this strategy is to make use of the lagging span to determine the start and end of a trend and also when there is a price reversal.

What is Bollinger Band
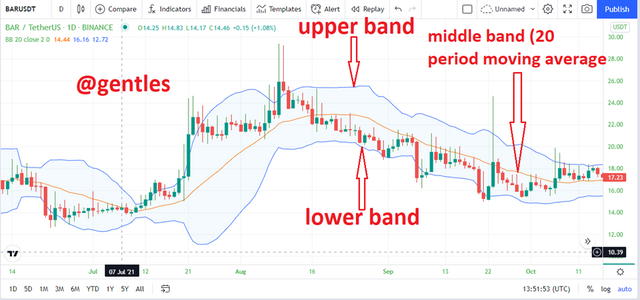
The Bollinger is a volatility indicator that comprises 3 different lines. The line that falls in the middle is a 20-period moving average with upper and lower bands. It expands based on how volatile the asset is. The price of an asset is considered overbought when it gets closer to the upper band and oversold when the price approaches the lower band.
In this strategy, the Bollinger bands serve as support and resistance for the price and are used to determine an upcoming trend reversal.
How to identify trends using the BICHI strategy
As said earlier, the BICHI strategy makes use of both the Ichimoku clouds and the Bollinger bands. To determine trends with this strategy, we have to consider the positions of both two strategies.
We will first find out if the price is above or beneath the baseline and also see if it goes beyond the clouds or below them. We can then have a conclusion of our market strategy
Let’s see how to identify the bullish and bearish trends with this strategy.
Bullish
A Bullish trend is when the price of an asset is ascending or rising, it is also known as an uptrend.
When the price movement is above the baseline, uses it as a support level, and also moves above the cloud, it signals an upcoming bullish trend or an uptrend. However, the Ichimoku clouds should cross the price action fully and move downwards to confirm the bullish trend. This strategy needs a lot of patience and after the upcoming price movement is confirmed, we can now place a long on the coin and a stoploss on the previous low to limit our loss.
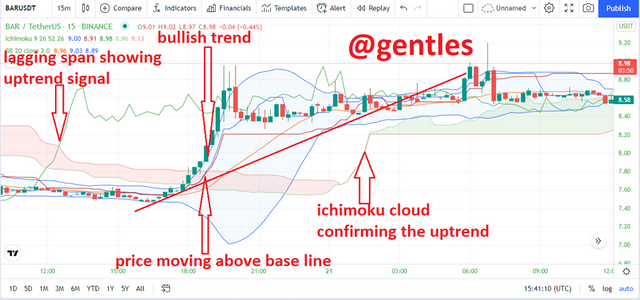
Looking at the chart above, it can be seen that the Ichimoku lagging span initially gave a signal on the upcoming bullish trend. However, we need to have patience for the price to go beyond the baseline and the cloud to confirm the trend. We can then place our buy orders for profits.
Bearish
A bearish trend is when the price of an asset is declining, it is also known as a downtrend.
When the price movement is below the baseline, uses it as a resistance level, and also moves below the cloud, it signals an upcoming bearish trend or an uptrend. However, the Ichimoku clouds should cross the price action fully and move upwards to confirm the bearish trend. This strategy needs a lot of patience and after the upcoming price movement is confirmed, we can now place a short on the coin and a stoploss on the previous high to limit our loss.
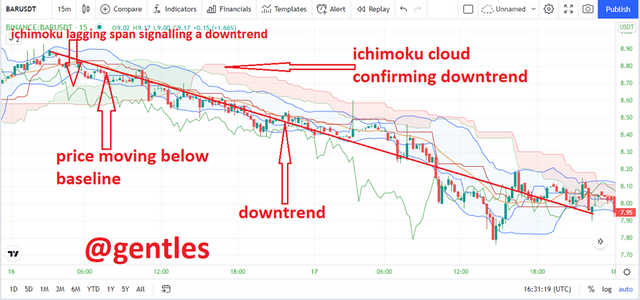
Looking at the chart above, it can be seen that the Ichimoku lagging span initially gave a signal on the upcoming bearish trend. However, we need to have patience for the price to go below the baseline and the cloud to confirm the trend. We can then place our buy-sell for profits or to stop our loss.
Trend reversals
downtrend to uptrend
When the price of a coin takes a certain direction, either upwards or downwards, and later changes its direction, it is known as a Trend reversal. We are going to have a look in either direction.
The Bollinger bands and the price actions are the factors used to identify price reversals.
When the price crosses below and above the baseline multiple times as in a sideway market. at this instance, it will be a good decision to await confirmation and not trade as the price may move in any direction.
When the price breaks the baseline and the cloud and moves upwards, it depicts a trend reversal from a downtrend to an uptrend
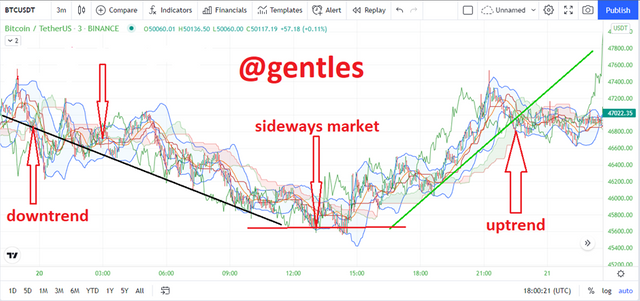
In the chart above, we can see the downward trend which later experienced a sideways market. We can also see that later, the price started to rise and it rose above both the baseline and the cloud. This showed an uptrend is starting and the downtrend has ended.
Wed can then place out buy orders for profits
Uptrend to Downtrend
When the price crosses above and below the baseline multiple times as in a sideways market
When the price breaks the baseline and the cloud and moves downwards, it depicts a trend reversal from an uptrend to a downtrend
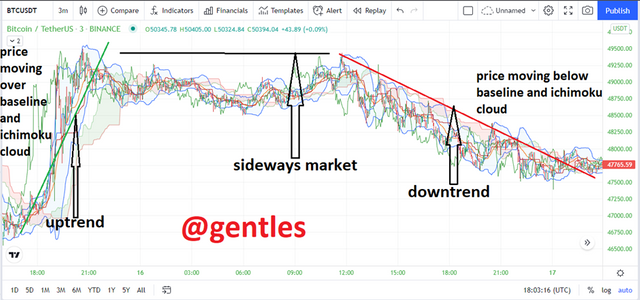
In the chart above, we can see the upwards trend which later experienced a sideways market. We can also see that later, the price started to fall and it fell below both the baseline and the cloud. This showed a downtrend is starting and the uptrend has ended.
Using the BICHI strategy to Enter or Exit a Market
Entry Point
To get a good entry point in the market, we need to find out the movement of the market. If the price is moving above the support baseline, it depicts an uptrend. However, it is not best to enter at this point we have to have patience and await a confirmation signal from the Ichimoku cloud.
After the trend has been confirmed by the Ichimoku cloud, we can then place our orders.
To buy, the cloud must confirm an uptrend by being above the baseline and the Ichimoku cloud. If the uptrend is confirmed we can place our long orders and add our trade conditions like Take profit and stop loss.
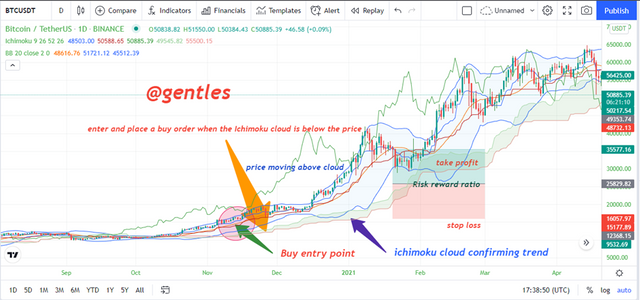
In the chart above, I had trend confirmation from the Bollinger bands and the Ichimoku cloud then I placed a buy order with a risk-reward ratio of 1:1.
Exit point
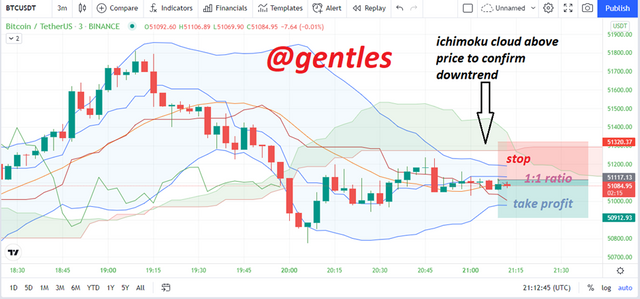
To sell or exit, the cloud must confirm a downtrend by being below the resistance baseline and the Ichimoku cloud. It is important to wait for the Ichimoku cloud to confirm the trend. If the downtrend is confirmed we can then place our short orders and add our trade conditions such as take profit and stop loss.
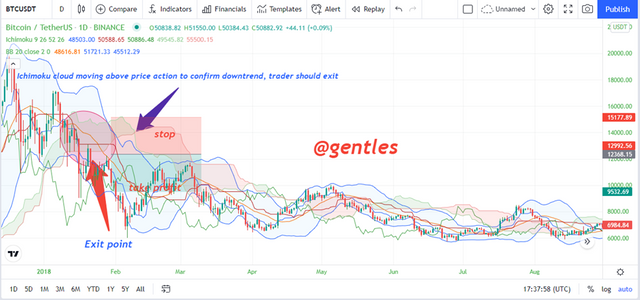
In the chart above, I had a downtrend confirmation from the Bollinger bands and the Ichimoku cloud then I placed a buy order with a risk-reward ratio of 1:1.
Demo Trade
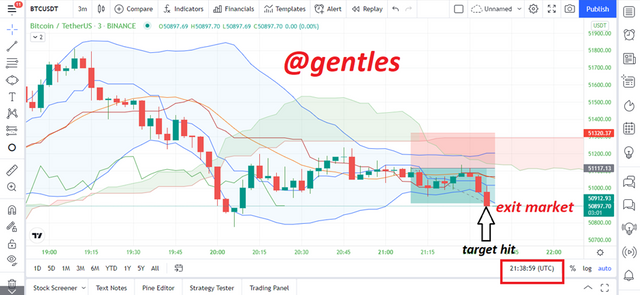
I noticed a downward trend earlier in the chart but I waited for confirmation from the Ichimoku cloud. And as seen from the chart, the Ichimoku cloud formed beneath the price, and a downtrend was confirmed. I then placed a sell order when the price was 51084.95USD. I then placed a stop loss at 51320.37USD and a take profit at 50912.93USD and waited for some time.
About 26mins later, the price dropped to $50897.70 going beyond my target of 50912.93USD. Since I hit my target, I exit the market with a profit of 50897.7 – 50912.93 = 187.95USD
What I think about the BICHI strategy
The following are my opinions on this strategy
• The BICHI strategy is able to produce fast results for instantaneous trades to give immediate profits, however, I can also be very risky
• The success rate of this strategy is more than 85%, this implies the strategy has a good success rate
• Due to its short time frame ability, it will be very good for intraday traders
• To successfully use this strategy, you need to have a lot of patience and should also be able to observe well
• It works best in a 1-30mins time frame
• It contains so many lines in the chart which might make it look complex to beginners
• The BICHI combines two strategies the BB and Ichimoku, which makes it good at identifying false signals. A single indicator would have produced a lot of false signals
• If the Bollinger bands and the Ichimoku cloud are well understood, the BICHI strategy gets easier to use.
Question 2
Define briefly Crypto IDX and Altcoins IDX. What is signal prediction trading? Is it legal or ill-legal in your country? (Explain briefly)
Answer
Define briefly Crypto IDX
Crypto IDX is a short form of cryptocurrency index and it is a synthetic asset that tracks the average prices of some four cryptocurrencies. The cryptocurrencies are;
• Ethereum
• Zcash
• Bitcoin
• Litecoin
In cryptocurrency, synthetic asset is a combination of different assets that have equal value as another asset. This allows the trader to experience a divergence of crypto assets without having to possess the underlying asset. In a nutshell, they “mirror” the behaviour of those assets and allow users to purchase those assets instead, and they will be of the same value as the combined assets. The trader utilizes the advantages of the components of the combined assets rather than a single asset.
When the trader uses this synthetic coin, he gets to hold and follow the value of some assets without being required to go out of the crypto world.
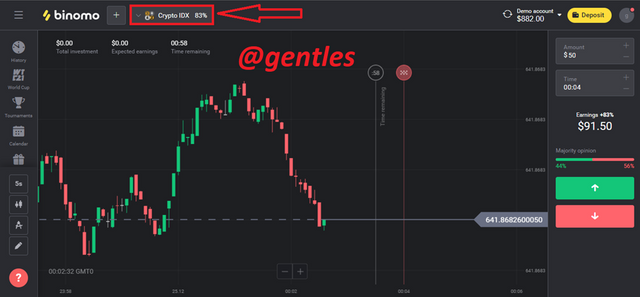
The crypto IDX is an example of a synthetic asset, this asset is only traded at all times on the Binomo trading platform. The synthetic asset also factors in the demands and supply of the combined coins.
What are Altcoins IDX
There are two forms of cryptocurrencies, we have Bitcoin and Altcoin. Altcoins are alternative coins developed from Bitcoin. Just like the crypto IDX combines some cryptocurrencies, the Altcoin IDX combines some altcoins and tracks their average value. The altcoins are;
• Litecoin
• Ripple
• Monero
• Ethereum
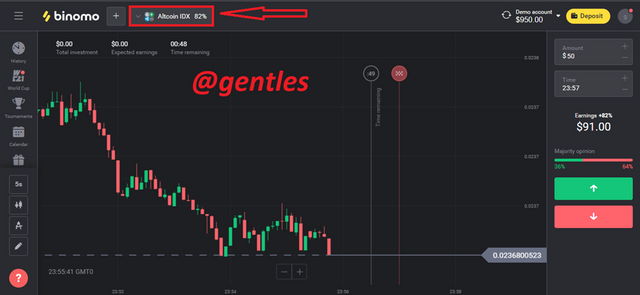
The altcoin IDX is also traded at all times on the Binomo platform. This IDX do not only make use of the average prices of the coins, it also factors in the demand and supply of the coins to ensure liquidity for the asset.
Signal Prediction trading
Signal Prediction trading is the method of trading where the trader places funds in an account and uses it to predict whether the price of the asset will move down or up in a given span of time. It is totally different from spot trading. It would not be a good idea for beginners to do signal prediction trading, it can be very risky, this method is for experienced traders who have been in the system for long.
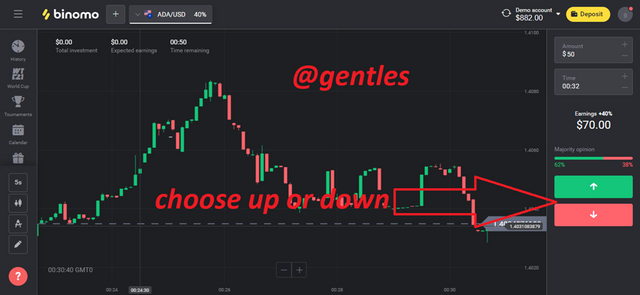
Set an amount and a timeframe, then select your predicted direction. If the asset goes in that direction within the time frame, you gain profit, if it goes contrary to your direction you lose your placed funds.
Its legality in my country (Ghana)
Signal prediction is legal in my country. I think that is why the Binomo platform is able to operate successfully in Ghana.
Binomo platform is accessible in about 130 countries and had more than 890k+ users. The Binomo platform was established in 2014 and it has expanded its markets to many parts of Africa including Ghana.
When it came to Africa, it had its Brand ambassador as Victor Moses who is a Nigerian and a Chelsea football player.


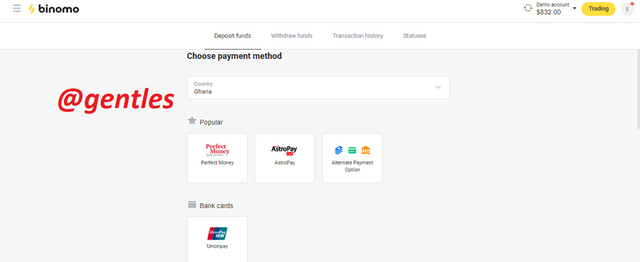
Because of its branch in Ghana, it allows users to deposit Ghana cedis through some notable money transfer platforms in the country.
There is even a Facebook platform where users can go and interact with other users, share ideas and get support from the platform itself.
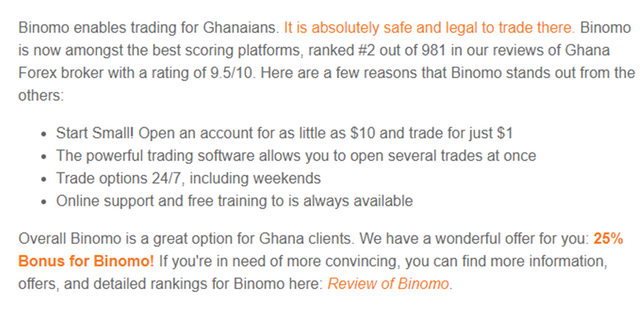
forex agent reviews is a forex rating platform and it has rated Binomo second (2nd) out of the 891 forex brokers in Ghana and it has stated that it is very safe and legal to trade there from Ghana.
The platform has won many awards and among them is the Broker of the Year by the IAIR in 2016. Seeing that the Binomo platform is a leader in signal prediction trading in Ghana and it is widely endorsed throughout the country, it will be safe to state that Signal prediction trading is legal in Ghana.
Question 3
If you want to create your own penny IDX, then which 4 penny assets will you choose, and what is the reason behind choosing those four assets. Define Penny currencies. (Explain, no screenshot required).
Answer
What are penny cryptocurrencies
Penny cryptocurrencies are crypto coins that have a value of approximately less or equal to $1. They are not that different from other cryptos, their value is the only difference. They are very cheap coins and are only worth a few pennies.
Due to their small nature, they have very good growth potential and can yield great profits. They can be purchased easily so traders can buy a lot of them to diversify their portfolio.
Making my own IDX
From a notable website The CryptoStaunch, a good penny crypto should meet the following criteria:
• The penny cryptocurrency should have over $20million of market capitalization and also have liquidity of at least $1million daily trading volume.
• The penny cryptocurrency should be listed on some of the popular currency exchanges.
• The coin should have a good liquidity
• It should have a minimum of about 10M as circulating supply
• It should be active on social media with news of its development
After a careful look at some penny cryptocurrencies, I chose four of them, they are; stellar (XLM), Ripple (XRP), VeChain (VET), Tron (TRX).
Why I chose these penny cryptocurrencies
Stellar
I chose Stellar (XLM) because it fits all the above criteria.
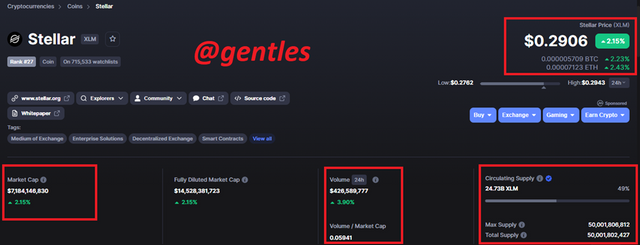
screenshot from coinmarketcap
It can be seen from the screenshot above that Stellar has a current price of $0.2906 which is under $1 and therefore qualifies to be a penny cryptocurrency.
It is ranked 27th on coinmarketcap. Stellar has a total supply of 50,001,806,812XLM of which 24.73B is circulating which is more than the required supply limit of 10million coins
The market capitalization of stellar is currently at $7,184,146,830 which is also higher than the required $20million in market capitalization and also has a trading volume (24hours) of $426,589,777 also more than the 1M daily trading volume requirement
It has a goal to be a transparent financial system where everyone can experience a highly affordable high-speed transaction.
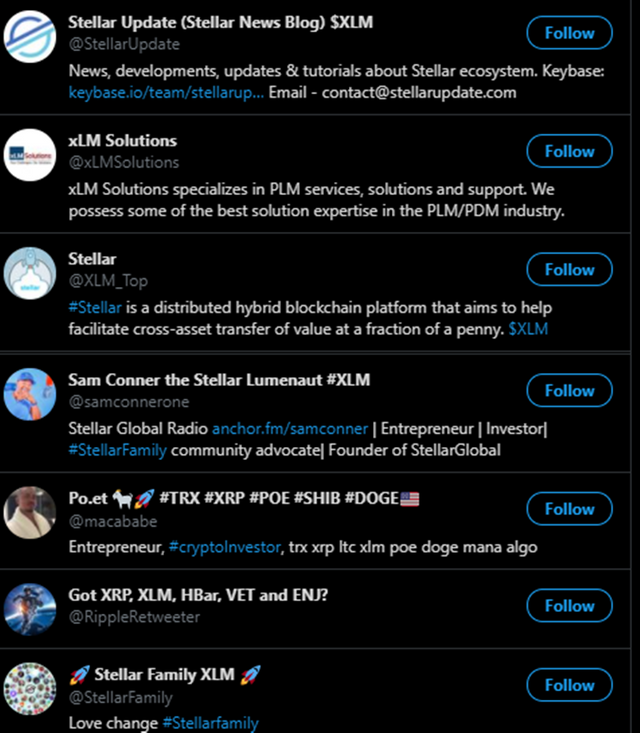
Stellar is present and very active on Twitter and other popular social media platforms.
It has a goal to be a transparent financial system where everyone can experience a highly affordable high-speed transaction.
Stellar (XLM) meets all the requirements for a good penny cryptocurrency that is why is chose it as part of my IDX
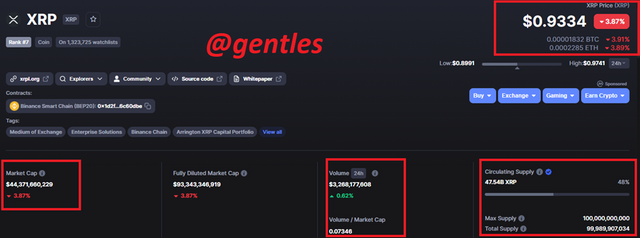
My second coin is Ripple (XRP)
Ripple was launched by Jed McCaleb and Ryan Fugger in 2012. It is very popular with its very fast transaction speed of about 1500TPS
 screenshot from coinmarketcap
Ripple (XRP) is ranked 7th on coinmarketcap with a current price of $0.9334 and $44,371,660,229 market capitalization.
The coin has a circulating supply of 47.54B and a daily trading volume of $3,268,177,608. This shows the coin has good liquidity.
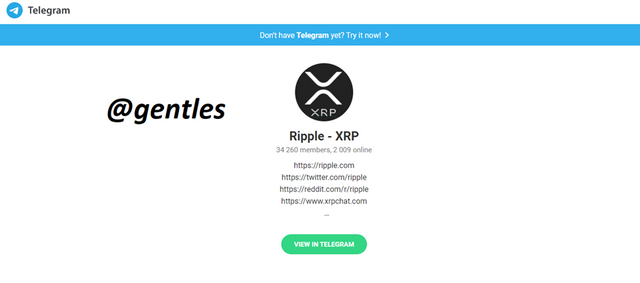
Ripple is active on telegram with over 34,000 members. There is also a list of other active social media pages of the Ripple coin.
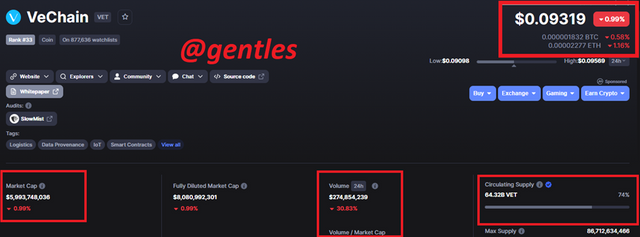
My third coin is VeChain (VET)
This coin is a token on the Vechain blockchain network. Its purpose is to help find solutions to some hurdles or problems in the finance ecosystem. The issues it aims to solve are those of supply chain management.
 screenshot from coinmarketcap
The coin meets all the criteria with a price of $0.09319, a market cap of $5,993,748,036, a 24hr trading volume of $274,854,239, and a circulating supply of 64.32VET.
It also has an active twitter platform
 source
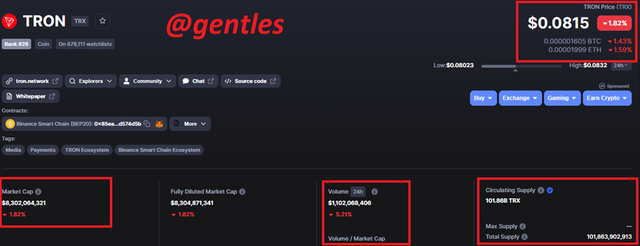
The fourth coin I will add is Tron
This coin was created with the purpose of directly connecting content creators with their fans and buyers. It does away with centralized platforms that act as intermediaries and charge extra as commission from content creators and their audience.
 screenshot from coinmarketcap
When it comes to the metrics, it fits all the criteria for a good penny cryptocurrency. It has a price of $0.0815, a market cap of $8,302,064,321. It has a 24hr trading volume of $1,102,068,406 and a circulating supply of 101.86B TRX.
Conclusion
We started this post with the BICHI strategy. I explained that it is the combination of two indicators, Ichimoku cloud, and Bollinger bands. As I mentioned earlier, this strategy has a very good success rate of about 80%.
Then I continued the post by explaining how to identify some trends like the downtrend, uptrend, trend reversals, etc. I demonstrated how to use the Strategy to make some trades.
Finally, I wrote about Crypto IDX which I said is an asset that uses or tracks the average value of some four cryptocurrencies and is available on the Binomo platform and Altcoin IDX which also tracks the average value of some four altcoins. They are also accessible on the Binomo platform.
Much Gratitude to Prof.@utsavsaxena11 for this task.