Trading Crypto with On-Balance Volume Indicator -Crypto Academy / S5W4 - Homework Post for @fredquantum
ON-BALANCE VOLUME (OBV) INDICATOR
On-balance volume (OBV) is a technical trading momentum indicator that predicts price changes by looking at volume flow. Technical analysts use the On Balance Volume indicator (OBV) to evaluate buying and selling pressure. It is a cumulative indicator, which means that on days when the price increased, the volume from that day is added to the overall OBV. If the price falls, the volume for that day is deducted from the overall volume. For ease of interpretation, the OBV value is represented as a line. On Balance volume is generally used to validate or detect broad price trends, as well as to forecast price changes following divergences.
This indicator was created by a man named Joe Granville in the year 1963, this indicator is historic as it was one of the first indicators that gave an account of the negative volume flow and the positive volume flow.
When an asset's price closes higher than the previous close, the 24-hour volume is considered 'up-volume' according to the OBV principle. When the asset's price ends lower than its prior close, the full day's volume is called 'down-volume.' OBV, like other volume-based indicators like the money flow index, and negative volume index, will only work on markets with exchange volume.
The actual individual quantitative value of OBV, despite being represented on a price chart and quantified quantitatively, is irrelevant. traders and analysts focus on the nature of OBV movements over time, with the slope of the OBV line carrying all of the analysis weight.
ADDING THE OBV INDICATOR TO A CRYPTO CHART
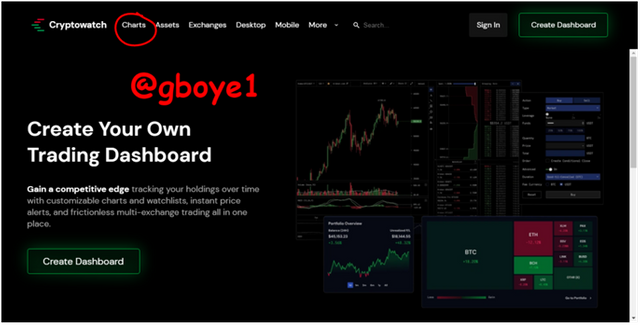
For this session I will be making use of the cryptowatch websitehttps://cryptowat.ch
1.The first is to visit the cryptowatch website (link above) then I clicked on the charts bar at the top of the system interface
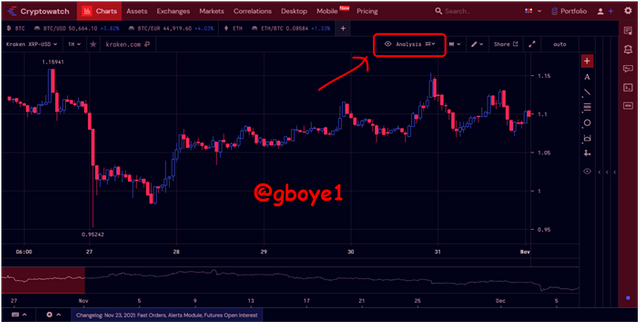
2.Following the above I was brought to the chart section, then I clicked on the analysis bar also at the top of the screen interface
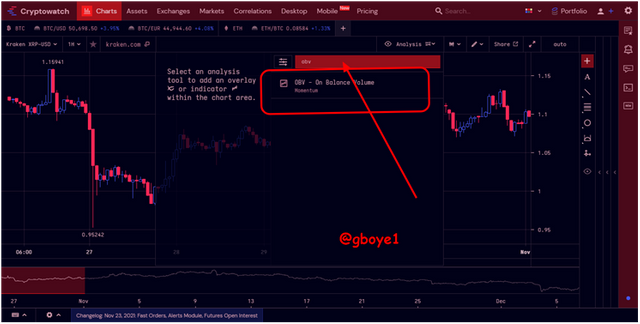
3.Then a pop up bar will be displayed, here I input the indicator I want to add to my chart (the OBV indicator) then I select it
4.After the steps above is followed meticulously the end result is the OBV indicator added to our chart as shown in the image below
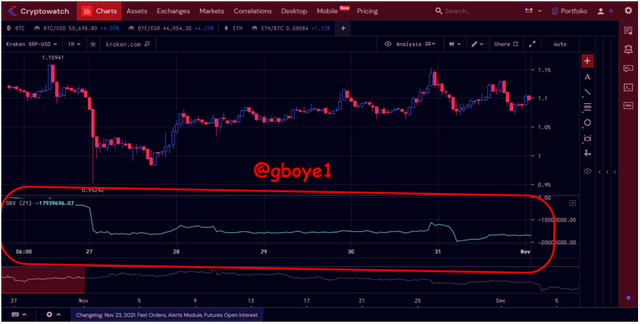
You can decide to customize the indicator to suit your taste by double tapping on the name of the indicator just above the indicators chart.
THE FORMULA USED IN CALCULATING THE OBV INDICATOR
The on-Balance volume indicator is calculated as follows;
CURRENT OBV = PREVIOUS OBV + VOLUME ------------------------ Eqn 1
CURRENT OBV = PREVIOUS OBV + 0 ---------------------------------- Eqn2
CURRENT OBV = PREVIOUS OBV - VOLUME ------------------------ Eqn 3
THE RULES FOR CALCULATING THE OBV INDICATOR
• The eqn 1 holds for when the closing price is greater than the previous closing price
• The eqn 2 holds for when the closing price is equal to the previous closing price
• The eqn 3 holds for when the closing price is less than the previous closing price
AN EXAMPLE ON HOW THE OBV INDICATOR IS CALCULATED
Below is a 5 day worth closing price and volume details to be used in calculating the OBV
| CLOSING PRICE | VOLUME |
|---|---|
| $20 | 25,200 |
| $20.15 | 30,000 |
| $20.17 | 25,600 |
| $20.17 | 32,000 |
| $20.11 | 23,000 |
Using the formula
CURRENT OBV = PREVIOUS OBV + VOLUME
CURRENT OBV = PREVIOUS OBV + 0
CURRENT OBV = PREVIOUS OBV - VOLUME
Our CURRENT OBV for each of the days arecalculated as seen below;
• Day1: CURRENT OBV = 0 + 0 (there is no previous OBV nor volume)
Therefore CURRENT OBV = 0
• Day2: CURRENT OBV = 0 + 30,000
Therefore CURRENT OBV = 30,000
• Day3: CURRENT OBV = 30,000 + 25,600 = 55,600
Therefore CURRENT OBV = 55,600
• Day4: CURRENT OBV = 55,600 + 0 = 55,600(The current price is equal to the previous price)
Therefore CURRENT OBV = 55,600
• Day5: CURRENT OBV = 55,600– 23,000 = 32,600
Therefore CURRENT OBV = 32,600
As can be seen from the calculation above, Day 2 and 3 are up days therefore I added the trading volume to the On-Balance volume indicator, Day 4 did not see a change in the Current OBV since there was no difference in the current and previous prices, while day 5 was a down day so I subtracted the trading volume from the On-Balance indicator.
TREND CONFIRMATION USING THE OBV INDICATOR
The OBV indicator plays a vital role in detecting and confirming market trends. This is useful for validating signals or setups provided by other signals that rely on being able to recognize trend to be effective. OBV can also detect probable trend reversals, based on the notion that swings in positive or negative volume flow (buying and selling pressure) precede price changes.
To confirm the trend all you need to do is to observe if the indicator line is moving in same direction as the price of the token
BULLISH TREND
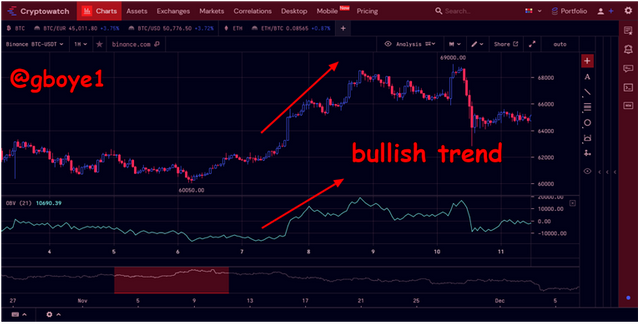
As seen in the image above, the price of BTCUSDT and the OBV indicator were moving in the same uptrend direction, if the OBV increases as the token price increases then it is an uptrend situation
BEARISH TREND
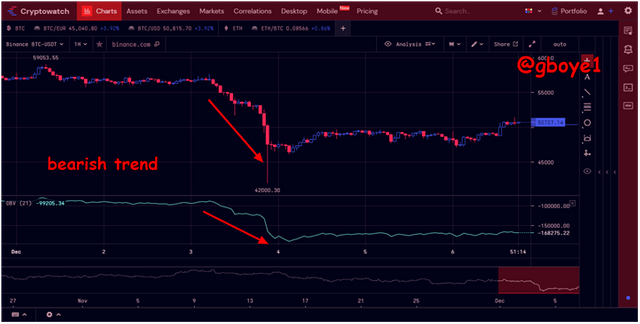
Also from the image above we can see that both the price of BTCUSDT and our OBV indicator are moving simultaneously in a downward order thus signifying a downtrend. If the OBV decreases as the token price decrease then it is a downtrend situation.
OBV BREAKOUT CONFIRMATION
When in a ranging market, a rising or falling on-balance volume indicator value can predict a future price breakout or breakdown.
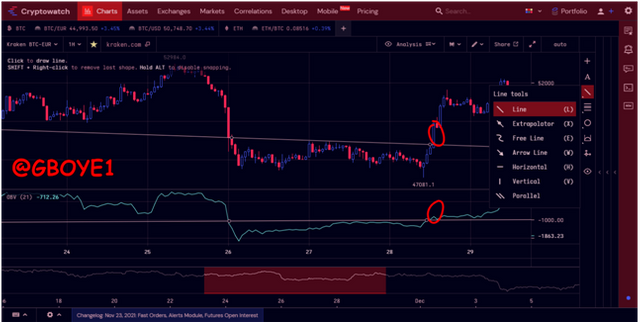
Because accumulation is taking place, a growing OBV line can signal a possible upward breakout as seen in the image above.
Because of the distribution, a declining on-balance volume line may reveal possible price breakdowns.
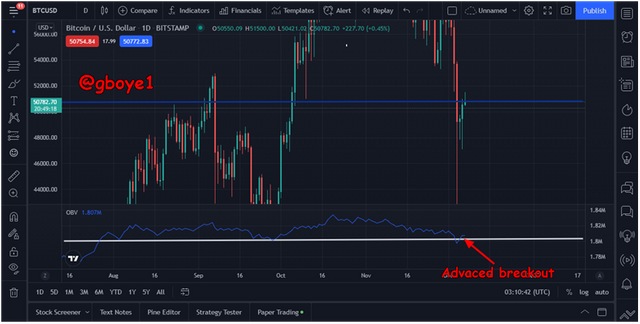
OBV ADVANCED BREAKOUT
There appears to be no problem as long as price and volume rise in lockstep. However, there will come a time when price cannot break through the previous top, but the OBV line may. An advanced breakout is what it's called.
It demonstrates that, despite a slight increase in price, volume creation is so high that OBV has advanced to a new high.
www.tradingview.com
OBV ADVANCED BREAKDOWN
Price and On Balance Volume are likely to move in lockstep during a downtrend, with lower tops and bottoms.
On Balance Volume, on the other hand, will often fail to breach the previous bottom, whereas price will. Advanced breakdown is the term for this.
Price will also break the bottom, according to the advanced breakdown.
OBV DIVERGENCE
When the indicator does not confirm price movement, divergence develops. These divergences can signal a possible reversal in several circumstances. Especially since the OBV indicator is based on the idea that price movements are preceded by volume oscillations, both positive and negative.
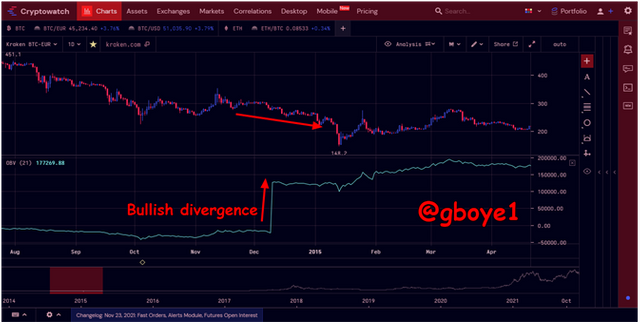
BULLISH
This takes place when there is a decrease in price but the OBV indicator produces a bullish signal
BEARISH
This takes place when there is an increase in price but the OBV indicator produces a bearish signal
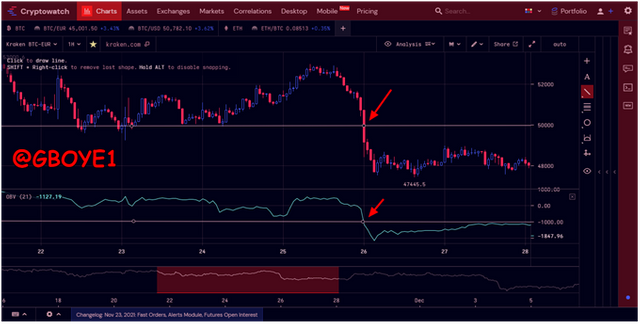
DEMO TRANSACTION
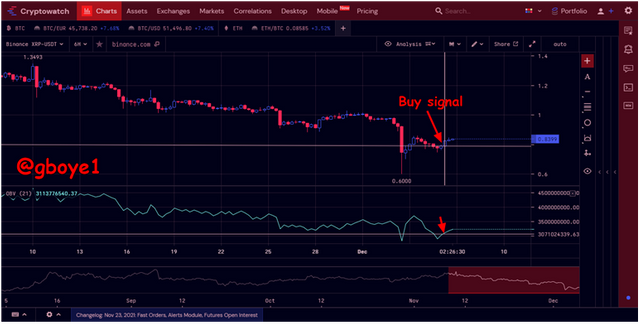
I placed my buy at that point because the OBV indicator as seen from the above image broke out, indicating a bullish signal
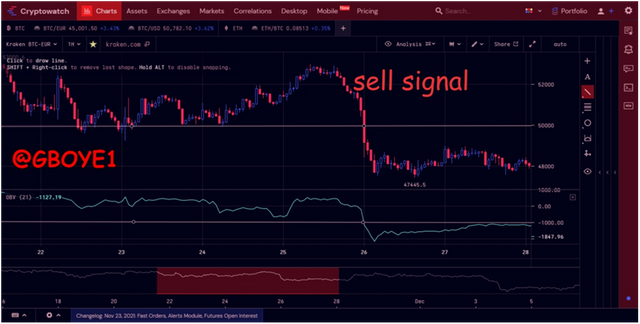
When you start noticing a downtrend, it is time to prepare for a sell
ADVANTAGES OF OBV INDICATOR
- The calculation of the OBV indicator is easy to learn and understand
- It helps the traders to confirm market trends
- When the market goes sideways, OBV might serve as a leading indicator, signaling a possible breakout or breakdown.
- OBV can be used to confirm the direction of a trend as a cumulative indicator.
- It provides a way for traders to spot divergences.
DISADVANTAGES OF OBV INDICATOR
1.OBV does not include all of the information required to analyze price activity.
2.Even if the considerable increase is not due to an increase in volume, a large surge during the trading day can cause OBV to spike.
3.When shown on a lower time frame, on-balance volume can produce deceptive trade warnings. The reason for this is that because of the higher price volatility, there is more noise in the price at shorter time periods.
CONCLUSION
Like every other indicator, it is wisdom not to use the OBV indicator as a standalone tool, this is to help in detecting false signals produced by the indicator.