Trading Crypto using Aroon Indicator - Crypto Academy / S5W2 - Homework Post for @fredquantum
AROON INDICATOR
Traders have long sought the best indicator to detect Trend momentum and future Trend directions, prompting technical analysts to offer more appetizing answers by creating better Trend indicators.
TusharChande is a technical analyst who helped develop a number of indicators, including the Qstick, Chande Momentum, and Aroon Oscillator, but today I'm going to talk about the Aroon Indicator, which is one of his most well-known developed indicators.
The Aroon indicator is a technical analysis tool that is primarily used in trend identification. It does so by reading or measuring the time between highs and lows, and by doing so, the Arron indicator detects changes in trend directional movement as well as confirms the momentum or strength of a particular trend.
This indicator is extremely useful for traders who trade market trends because it can detect changes in trend directional movement using two lines called the Aroon-up and Aroon-down.
AROON-UP
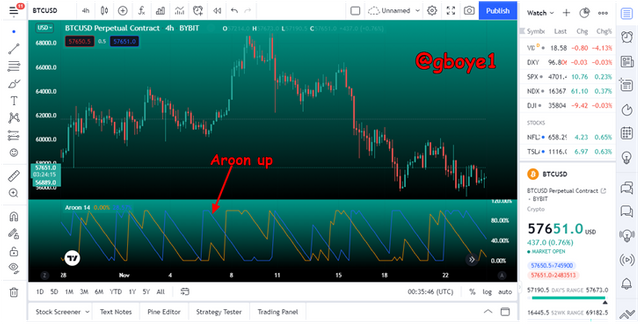
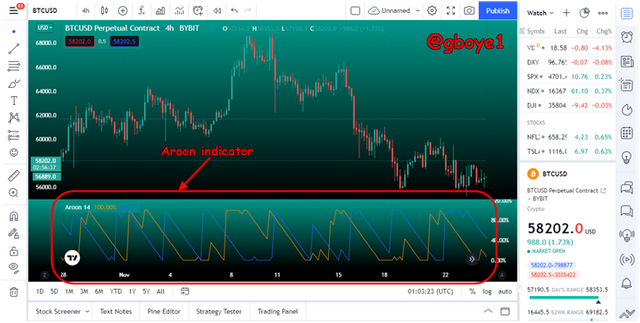
The Aroon up indicates a positive move when price makes a new high within a given period. The Aroon has a range of values from 0 to 100. When the Aroon market reaches its highest price in a given period, it advances to 100. The Aroon-up line, which travels from 0 to 100, indicates an uptrend. The aroon-up is the blue line in the Aroon oscillator in the chart below.
AROON-DOWN
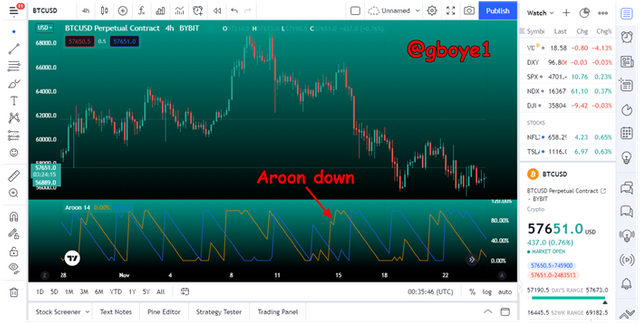
Aroon-Down is an Aroon line that indicates the strength of a downtrend by recording new lows over time. When a downtrend starts, the Aroon-Down begins to rise from zero to one hundred, overlapping the Aroon-Up. The Aroon-Down line in the screenshot below is the Orange Aroon line.
HOW IS THE AROON INDICATOR CALCULATED?
The Aroon indicator, like all other indicators, is calculated using a mathematical formula. The formula for calculating the Aroon indicator is listed below.
Aroon-Up = [(nPeriod – Periods Since the Highest High within nPeriod ) / nPeriod] x 100
Aroon-Down = [(nPeriod – Periods Since the Lowest Low for nPeriod ) / nPeriod] x 100
Where nperiod = The default period or the period was chosen for the analysis, eg 14 or 25
Where nperiod is the default period or the period chosen for the analysis, for example, period 14 or 25.
EXAMPLE
•If the Aroon-Up period is 14 and the time since the highest high during nperiod is 8, then the period since the highest high within nperiod is 6.
Therefore Aroon-up = ((14 - 6)/14) x 100
Aroon-Up = (8/14) x 100
Aroon-Up = 0.57 x 100
Aroon-up = 57
•Similarly, if the Aroon-Down period is 14 and the time since the lowest low within nperiod is 3, the period since the lowest low within nperiod is 2.
Therefore Aroon-Down = ((14 - 2)/14) x 100
Aroon-Down= (12/14) x 100
Aroon-Down = 0.86 x 100
Aroon-Down = 86
HOW TO SETUP THE AROON INDICATOR IN A CHART
I will be using Tradingview to add the Aroon indicator to a chart.
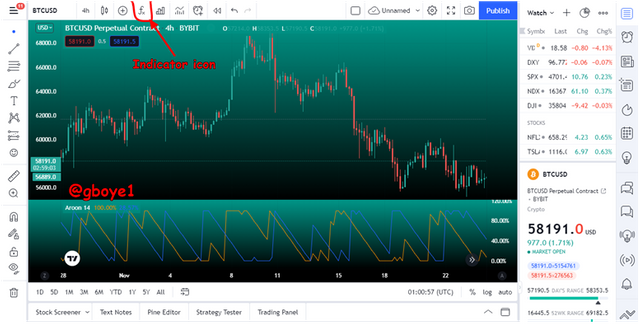
•To get started, go to https://www.tradingview.com; once the chart is opened in tradingview platform; click on the indicator icon to select the Aroon indicator
•Next, you make use of the search bar to search for the indicator (Aroon), then you click on the indicator as seen below
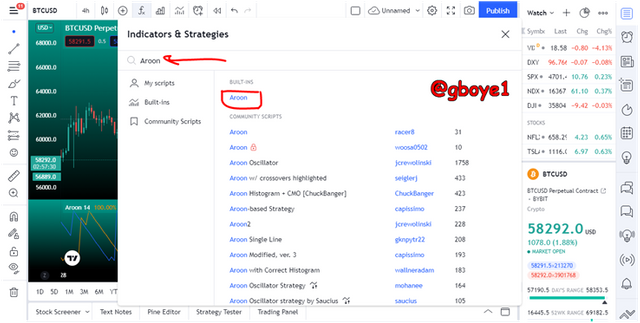
•With the above steps dully adhered to; the indicator has been added to the chart
MODIFYING THE SETTING
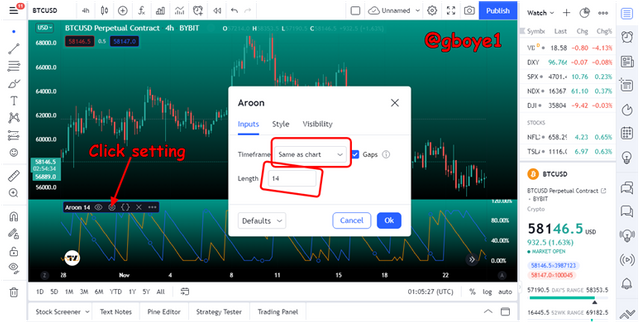
•Click on the setting icon just right next to the indicator name.
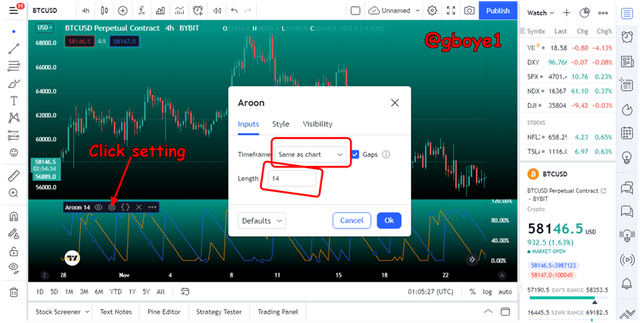
After you click it, a pop-up box will open in front of the chart with various Aroon indicator modification options, including Inputs, Style, and Visibility.
INPUTS
The inputs section provides options for choosing a timeframe and the number of periods or lengths from which a user may decide. This means that you can choose a time frame that is completely distinct from the main chain, as well as changing the period or length to fit your trading style.
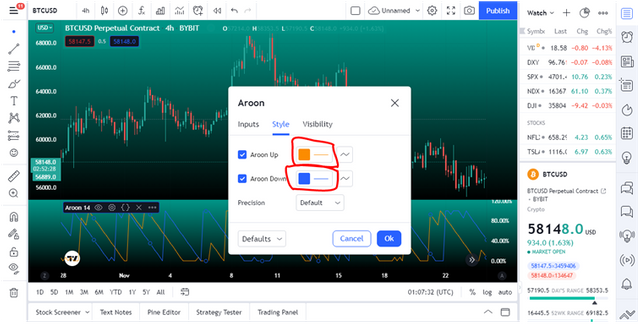
STYLE
The Style setting option allows you to provide a color to any of the Aroon lines, either Up or Down, with the goal of distinguishing the two lines to suit the viewer or user.
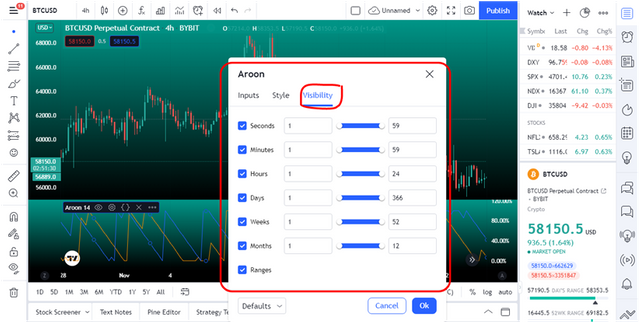
VISIBILITY
The visibility modification or setting option deals with what the user wants to see on the Aroon display panel. This means that the user can clear out the noise caused by other encroaching data supplied by the Arron indicator, allowing the viewer to have a nice outlook on the trading chart.
WHAT IS THE AROON OSCILLATOR AND HOW DOES IT FUNCTION?
The Aroon Oscillator is a two-line indicator that can be used to determine if a trend is moving upwards, downwards, or within a market range. Aroon-Up and Aroon-Down are the names of these two lines. When the Aroon-Up is higher than the Aroon-Down, the market is in an uptrend; when the Aroon-Down is higher than the Aroon-Up, the market is in a downtrend.
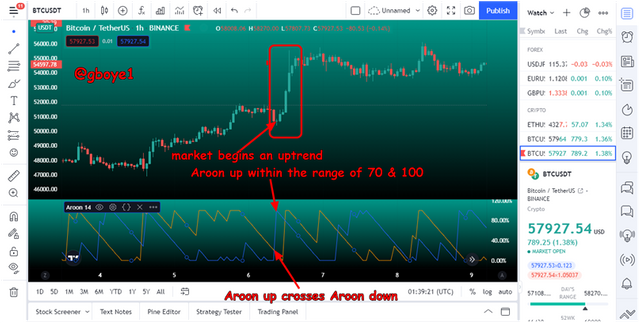
When the Aroon-Up reaches 100, the period has seen a new high, and a new uptrend may have commenced. A fresh uptrend may have started if the Aroon-Up was between 70 and 100 and the Aroon-Down was between 0 and 30. A Buy signal is generated when the Aroon-Up crosses the Aroon-Down upwards.
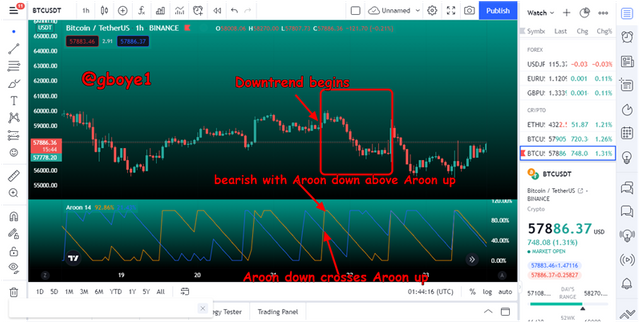
When the Aroon-Down reaches 100, it is possible that a new downtrend has started, and the market has just made a lower low for the period. It is a downtrend when the Aroon-Down is between 70 and 100 and the Aroon-Up is between 0 and 30. It's a Sell Signal when the Aroon-Down crosses the Aroon-Up higher.
CONSIDER AN AROON INDICATOR WITH A SINGLE OSCILLATING LINE, WHAT DOES THE MEASUREMENT OF THE TREND AT +50 AND -50 SIGNIFY?
As previously stated, the Aroon oscillator is a single line oscillator with a range of -100 to +100 with a center line of 0. A Bullish trend is indicated by movement of the Aroon oscillator line above the 0 or centre line, while a Bearish trend is shown by movement of the line below the 0 or centre line.
To determine if a trend is strong or has momentum, the Aroon oscillator line must cross above or below the +50 and -50 ranges, respectively, to demonstrate that a Bullish or Bearish trend has significant momentum.
AROON INDICATOR MOVEMENT IN A RANGE MARKET
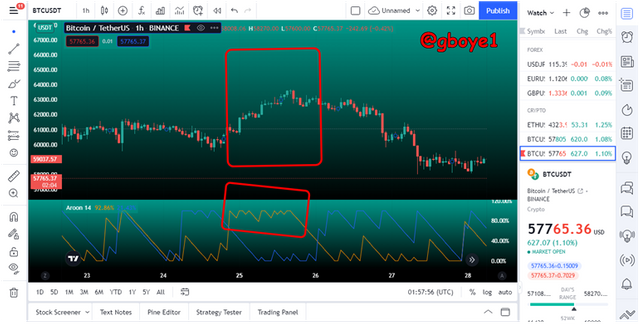
A ranging market is one in which the price action of an asset moves sideways without forming a clear trend. During this time, the Aroon indicator will move in a zig-zag pattern without crossing against each other.
The Aroon-up and Aroon-Down lines are shown performing zig-zag movements without crossing over each other in the image below, which is due to the market moving sideways or ranging. Most traders ignore the market during this period because it is a very difficult time to trade, but they are still looking for a cross over that might start a trend.
DOES THE AROON INDICATOR PRODUCE FALSE AND LATE SIGNALS?
The Aroon indicator, like all other indicators, has its own set of false SIGNALS. The Aroon indicator is a lagging indicator, which means that the data it generates is dependent on historical data or asset price activity.
FALSE SIGNAL
The Aroon indicator provides sell and buy signals for market entry, but these indications or signals may be erroneous owing to a cross-over of either the Aroon-Up or Aroon-Down, which could be caused by short-selling volume or by strong volatility in a short period. This false signal may be harmful to traders who do not have a thorough understanding of the market or who do not apply risk management methods.
LATE INDICATION
Most traders want to enter the market early enough since it allows them to capture a substantial amount of profit while also reducing their risk of suffering significant losses if the market falls against them. Because it is a lagging indicator, the Aroon indicator is prone to making late indications.
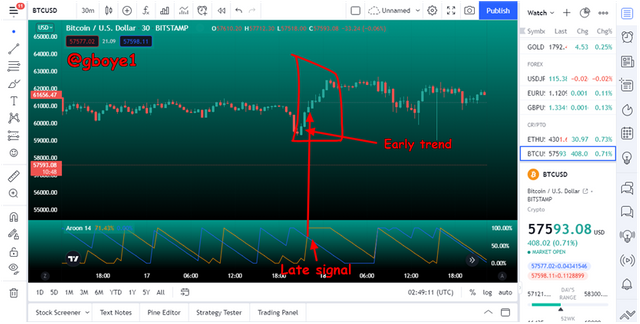
After many Bullish candles appeared to have built a Bullish pattern, the Aroon-Up indicator made a late cross over the Aroon-Down hours, as shown in the image above. Some traders will often miss out on a perfect trade entry if they blindly follow the Aroon Indicator's signals or indications.
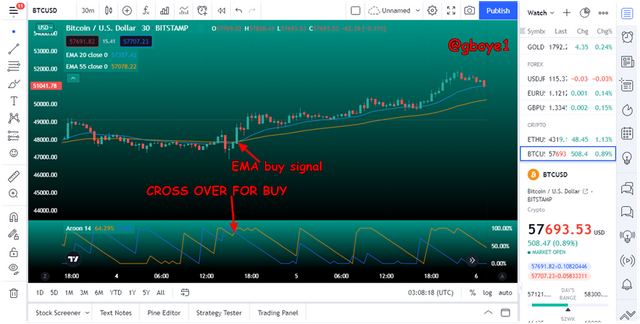
COMBINING THE AROON INDICATOR WITH EMA
When used in conjunction with other indications for technical analysis, the Aroon indicator is quite accurate. Late signals and false signals can both be minimized with this method. In this scenario, I'll be combining the EMA and Aroon.
Moving averages are indicators that are used to determine a market's trend. Shorter Moving Average periods are used to check short-term trends, medium Moving Average periods are used to check medium-term trades, and longer Moving Average periods are used to check longer-term trades.
In this scenario, I'll be combining the Aroon Indicator with EMA 55 and EMA 20. While both the Aroon Indicator and the exponential moving average (EMA) are trend indicators, the EMA explains price activity better. Using the EMA 55 and EMA 20, a purchasing order is verified when the EMA 20 crosses over the EMA 55 to go upwards, if and only if the Aroon-Up has passed the Aroon-Down Upwards.
The EMA 55 will cross the EMA 20 to confirm a sell position or a downtrend, and the Aroon-Down will be above (having crossed) the Aroon-Up.
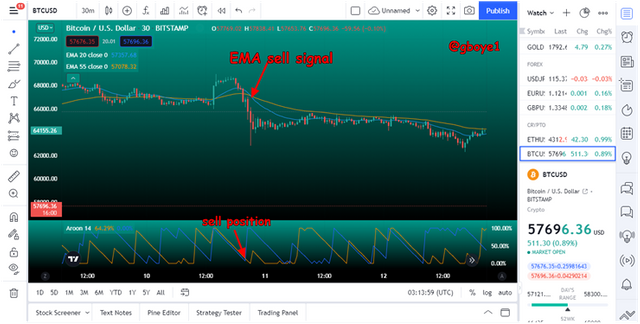
It is simple to filter fake or late signals with the EMA, resulting in increased trading chart accuracy.
TRADE USING AROON INDICATOR AND EMA
I'll use a tradingview demo account to execute this trade. Because the Aroon-Up is above the Aroon-Down and the 20 EMA is above the 55 EMA, I'll be placing a purchase order using the Aroon Indicator and EMA. I bought BTC/USDT with a buy order.
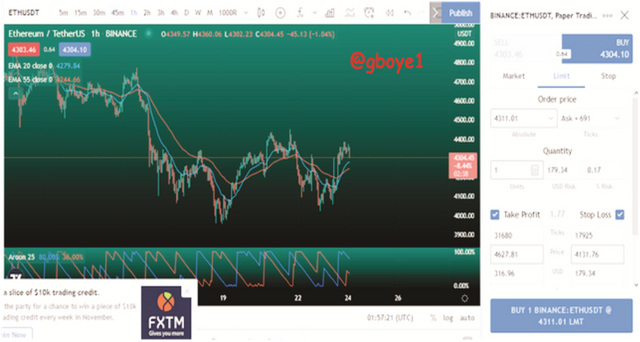
My entry point for this trade is $4304.45, my stop loss is $4131.73, and my take profit is $4627.81.
A sell trade can be opened because the Aroon-Down is above the Aroon-Up and the EMA-55 is above the EMA-20.
ADVANTAGES AND DISADVANTAGES OF AROON
ADVANTAGES
1.The Aroon Indicator can help you find good market entry and exit positions.
2.When one of the Aroon indicator's lines maintains a consistent movement above the other for a period of time, it might provide data or information on the strength or momentum of a Trend.
3.When its two lines (Aroon-Up and Aroon-Down) cross above each other, it indicates or signals a change in Trends, which can help traders assess the beginning of a new Trend.
DISADVANTAGES
1.Because the Aroon indicator is a lagging indicator, it can take a long time to confirm or establish a trend, causing traders to miss out on profitable entry opportunities.
2.Because the Aroon indication reacts to swift and short changes in market trends, it will always alter its movement, perhaps resulting in misleading signals that are harmful to traders.
3.The Aroon indicator always generates false signals in a range market, which is why it's best to combine it with other indicators.
CONCLUSION
The Aroon indicator is an excellent indicator for traders to learn how to use, and it is primarily used by trend traders. For the greatest results, combine this indicator with other indicators.