Steemit Crypto Academy Season 5, Week 5|Advanced Course|Homework Post for @kouba01 , Crypto Trading with Linear Regression Indicator
THE PRINCIPLE OF LINEAR REGRESSION
Linear regression is a predictive analysis concept.it is used in Linear Regression to determine the value of a dependent variable from the value of an independent variable. Linear regression variables are said to have a linear relationship. This link can be seen by plotting the dependent variable against the independent variable on a graph and drawing a Line of Best Fit through the points.

The graphs show a straight line. Because the line connecting the points is a linear line, the slope (positive or negative) has no bearing on the linearity of the analysis.
To ensure that the total of the squares of the line's distances from the plots is reduced, the line of best fit is created using the Least squares approach. To put it another way, it's drawn in a way that minimizes variance.
ITS USE AS AN INDICATOR
Gilbert Ruff developed the linear progression indicator in the 1990s to forecast asset prices, identify trend reversals, and distinguish active from nonactive trends. Due to the confirmation tool's capacity to predict the future price of a commodity, it may be used to confirm price movement in either direction and provide information on when to enter and quit a trade.
The Linear Regression indicator isn't only a trend following indicator; it also seeks to forecast an asset's price in the future. Although it resembles a Moving Average, it differs in that it does not take the average of the data points into account and hence does not delay as much as a Moving Average.
HOW TO CALCULATE THE LINEAR REGRESSION
We use the formula below to compute the Linear Regression Indicator:
Y = a + bX is a formula that can be used to calculate the value of a number
Where a = 0 is the price-time intercept.
The line's slope is B.
The independent variable X is a variable that has no effect on the outcome. Time
Using formula We may calculate the dependent or estimated value Y using the values from the preceding.
For example
Let's take for instance, if my X is say 10 and my b is 5, a is 0, to find the linear regression we can put the above formula into use
Y = a + bX
Y = 0 + 5x10
Y = 0 +50 = 50
This is only for the sake of a chart point.g
As a result, for consecutive values of Y plotted on the chart, the calculation continues.
ADDING THE INDICATOR TO MY CHART
To add the linear regression indicator to my chart, the following procedures listed below were meticulously followed
1 . First things first, am going to be using the trading view platform so I'll first of all visit the trading view website ( www.trading view.com )

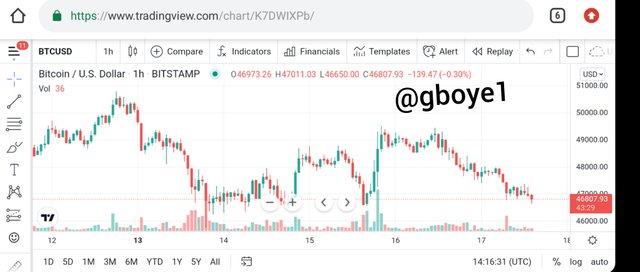
2 . Then I'll select the chart I want to analyse
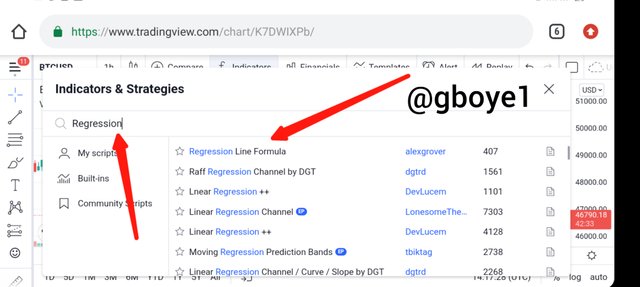
3 . Following the second procedure above, I clicked on the indicator icon to access the linear regression indicator
4 . next, you will see a search bar, input the name of the indicator of your choice
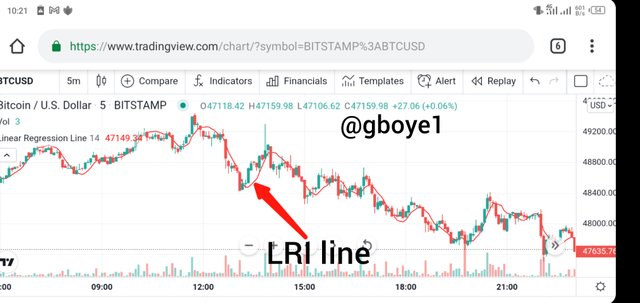
5 . Having followed all the above steps, the linear regression indicator has now been added to our chart.
HOW TO MODIFY IT
After adding the indicator to the chart of your choice, you can decide to make modifications to it to suit your taste.
As shown below, select the settings icon that is close to the indicator title at the top
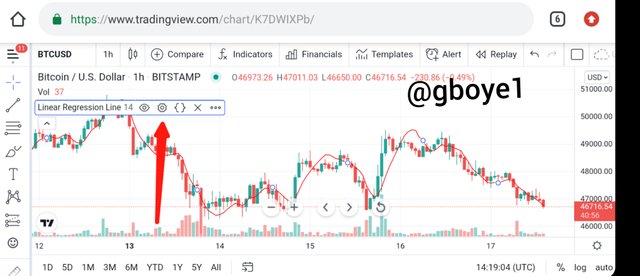
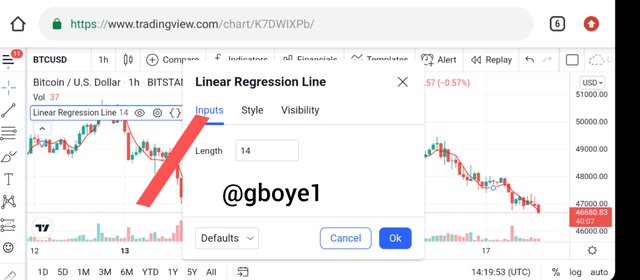
1 . INPUTS: The length parameter on the Inputs tab can be used to adjust the number of periods considered by the indicator. The default setting is 14.
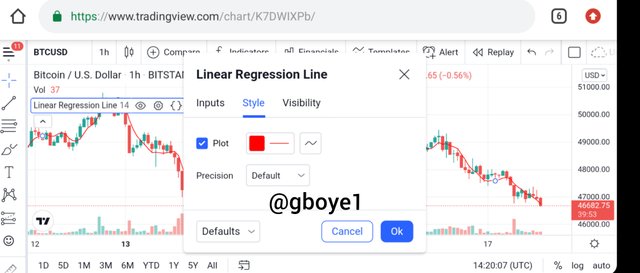
2 . STYLE: The Style tab allows you to change the indicator's color, opacity, and thickness.
IS IT BENEFICIAL TO CHANGE THE DEFAULT SETTINGS?
Linear Regression Indicator's default value is 14 periods. However, the effect of adopting the 14 period and 50 period may be seen in the charts above. On the 14 period chart, the line touches a lot of signals or points; however, on the 66 period chart, it touches fewer signals and gives a more trustworthy signal.
As a result, it is best to pick or choose a setting that best suits your trading style. Some say 66 days is the finest. However, everything is reliant on the trader and the strategy he used to achieve the greatest result.
HOW CAN THIS INDICATOR HELP US TO DETECT THE DIRECTION OF A TREND AS WELL AS ANY SIGNALS OF A TREND CHANGE?
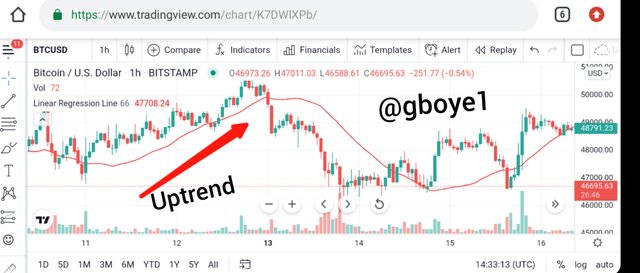
AN UPTREND
The Linear Regression Indicator moved upward as the price physically made higher highs and lower lows, as shown in the chart below. Because the indicator has a positive slope, it is a very clear indication of an uptrend.
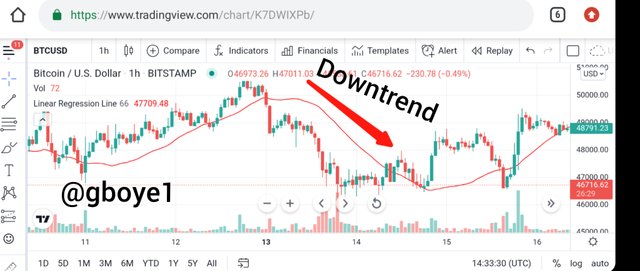
A DOWNTREND
The Linear Regression Indicator moved downward as the price produced lower lows and lower highs, as shown in the chart below. Because the indicator has a negative slope, this is a definite indication of a downtrend.
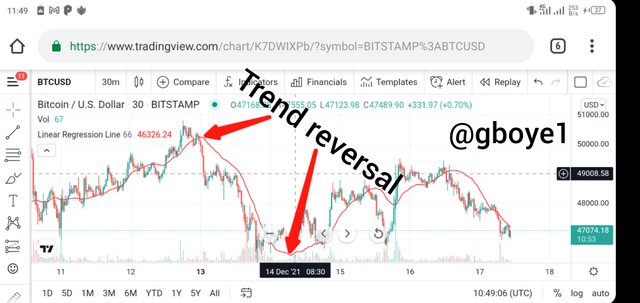
A REVERSAL
When the linear regression line shifts and moves in the other direction, it is said to be reversing. When we witness an inversion or reversal in the market, we know it's time to take action. The line will continue to move in the same direction until it reverts. Most of the time, the linear regression line behaves like this. Even after the line has crossed the price, traders should wait for the line to turn before verifying the state of reversal. So, while the line crossing the price isn't a reliable criterion for reversal, we should keep an eye on it when we encounter crossings because an inverted trend could follow.
HOW CAN ONE FORECAST WHETHER THE TREND WILL BE BULLISH OR BEARISH BASED ON THE USAGE OF A PRICE CROSSING STRATEGY WITH THE INDICATOR?
When the price rises or falls, a bullish or bearish trend emerges. We can forecast the trend based on the price crossing approach with Linear Regression indicator
IDENTIFYING TRENDS AND FORECASTING IT USING THE PRICE CROSSING STRATEGY
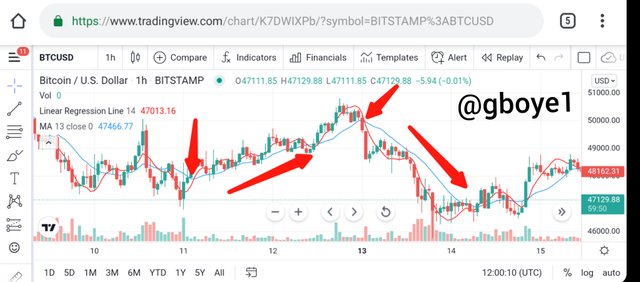
When the linear regression line crosses the price in a downward movement and then makes a bullish movement from that point, it is called a bullish reversal. That is the premise on which traders believe the market will change hands. As I previously stated, every cross does not guarantee a reversal. When the line and the price cross on most indications, a reversal is expected, either bullish or bearish. If simply the linear regression indicator is used to predict price action, I saw that it moves further after the cross (on numerous instances) before reverting, which is why it's necessary to follow the trend.
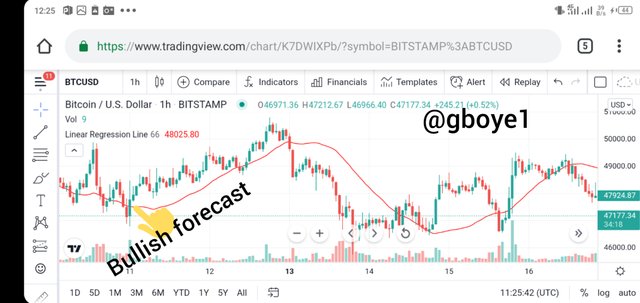
IDENTIFYING A BULLISH TREND FORECAST
The price and line cross in the image below were both intact. When the cross occurred, the market reacted positively. Of course, we can continue to think about it, but we must remember that we must wait for numerous bullish candles to form before concluding on the market's bullish advance.
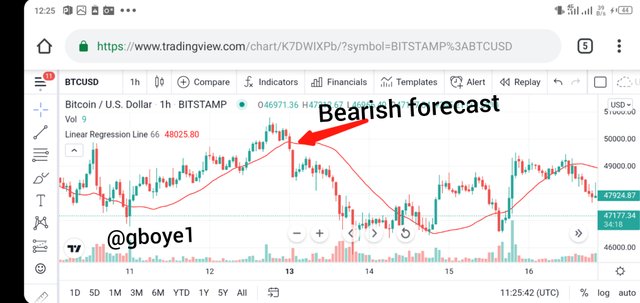
IDENTIFYING A BEARISH TREND FORECAST
A price cross-over was visible in the image below, resulting in the asset's negative action. Multiple bearish candles indicate a negative trend. In a nutshell, when the red candle forms in a row following a price crossing, we may expect the price to fall, as shown in the image below.
EXPLAIN HOW THE MOVING AVERAGE INDICATOR ASSISTS THE LINEAR REGRESSION INDICATOR IN STRENGTHENING THE SIGNALS.
We can observe some similarities between the two indicators when we look at the linear regression line. Traders frequently employ two moving averages, with the intervals between them differing. Some traders like to employ Fibonacci numbers, however this is dependent on the time period they want to use. Because of their similarities, combining a moving average with a linear regression line is comparable to using two moving averages. Because the two indicators can predict the market movement on their own, traders can easily obtain a double signal when they utilize them together.
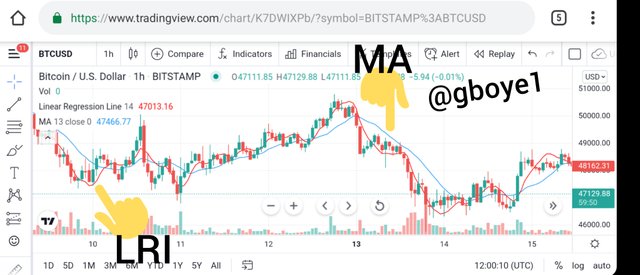
I picked 14 for the linear regression line indication in the image above and 13 for the Moving Average since I wanted something closer. I was able to figure out a bearing and a bullish indication using the two indicators. The moving Average is the source of strength, whereas the Linear Regression indicator is the focus.
The market would move bullish every time the linear regression indicator crossed the moving average to the top, as we can see from the places I marked in the image. A bearish market emerges when the linear regression indicator crosses below. The moving average enables spotting the market trend easier, hence it aids the linear regression indicator in identifying the next market trend.
DO YOU BELIEVE THE LINEAR REGRESSION INDICATOR IN CFD TRADING IS EFFECTIVE? DISCUSS THE KEY DIFFERENCES BETWEEN THIS INDICATOR AND THE TSF INDICATOR.
In CFD trading, the Linear Regression Indicator is quite helpful in forecasting future prices. In terms of practical use, the Times Series Forecast (TSF) is similar to the Linear Regression Indicator. The TSF, like the LRI, combines the terminal values of various Linear Regression lines to produce signals, although it does so largely in the short term.
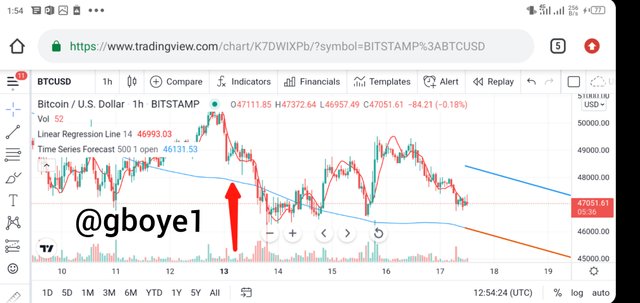
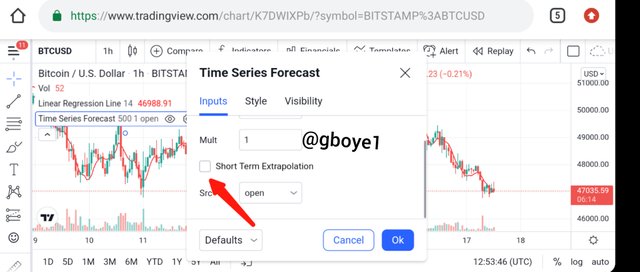
When we first add the TSF to the chart, it looks nothing like the LRI just as we see above
The following settings must be changed to resolve this issue: Select the box for Short-Term Extrapolation, to factor in the closing price, change the Source to Close., as desired, adjust the length.
Then, as seen below, the TSF resembles the LRI
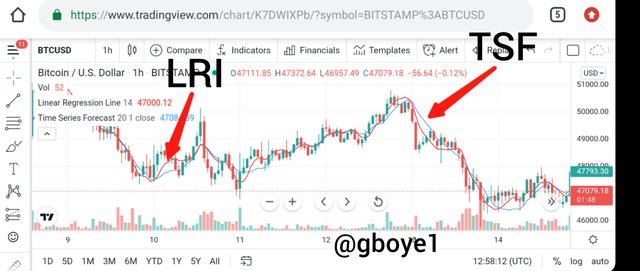
When the LRI and the TSF cross, the market moves in one of two directions: bullish or bearish. A bullish trend exists if the blue line (TSF) is below the red line (LRI). When the TSF rises over the LRI, a downward trend is expected.
THE MAIN DIFFERENCES
1 . The LRI calculates the dependent variable based on the independent variable, whereas the TSF plots each bar current regression using the least square fit approach.
2 . The LRI is less responsive to price changes than the TSF.
3 . The slope at the end of the regression line is not added by the LRI. The TSF, on the other hand, adds slope to the regression line's finishing value.
THE LINEAR REGRESSION INDICATOR'S ADVANTAGES AND DISADVANTAGES
ADVANTAGES
1 . The LRI is a simple and effective indicator.
2 . It's a good validation of the current trend
3 . Because of its lagging nature, the reaction to direction changes is quick.
4 . It can be used to determine whether or not a situation is reversing.
DISADVANTAGES
1 . For high-volatility markets, the Linear Regression indicator is ineffective. This will result in a large number of false signals.
2 . Only linear relationships are important to this indicator.
3 . By combining it with additional indicators such as the Macd and the RSI, you may get the best of the indicator.
4 . Signal generation by the indicator is delayed.
CONCLUSION
The Linear Regression indicator can be used to spot trends and provide trading signals. Despite the fact that the indicator is simple to use, we must always exercise caution when using it.
Linear regression is a crucial topic that has proven to be incredibly effective in the crypto and financial markets. The Linear Regression Indicator, as we saw in the course, is a prominent statistical concept that is applied to trading.