[Crypto Trading With Average True Range (ATR) Indicator] -Steemit Crypto Academy | S5W1| Homework Post for @Kouba01
ATR INDICATOR AND HOW IT IS CALCULATED
The average try range (ATR) is a technical analysis tool created by J. Welles Wilder Jr to evaluate the volatility of an asset over a specific period of time and thereby assist traders in making decisions. To begin with, the indication's versatility has influenced traders in the cryptocurrency markets and traders are making use of this indicator in all sectors.
The indicator calculates volatility by calculating how much price moves on average during a given time period. ATR does not predict future trends, but it does assist traders in determining critical parameters such as stop loss and take profit levels.
ATR indicators are risk management tools that help traders exit the market when the price is not in their favor and join the market at the proper time, in addition to assessing volatility in the price of an asset. Traders who want to maximize their trading success by minimizing risk and analyzing market volatility before making any trading decisions can use the ATR indicators. When price moves rapidly up and down over a short period of time, we say it is volatile.
THE ATR CALCULATION
To calculate the ATR, we must first select the period we want to calculate; this might be a 7-day period, a 14-day period, or any other duration that works best for us.
The ATR is calculated using the formula provided below.
Present ATR= (Previous ATR * 13 + Present True Range) / 14
These 13 and 14 are used for calculating for 14 days, however, they are interchangeable.
Let's have a look at various ATR parameters.
1.THE RANGE: The difference between prices high and low for a given trading day is referred to as the range. The volatility of an asset is proportional to the range. The wider the range, the more volatile the price on that particular day will be. Furthermore, the shorter the range, the lower the day's price volatility. The price range is defined as the difference between the highest and lowest price points. i.e High of price - Low of price
2.TRUE RANGE: When compared to the range, the true range provides a more realistic representation of volatility. 3 mathematical equations are used to do this. The true range is calculated by taking the largest value from the three equations.
We'll need to use the formula below to figure out the true range first.
TR=max(H-L, H-P, P-L)
Where: TR = TRUE RANGE
H= High
L=Low of the day
P= Previous day`s close
Using 14 periods as a default, the ATR is calculated by calculating the simple moving average of the True Range. The ATR is derived over a 14-day period by dividing the True range for the previous 14 days by 14.
After computing the first ATR value over a set period, use the formula below to compute the succeeding ATR value.
(Previous ATR (n-1) + Current True Range) / n, where n is the number of periods.
Then we'll figure out how much the high and low differs.
Second, we must deduct the high from the previous close. Finally, we'll take the previous day's close and subtract it from the current day's low. Our TR is determined by the highest value among the three calculations we performed.
EXAMPLE:
For instance, the previous ATR for the 14 periods is 6.4, and the maximum true range for the following day is 4.5.
The current ATR is going to be equivalent to
Current ATR = [(6.4 × (14-1) + (4.5)] / 14
Current ATR = (83.2 + 4.5) / 14
Current ATR = 6.26
The ATR has reduced as a result of the calculation, indicating that the asset's volatility has decreased.
WHAT IS THE BEST SETTING OF THE ATR INDICATOR PERIOD?
ATR has a default value of 14 periods. It is, however, not fixed and can be changed depending on your trading style, the ATR indicator period can be increased or lowered. The general rule to remember is that reducing the time period increases the number of false signals and generates noise. On the other hand, increasing the time period reduces false signals by lowering the indicator's sensitivity. Simultaneously, the number of signals generated decreases.
Trading style, I believe, will define the optimal setup. Intraday traders, for example, choose a smaller time frame, while swing traders prefer a longer time period. When a trader finds a setup that produces a more profitable result, he must stick with it. However, multiple experiments will be conducted over time to establish what best suits him.
HOW TO READ THE ATR INDICATOR AND READING THE INDICATOR WITH OTHER TOOLS
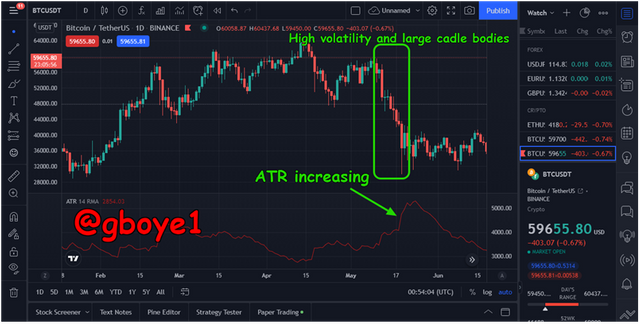
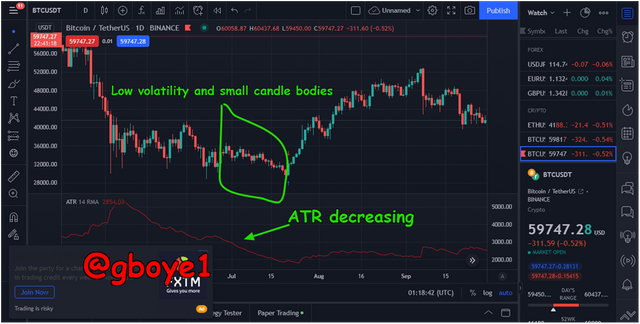
On the chart, the ATR is quite easy to read. The indicator measures the market's volatility. This means that increased price volatility, which is accompanied by larger candlestick bodies, results in higher ATR readings. Similarly, when market volatility is low and candlestick bodies are tiny, the ATR indicator tends to decrease in value.
We can witness larger body candlesticks on the chart in a negative high volatility market, as shown in the chart above. The ATR indicator, which increases in value as volatility rises, can highlight this. The fact that the ATR is increasing indicates that market volatility is significant.
Following the extreme volatility we stated before, we notice a lowering value of the ATR indicator as market volatility decreases, as shown in the chart below. Small body candlesticks produce price ranges inside borders, as seen on the chart. Traders can use this data to make informed trading decisions, as well as determine when to enter and quit the market.
USING DIFFERENT TOOLS TO READ THE ATR INDICATION
Due to market fluctuations, indicators are prone to false signals. For thorough confirmation of the signals from the indicator, it is best to combine indicators with other technical analysis tools. The ATR works best when paired with other tools like the Parabolic Sar, according to the lecture. In this section, I'll combine the ATR indicator with a volatility-based indicator called the Bollinger band.
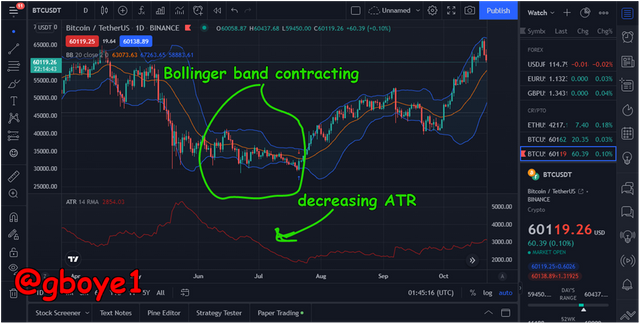
With the ATR indicator, I chose 14 periods to have the same price data points in the last 14 days. As we see price breaking out of the upper and lower bands, the Bollinger band signs are expanding, indicating severe market volatility. Similarly, the Bollinger band contracting indicates little market volatility.
The ATR indicator's value is decreasing in the chart above, indicating that market volatility is decreasing. This signal can be validated using the Bollinger band indicator, which shows a contraction of the upper and lower bands.
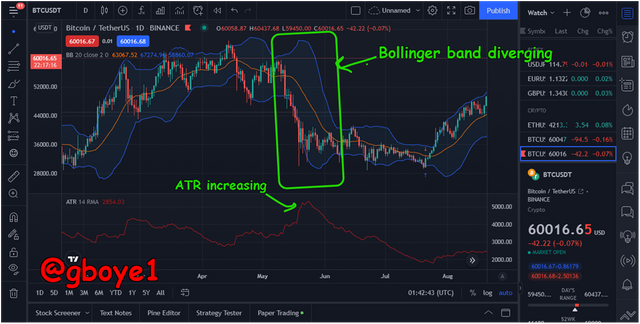
As larger candlesticks break below the lower band in the chart above, we can see the Bollinger band expanding. This indicates a significant level of market volatility, which is reflected in the ATR indicator's increasing value.
It is not advisable to utilize only one indicator for our cryptocurrency analysis, and ATR is no exception.
To confirm the signal from the ATR indicator, we've merged the Bollinger band indicator and the ATR indicator. This can help improve the ATR indicator's performance while also filtering out noise and false signals.
KNOWING THE PRICE VOLATILITY
The ATR indicator can assist us in determining price volatility. Price momentum or volatility is detected by an increase in the value of the ATR reading, as I previously stated. As a result, whether the market is moving upward or downward, such volatility is accompanied by an increase in the ATR value. It's also worth noting that after the ATR reaches its minimal value, it tends to shift.
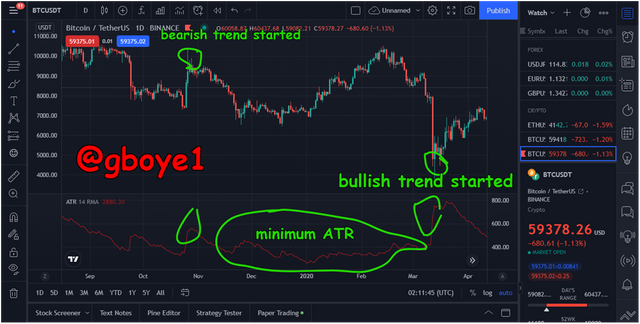
Using the BTCUSDT asset pair, it is obvious that price volatility occurred, resulting in a significant increase in the ATR's value. The points shown with red circles are where the volatility occurred. Showing us the beginning of a negative trend.
The ATR returned to its base or minimum after that volatility.
We also witnessed price volatility at another point with the green circle, as seen by the abrupt jump in the ATR indicator's value. It indicated a bullish reversal this time. After that, the ATR dropped to its lowest level.
As a result, we can deduce that the increase in ATR indicator readings is directly proportional to price volatility, which is frequently a sign of trend reversals.
HOW WE CAN DETERMINE THE DOMINANT PRICE FORCE USING THE ATR INDICATOR
We must keep in mind that an increase in price does not always imply an increase in ATR values, but rather in volatility. As a result, as the ATR value rises, we can better understand the prevailing price force in the market, whether it is bearish or bullish.
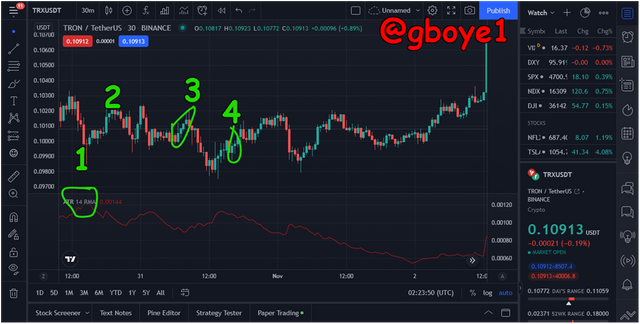
We can see from the above sample chart that the price drop at point 1 correlates to an increase in the ATR value, suggesting price volatility.
This merely means that the dominating price is bearish at that time. The price gain exhibited with successive bullish candles at points 2 and 3 was not supported by the ATR indicator. As a result, it demonstrates that it is not yet the dominating price force.
However, in point 4, we noticed that when the price rose, the ATR indicator value rose as well, indicating price volatility. The trend has shifted from negative to positive at this moment. As a result, the price is currently dominated by bullish factors.
By examining the price action chart and comparing it to the indicator, we can clearly identify the dominant force on the price of an asset pair, allowing us to easily ride the trend.
MANAGING TRADING RISK WITH ATR INDICATOR
The crypto market is extremely volatile, which makes it a risky investment. Exiting the market when in a loss (Stoploss) as well as when the market moves in your favor requires good risk management (Take profit).
The advantage of ATR can also be applied to improved risk management in your trade. This is one interesting feature about the ATR that most of the other indicators lack.
Stoploss: When you're losing money, you'll want to close your trade.
The market will not always follow our forecast. To prevent blowing your money, you'll need an exit strategy to close your position when the market goes against your prediction. Stoploss is a pending order that allows you to exit your position automatically if the market moves against you.
To avoid being triggered too rapidly, a stop-loss cannot be too tight. Similarly, a stop-loss will not be too large in order to limit losses if something goes wrong. The ATR indicator aids in determining a good stop-loss position. The following formula will be used:
Entry price +/- 3x ATR value
STOP LOSS
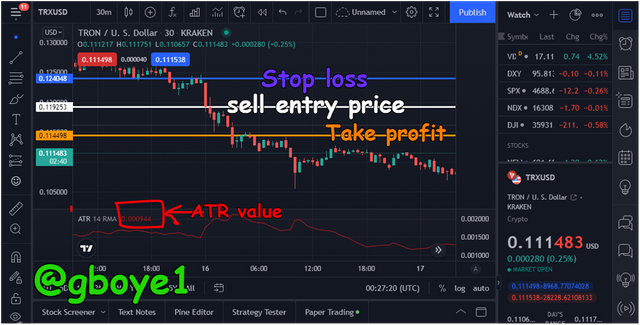
From the chart above, I have a sell entry price of 0.119253 for TRX/USD, and the current ATR value is 0.001588. Using the formula above, we can now calculate the stop loss point as follows:
Stoploss = 0.119253 + (3 x 0.001588)
Stoploss = 0.124048
This means that my stop loss will be set at 0.124048. The location is found above the current high, as shown in the chart below. The chances of price reversing back to this point are slim, and if the price does ultimately reach the stop loss, the setup will be invalidated. In this case, the ATR indicator has aided in the placement of a Stoploss at a strategic location.
TAKE PROFIT
To calculate the take profit, I utilized the Entry price +/- 3ATR value formula in the chart above. To maintain a 1:1 risk management on my trades, I used this method.
For example, in the previous example, the take profit position will be calculated as follows:
Take profit: 0.119253 - (3 x 0.001588)
Take profit = 0.114498
Using the ATR to get at this value, there's a good chance the price will fall to this level.
I've provided a stop-loss target on the chart above, which will give my trade more room to get to the take profit. One of the most astonishing qualities of the ATR indicator is how well it manages risk in the market.
HOW DOES THE ATR INDICATOR ALLOW US TO HIGHLIGHT THE STRENGTH OF A TREND AND IDENTIFY ANY SIGNS OF CHANGE IN THE TREND
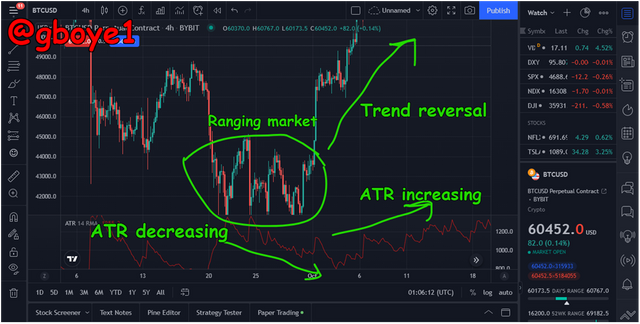
Price bounces off support and resistance levels in range markets to build momentum ahead of the start of a new trend. Depending on the driving force between the buyers and sellers, the price can break out either upwards or downwards.
The ATR indicator can be used to assess the strength of a trend by reflecting price movement. We can see how a key resistance was broken after a reversal in the chart below. The ATR indicator initially did not show the strength of this trend reversal because there was no increasing value to corroborate the new trend's strength.
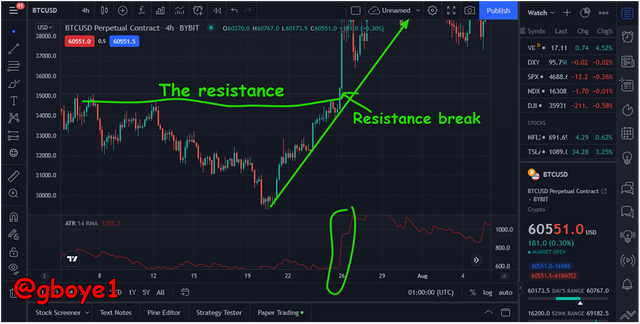
Looking at the chart, we can see that price has broken through the significant resistance level, indicating that the uptrend is still in place. The increasing value of the ATR indicator shows the strength of this new trend. The strength of the uptrend was able to break through the resistance level, indicating that buyers have a dominant force in the market pushing the price upward.
SIGNALS INDICATING TREND REVERSAL
The ATR indicator is used to determine the market's dominant force in a moving market. The ATR indicator's value rises in line with price activity, indicating this. When price reaches a high peak or when there is trend exhaustion, the ATR tends to fall in value. This indicates that there is no volatility or strong force pushing the price in the trend's direction. Following that, we should see a reversal in the opposite way.
Following a bearish trend with a high ATR value, we can detect weakness in the trend as price ranges in the chart below. Similarly, the ATR indicator was dropping in value, indicating that the trend was weakening. This indicator indicates that there isn't enough volatility or strength to keep prices falling. After some time, the price broke above the resistance, signaling a bearish to bullish reversal. As the ATR indicator's value increased, this trend reversal was further verified.
ADVANTAGES OF ATR INDICATOR
1.It aids the trader in determining the asset pair's price volatility since higher values indicate that the asset is more volatile with larger price swings.
2.Knowing the ATR range for the period allows the trader to select proper stop loss and take profit levels.
3.When used in conjunction with other indicators, it also offers the trader excellent entry points.
4.It is quite easy to read and is presented on the chart in a very straightforward manner.
5.It can be used on any timeframe, with settings tailored to the individual's trading style.
DISADVANTAGES OF ATR INDICATOR
1.The most significant disadvantage is that ATR does not provide an entry signal. It gives a good concept of volatility, but there is no input signal to actualize.
2.ATR does not indicate a future market trend.
3.Volatility cannot be measured in absolute terms. It is the result of a comparative study.
4.ATR, like other indicators, is not 100 percent accurate and requires more data.
CONCLUSION
The ATR (Average True Range) is a non-directional technical analysis indicator that is used to measure market volatility. Furthermore, it aids risk management by supplying rational Stop Loss and Take Profit levels. Although it is a basic tool, it does have certain limitations, such as the requirement for other technical indicators to confirm signal formation.