Steemit Crypto Academy | Season 3: Week 7 || How to create an account on TradingView, how to use indicators,tools, features of tradingview @gaby7491
Link
Happy start to the week, as usual, pay attention to your lecture this week @yousafharoonkhan, and learning about tradingview was very important, in addition to all the things we can find in your environment, this is my task.

Question no 1:
Defining the TradingView site and how to register an account in tradingview? what are the different registration plan?(screenshot necessary).
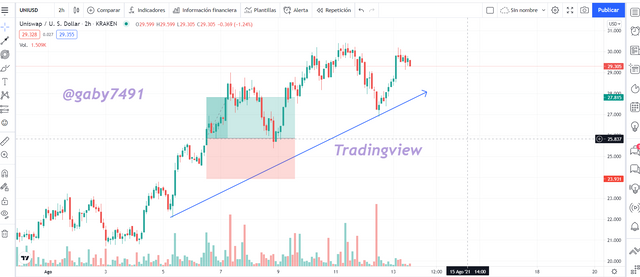
The Tradingview viewer is an instrument capable of serving as a form of help for the world of trading, this instrument graphically represents what is happening in the financial market, we do this by relating the market with the different trends and with the editing tools that provides tradingview, in this online program we can learn and discuss all kinds of entry and exit methods and strategies for a market, we can find many financial options in different markets, forex stocks, mineral stocks, stocks from each country and cryptocurrencies, that is very important since we can change markets very easily without having to leave tradingview and go to another trading page.
Link
The tools and characteristics are important to use tradingview, an important tool is to compare values with financial assets or other cryptocurrencies, in addition to having market level alarms and other great varieties of characteristics.
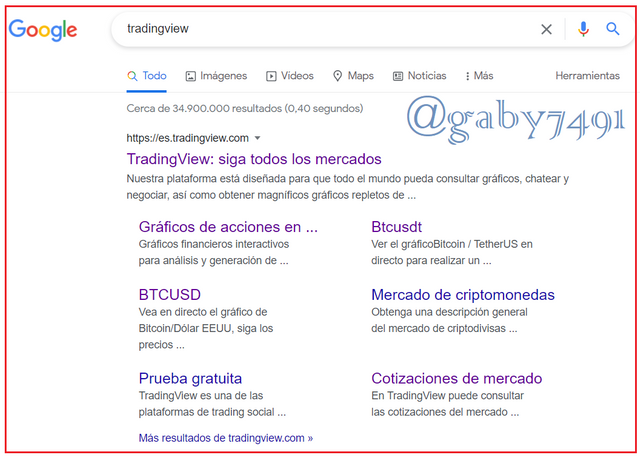
We can do our registration in the official link of trading view https://es.tradingview.com, or by manually writing tradingview in a search engine, it can be anyone.
Link
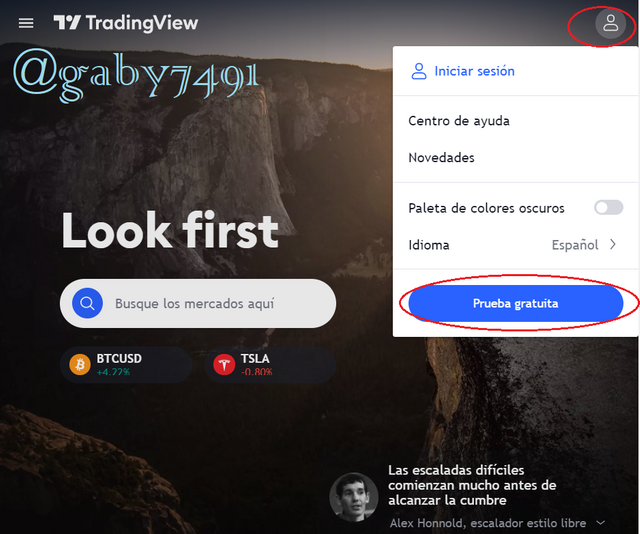
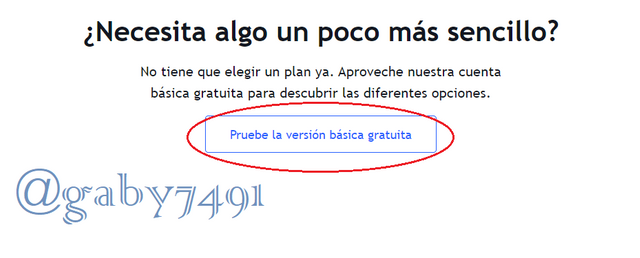
Then we will enter the main window and go to the user logo in the upper right part, and click on free trial.
Link
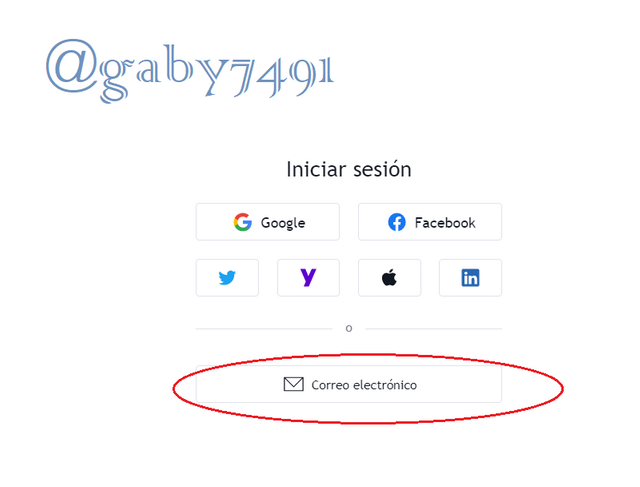
We look for the selected option at the bottom of the main window of the page.
Link
We will create our user in any of the social networks acceptable to the platform.
Link
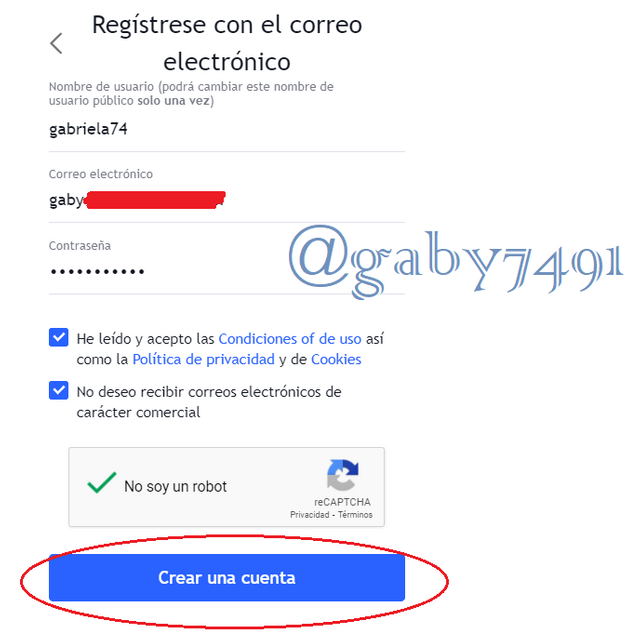
We record our personal data and read the terms of use and confirm.
Link
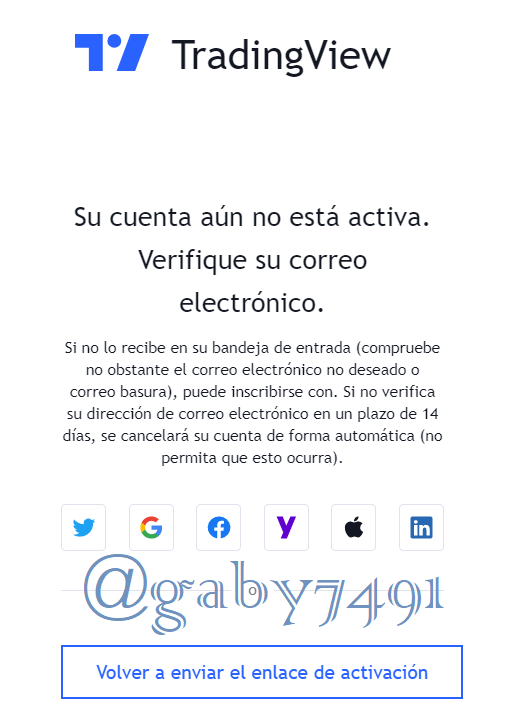
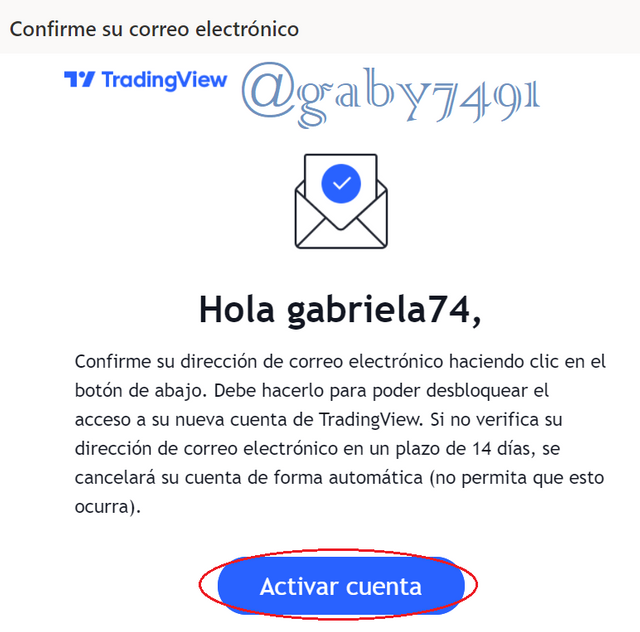
We will find the activation email in our email.
Link
We activate the email by clicking on it.
Link
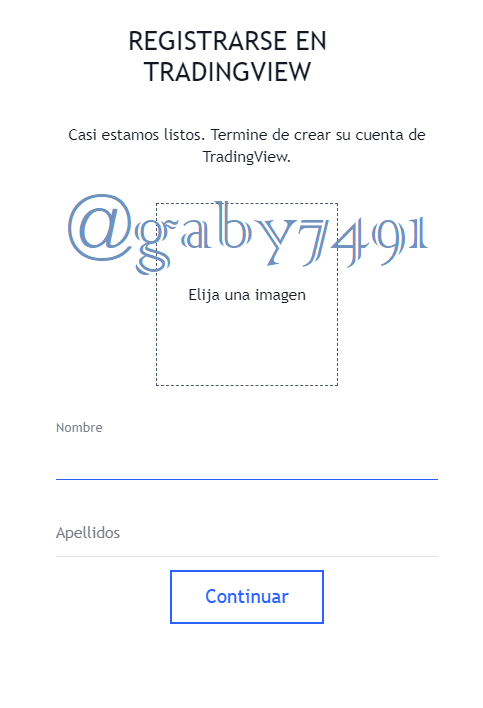
We must put our name and an image for our profile.
Link
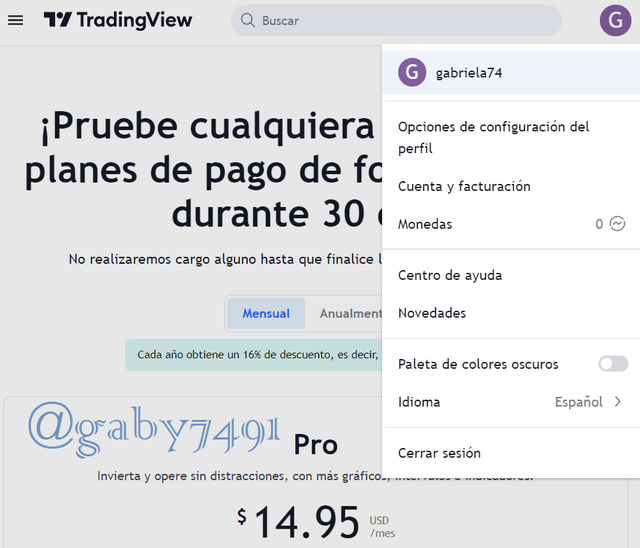
Here we see my fully operational account.
Link
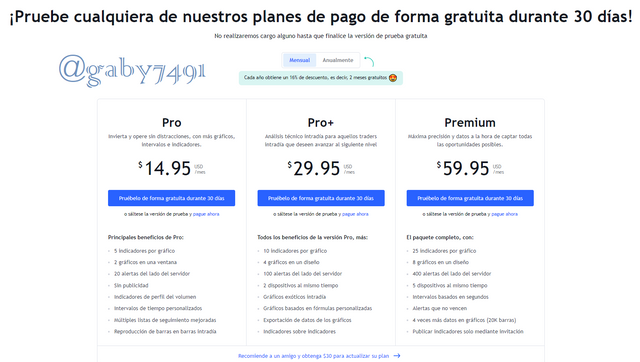
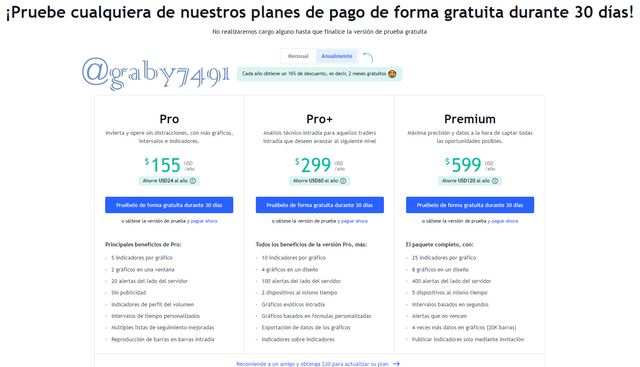
The service plans that the page establishes are according to a series of special implements that the page provides for better comfort, since in the free version the graph is limited to many functions, especially to add more than 3 indicators at the same time, for To solve this problem, the page establishes 3 plans, pro, pro plus and Premium that have implements such as adding more than 5, 10 and 25 indicators to our graph, in addition to many other implements that we can see in more detail in each of The plans, there is the monthly payment version and the annual payment version, each of them offers a different service offer and it is possible to lower this price if we invite more people to join.
Link
Link
Question no 2:
Explain the different features of tradingView and what is your favorite feature and why?(screenshot necessary)
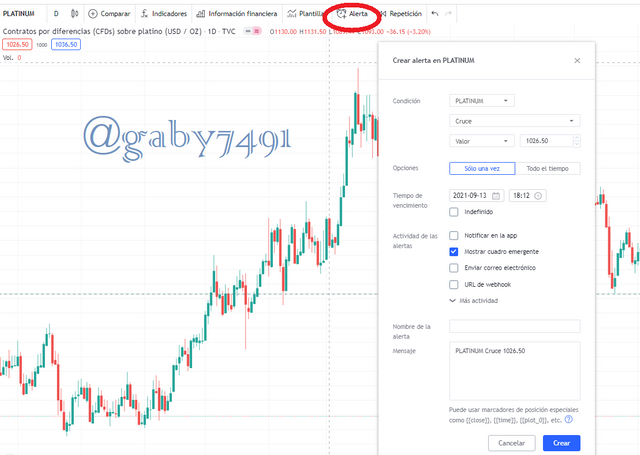
The first characteristic that was noticeable at first glance, was the alert, you can generate a short alert zone and points where we want to place the alert point, when it reaches that point we will have an alert notification.
Link
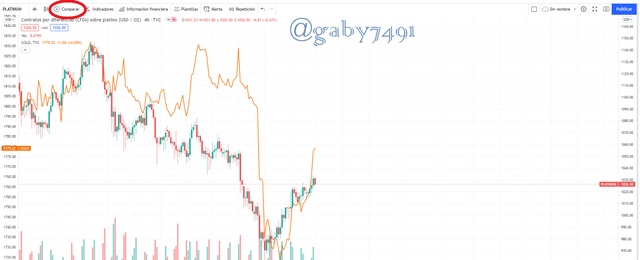
Note that you have the comparison feature, to buy two financial assets together, this is also useful when we have investment in 2 different markets and we want to see how the market varies we can place both on a single chart.
Link
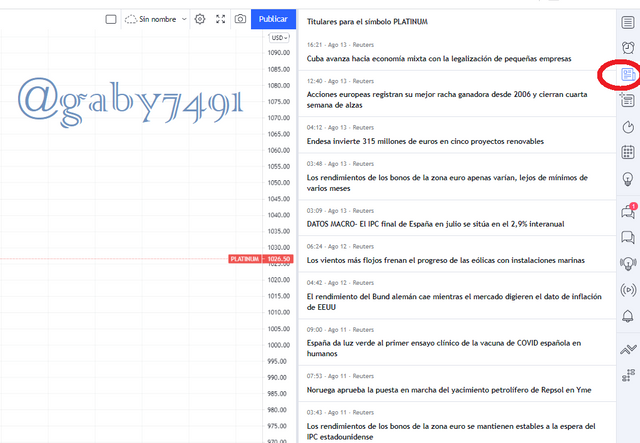
We have the present tense news feature.
Link
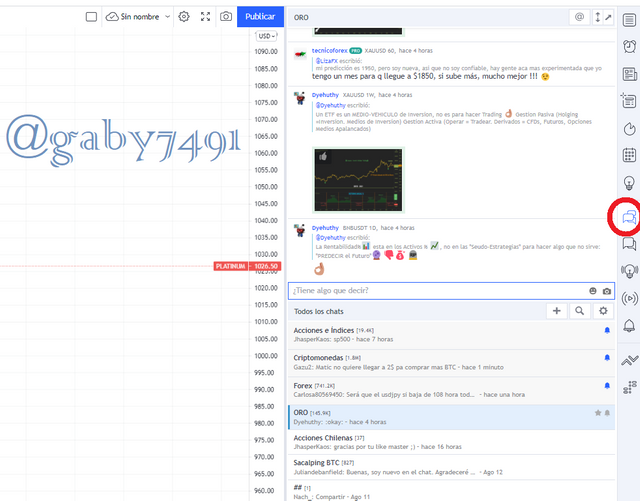
Live chats feature.
Link
All the characteristics described above are very important, and I would not stop using any of them because in the financial market we must have many characteristics and tools so that it is easy to enter them and see what we want to see and use them in a way that serves us For our investment, the news and live chat feature is my favorite because it helps me predict a possibility of change in the market before it happens.
Question no 3:
How to set up a chart in TradingView and use two tools to edit it.(screenshot necessary).
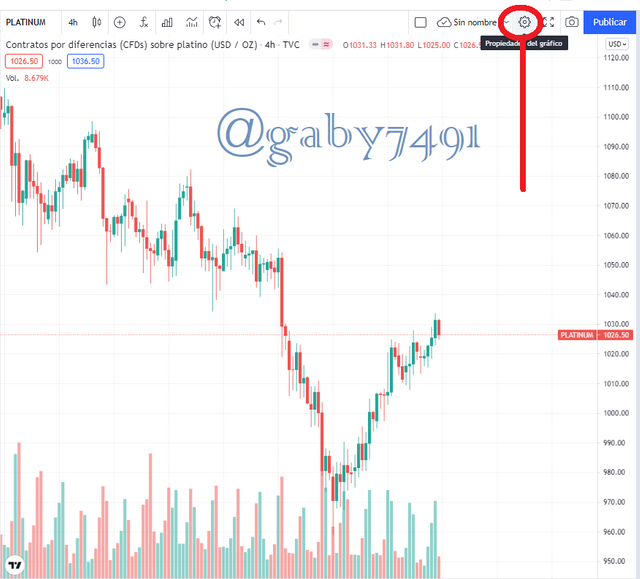
If we want to configure the graphic, we must configure it by clicking on the following emblem.
Link
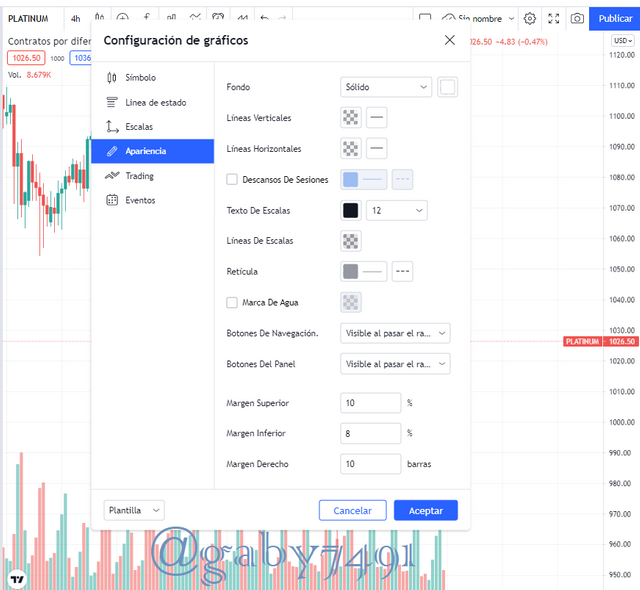
We can deal with various configurative shapes that suit our strategy.
Link
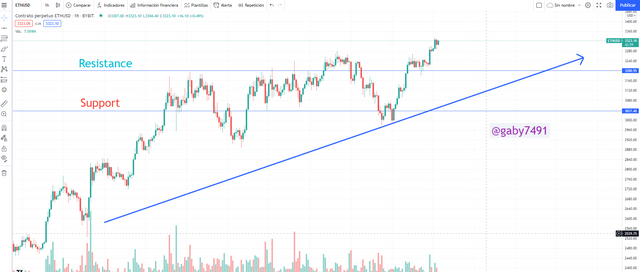
For the study and use of 2 tools, I did an analysis in ethereum, naming the strongest resistance line, which surpassed and reached a new peak, and the support line that has been maintained, the text tool and horizontal line.
Link
Question no 4:
Explain how to add indicator in chart, what is your your favorite indicator and why? (screenshot necessary)
We enter indicators to find the indicator.
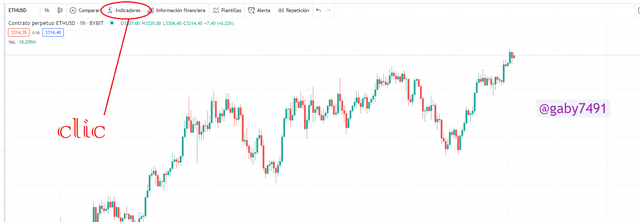
Link
Tradingview has different types of indicators in its library, I know the indicator very well, RSI Relative Strength Index.
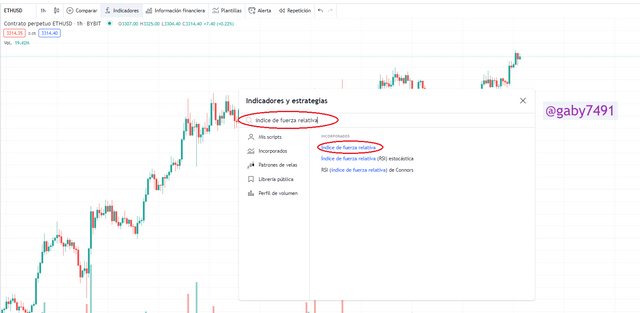
Link
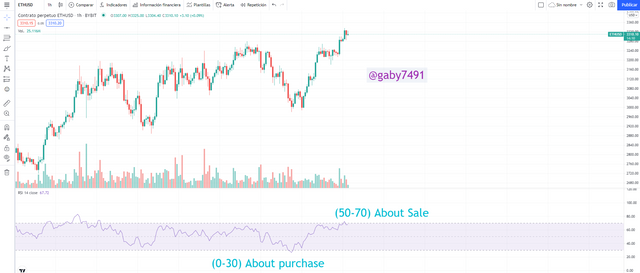
Already having the indicator added, we can benefit from its data offered, this indicator works in standard periods of 14 days for a better reading, we can also take profit of buying and selling when the points are in the appropriate range, the RSI indicator has a characteristic line called RSI and ranges between 0 and 100, if the RSI line is in the zone below 30 to 0, it means that it is in an overbought position and we can buy, and if it is 50 and 70 it is oversold and we must sell. It is very easy to read.
Link
Question no 5:
Do you think TradingView is useful in predicting the market for cryptocurrency (trend / price)?
TradingView is used a lot to predict the future of the market because for its easy use and simplicity, it makes it preferred among large numbers of investors, not to mention that it has many characteristics that can be incorporated into our analysis and thus further assisting our method to be carried out. , this shows that tradingview is created to study different types of markets and their trend, we can also find easily accessible tools and very smooth handling, one of the characteristics that I investigated was the live news, this is very important in addition to the public chat, because both help to make a clearer and more hasty decision of a market through an important news, the tradingview diagram is one of the most complete that the market has, but the free version has many limitations, such as the limit of indicators allowed in the diagram, have several charts in a single window, to expand this you have to buy a consumption plan.
Conclusion
I am grateful for having been present in this class, and having presented my great task, traddingview is a site that can be accessed in any browser from any device that can connect to a network, anywhere in the world, which allows us to analyze the trend, price and a limited prediction of the future price, all this depends on the method we will use and what strategy we carry out, this class was one of my favorites, I am very happy to share my task with everyone.
Respected first thank you very much for taking interest in SteemitCryptoAcademy
Season 3 | intermediate course class week 7
you explained well but need more research in question 2 to 4, you did not explain main points of the question, you just shared screenshot but need more to explore the question main point
thank you very much for taking interest in the homework