Crypto Trading Strategy with Triangular Moving Average (TRIMA) Indicator - Crypto Academy / S6W4 - Homework Post for @fredquantum.


1. What is your understanding of the TRIMA indicator?
Moving Averages such as Exponential moving average, Simple moving average must be a conversant word to a trader. The simple moving avarage (SMA) is the average of the price over the period in consideration. For daily chart, most of the time moving averages are based off the closing price and you can adjust them off the high, the low or the open and sometimes a midpoint.
Triangular moving average is basically double smooth so it is the average of an average. What it does is to smoothen things out even more. TRIMA is technically the average of a given no. of SMA in consideration.
2. Setup a crypto chart with TRIMA. How is the calculation of TRIMA done? Give an illustration. (Screenshots required).
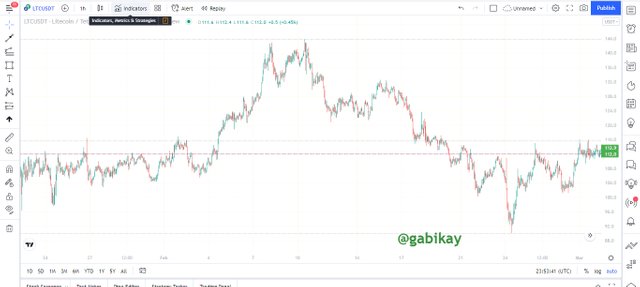
For the excercise of setting up a TRIMA on a chart, I will use tradingview to illustrate.
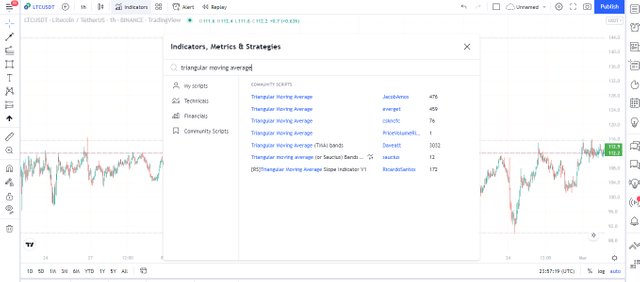
Firstly, open the tradingview site and click on chart. Next click on the indicator iconand on the search bar, input triangular moving average. Click on the first result and TRIMA will be added to the chart.
On the setting of the indicator, I changed the period of TRIMA to be lcone 20.
Calculation of TRIMA
For example, if we consider a 20 period 5 day SMA, then to calculate the SMA, we have to sum up the closing priced of day one, two, three, four, and five and then divide it by the number of days (5)
SMA = (d1 + d2 + d3 + d4 +d5) ÷ 5
This gives us the SMA value but we seek to find the TRIMA value and as previously discussed, TRIMA is the average of SMA. Hence, we consider 5 SMAs and then find their average value.
TRIMA = (SMA1 + SMA2 + SMA3 + SMA4 + SMA5) ÷ 5
3. Identify uptrend and downtrend market conditions using TRIMA on separate charts.
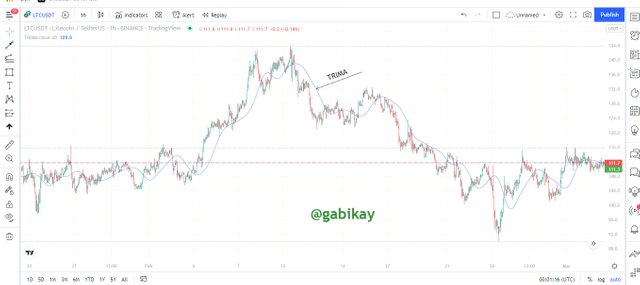
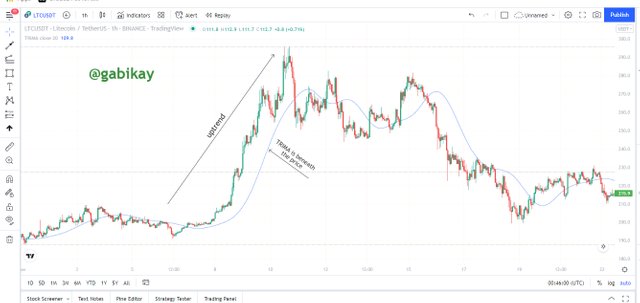
Uptrend condition of a TRIMA
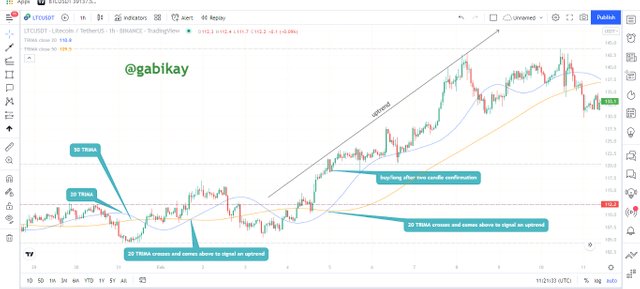
Usually, an uptrend is spotted when the price makes a series of higher highs and higher lows. When the TRIMA is applied to the chart, the start of an uptrend or an uptrend can be detected when the TRIMA curve is beneath the price with the price and the TRIMA curve intercepting each other. The chart below is an LTC/USDT pair which shows what happened when the TRIMA went beneath the price.
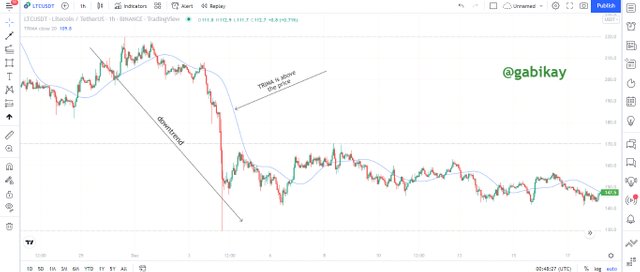
Downtrend condition of a TRIMA
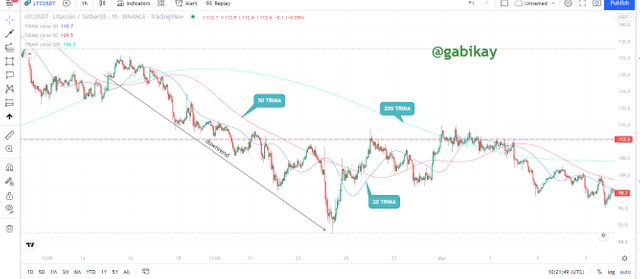
A Downtrend is characterized by the appearance of lower highs and lower lows in the market. When the TRIMA indicator is added to the chart, then we can get a downtrend signal when the TRIMA curve goes above the price. An example of shown in the LTC/USDT pair below.
4. With your knowledge of dynamic support and resistance, show TRIMA acting like one. And show TRIMA movement in a consolidating market. (Screenshots required).
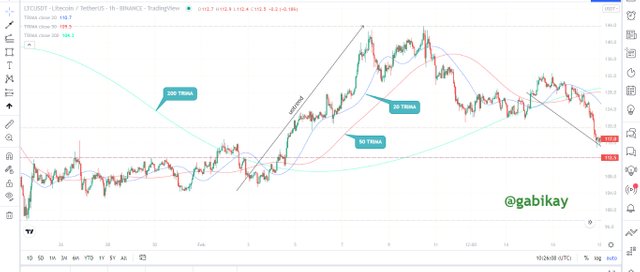
Dynamic S$R levels
The dybamic arwa of support and resistance is the band between the 20 and 50 TRIMA.This kind of support and resistance zone changes with a change in the curve of the applied moving average. I can also use the TRIMA since it is obtained from SMA. I will use 3 periods (20, 50, 200) of TRIMA to obtain the dynamic support and resistance area. The market is in a healthy trend if it touches the 20 period TRIMA. The market may take a break for another long run if it touches the 50 period TRIMA. The market may test it's most critical level or make a trend reversal when it hits the 200 TRIMA. It can be applied for both uprend or downtrend.
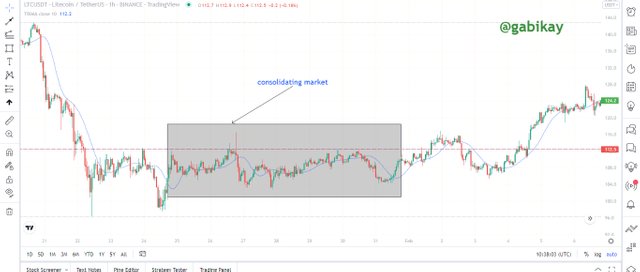
TRIMA movement In a consolidating Market
When the market is at a moment where it has no clear uptrend or downtrend move, then it is in a consolidation period or period of indecision. When the market experience a consolidation, it would be observed that the TRIMA would continue to swerve in and out of the candlestick untill when a clear trend comes.
5. Combine two TRIMAs and indicate how to identify buy/sell positions through crossovers. Note: Use another period combination other than the one used in the lecture, explain your choice of the period. (Screenshots required).
TRIMA crossover is a technique that can be employed to correct the laggy nature of TRIMA. When only one TRIMA is used, it delays to react to current market happenings like high volatility. This way, a trader would be late to a potential entry position.
The double TRIMA crossover entails that whenever the both TRIMAs cut across each other, then there is bound to be a change in trend. The
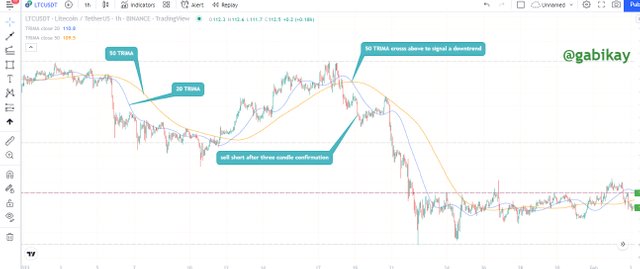
Buy Crossover
Let us use 20 and 50 period TRIMA. When the 20 period TRIMA crosses over the 50 period TRIMA, then an uptrend is underway. We could confirm the uptrend with atleast 2 candlesticks before entering a buy/long position.
Sell Crossover
Similarly using the 20 and 50 period TRIMA, when the 50 period TRIMA crosses over the 20 period TRIMA, then a downtrend is underway. It can be confirmed using atleast two candlesticks.
6. What are the conditions that must be satisfied to trade reversals using TRIMA combining RSI? Show the chart analysis. What other momentum indicators can be used to confirm TRIMA crossovers? Show examples on the chart. (Screenshots required).
Most indicators are not able to stand alone to be able to foretell future market price. TRIMA is an example and it's cross is not just enough confirmation and hence there is need to backup the crossover with another indicator. Here, I will backup TRIMA with the RSI indicator.
A reversal refers to the change in the market directions. It can occur both in an uptrend or downtrend. Considering an uptrend, it's reversal will be position towards the downside. Considering a downtrend, it's reversal will be positioned toward the upside. Being able to confirm a reversal is a boost to trader as he can leverage sch knowledge to open a position.
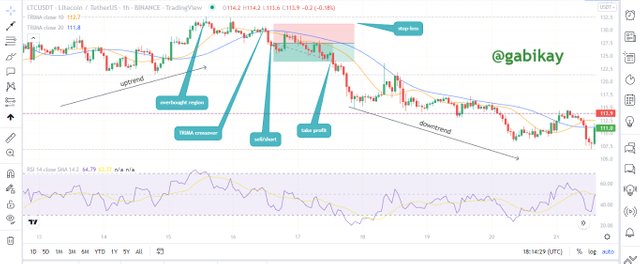
Criteria for Trading a Bearish Reversal Using TRIMA and RSI
- On the crypto chart, add the two TRIMAs of different periods (20 & 50) and then add the RSI indicator.
- If the market is in an uptrend or indecision, then watch out for where the RSI hit the overbought region.
- Wait while the longer period TRIMA (50) crosses over the shorter period TRIMA (20). For confirmation of trend reversal, observe atleast two candlesticks in the direction of the new trend (downtrend).*
*- open a sell position and then input a proper risk management strategy placing the Stop-loss slightly above the TRIMA cross.
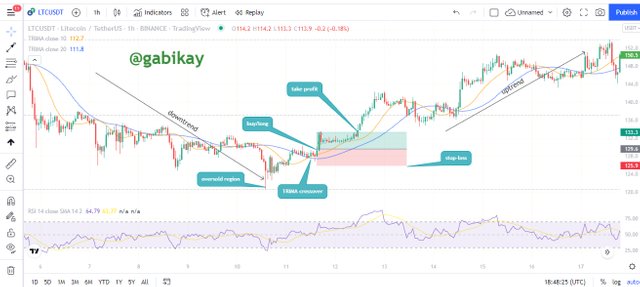
Criteria for trading a Bullish reversal using TRIMA and RSI
- On the crypto chart, add the two TRIMAs of different periods (20 & 50) and then add the RSI indicator.
- If the market is in an downtrend or indecision, then watch out for where the RSI hit the oversold region.
- Wait while the shorter period TRIMA (20) crosses over the longer period TRIMA (50). For confirmation of trend reversal, observe atleast two candlesticks in the direction of the new trend (uptrend).*
*- open a buy position and then input a proper risk management strategy placing the Stop-loss slightly below the TRIMA cross.
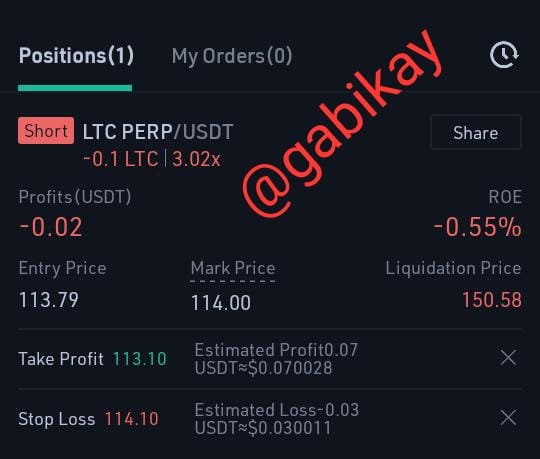
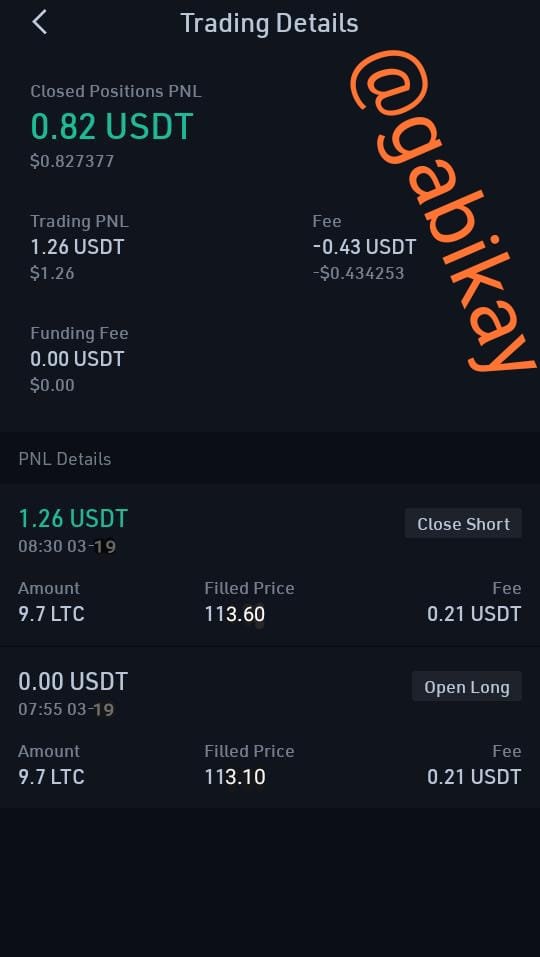
7. Place a Demo and Real trade using the TRIMA reversal trading strategy (combine RSI). Ideally, bullish and bearish reversals. Utilize lower time frames with proper risk management. (Screenshots required).
For this real trade excercise, I will use KUCOIN exchange and I will trade on LTC/USDT pair.
Firstly, I added the TRIMA and RSI indicators to the chart.
Next, I wait for a reversal and then spot out area of overbought region and the point of TRIMA crossover.
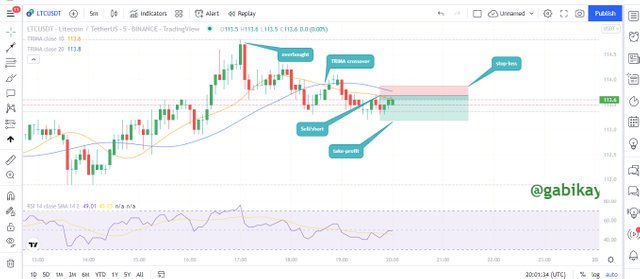
Next, I place a sell/short order and place my stop-loss slightly above the crossover
8. What are the advantages and disadvantages of TRIMA Indicator?
Advantages of TRIMA
Some Pros of TRIMA indicator include;
1. Slower to Respond
So, if your intention is to get into longer term trends, you might find a traditional moving average is a little too choppy or a little to quick to respond. If you use a moving average crossover, it might alert you a little but earlier than you want. You might want it to be even smoother or less volatile and now the obvious solution that should work fine for you is to employ the TRIMA. The TRIMA tends to extend the time and then smoothen the moving average.
2. Less Noisy With Smoothening Effect
Just as I had stayed in the beginning, TRIMA tends to smoothen by averaging the moving average. This means that the trader is not going to see if there is a price spike that is causing the SMA to spike. When the price comes back, then the trader didn't need to see that noisy spike that would have been spotted on the SMA because obviously it was smoothed out.
Disadvantages of TRIMA
Some short comings of TRIMA indicator include;
1. Slower to Respond
If it takes so long to respond, then it is going to be a seriously lagging indicator and it is going to cause the trader to be way behind the curve if he has a strategy that requires him to get on when things are happening quiçkly.
##Conclusion
Triangular Moving Average (TRIMA) is a kind of moving average indicator that smoothens the signal appearance even more by the use of an average's average. It makes for a clearer market understanding by eliminating the risk of getting trapped in a noisy and false signals.
Also, the TRIMA has its own inefficiencies as it is slow to react to current market happenings and can cause a trader to miss out an entry position especially at periods of high volatility.
Not withstanding, no perfect indicator exists anywhere as each indicator has its flaw or set back. It is advisable to combine not only the TRIMA buy also any other indicator with other indicators to obtain better results and also always employ proper risk management strategy.
Regards to @fredquantum