READING SPECIAL BAR COMBINATIONS | CRYPTO ACADEMY | S5W8| HOMEWORK POST FOR @sachin08
Good day steemians, today I will be posting my assignment on the topic 'Reading Special Bar Combinations' as taught by professor @sachin08.
~4.jpg)
IMAGE DESIGNED ON POSTERMYWALL.COM
Explain Price Bars in your own words. How to add these price bars on Chart with proper screenshots?
How to identify trends using Price Bars. Explain for both trend. (Screenshots required)
Explain the Bar Combinations for Spending the Day inside for both conditions. (Screenshots required)
Explain the Bar Combinations for Getting outside for the Day for both conditions. (Screenshots required)
Explain the Bar Combinations for Finding the close at the open for both conditions in each trend. (Screenshots required)
Conclusion

Price Bars are trading metrics that help a trader to read the market chart in order to take a trading decision base on the technical analysis reading of the various price Bars on the chart. A trader can use the price bar to ascertain the particular trend of a market. Looking at the image below we can see the four different parts that a price bar has.
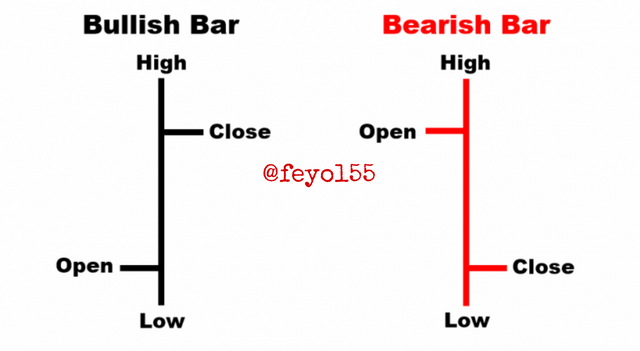
As seen in the image above, we have the bullish bar and bearish bar and the four components that make up these bars are :
- OPEN
- CLOSE
- LOW
- HIGH
OPEN - This is the horizontal line by the left of the bar which indicates the opening price of an asset.
CLOSE - This is the horizontal line by the right of the bar which indicates the closing price of an asset.
LOW - This is the bottom part of the bar that indicates the day - low price of the asset.
HIGH - This is the upper part of the bar that indicates the day - high price of the asset.
HOW TO ADD PRICE BARS ON THE TRADING CHART
I will be using the MT5 chart to add the price Bars.
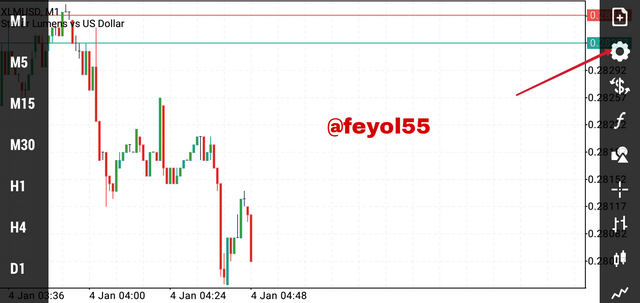
SCREENSHOT TAKEN ON MT5
I am going to click on that icon as seen in the image above.
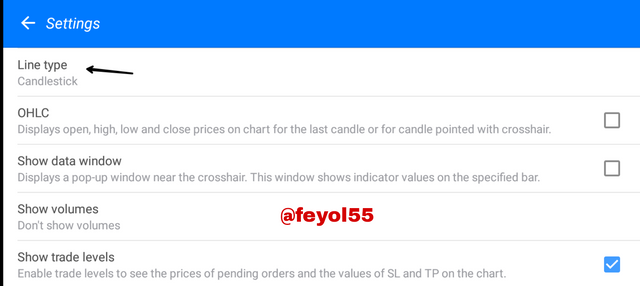
SCREENSHOT TAKEN ON MT5
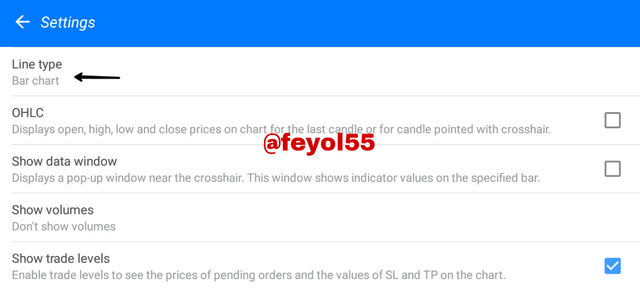
Then I'm going to click on 'Line Type' as seen in the image above.
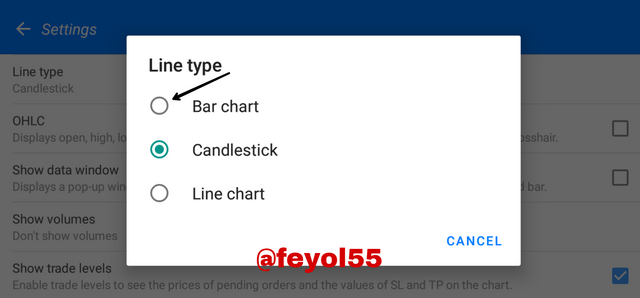
SCREENSHOT TAKEN ON MT5
Next, I'm going to click on Bar chart
SCREENSHOT TAKEN ON MT5
Now our 'Line Type' has been changed to 'Bar Chart', let's see how our trading chart will look like.
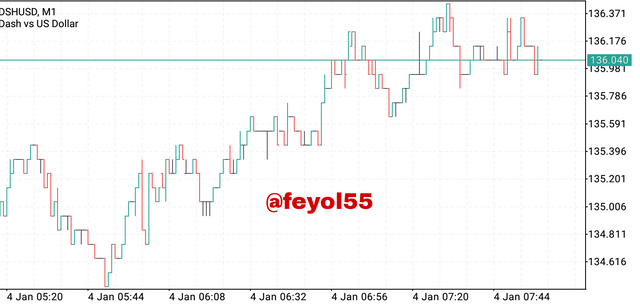
SCREENSHOT TAKEN ON MT5
From the image above, our chart has reflected the bar price chart.
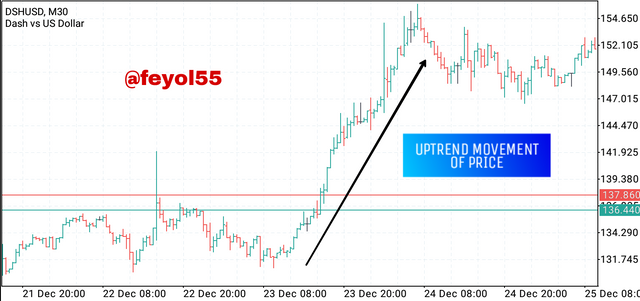
IDENTIFYING AN UPTREND
SCREENSHOT TAKEN ON MT5
One unique way to identify an uptrend is the formation of higher high and higher low in series though sometimes it could be interrupted by some lower highs. As seen in the above image, we could see the bars forming higher highs and higher lows on every day trading. The close of each day trading is higher than the previous day close. Also we can also see the close of the day higher than the open and low of the previous day. All these metrics points at an uptrend.
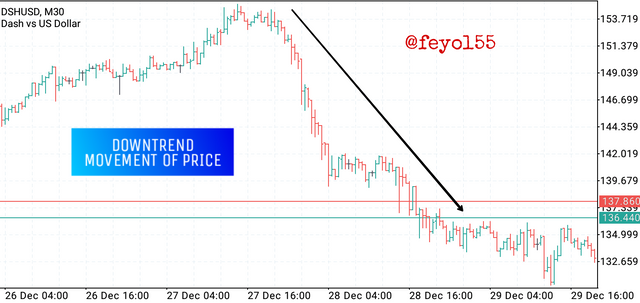
IDENTIFYING A DOWNTREND
SCREENSHOT TAKEN ON MT5
The downtrend can be identified by the formation of lower lows and lower highs which can be seen on the chart above. In addition a downtrend can also be characterized by the formation of series of consecutive down-day bars.
Also when we look at the image above, we will see that the bars have a close lower than the previous day close, this points at a downtrend formation. However, we should note that at some points the series of lower lows formed will be interrupted by some highs.
There are two major criteria we must take note of to get the bar combinations for spending the Day inside. They are :
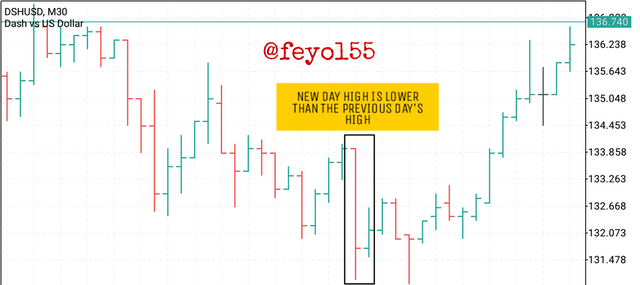
The new day High must be lower then the previous day's high.
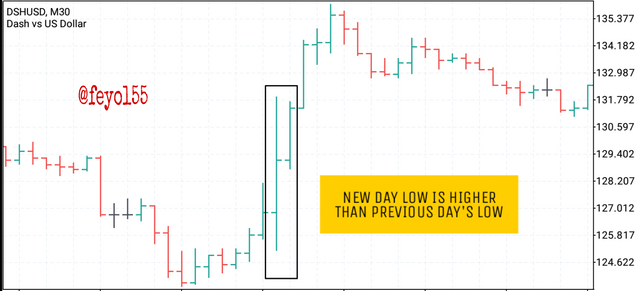
The new day Low must be higher than the previous day's low.
SCREENSHOT TAKEN ON MT5
SCREENSHOT TAKEN ON MT5
Looking at the images above, the pictures perfectly illustrates the two criteria mentioned above. We could see that the new day bar is inside the previous day's high-low bar range. One major indication of this bar formation is that both the buyers and sellers aren't sure about the next move, both parties are not wanting to buy more or sell respectively.
There are about two criterias for this which are :
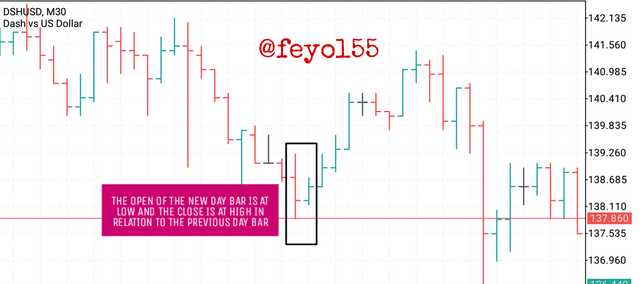
The open of the new day bar is at low and the close is at the high in relation to the previous day bar.
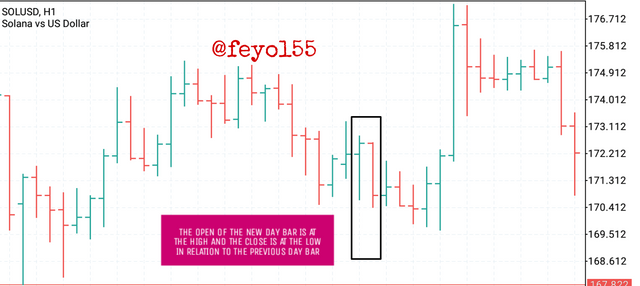
The open of the new day bar is at the high and the close is at the low in relation to the previous day bar.
SCREENSHOT TAKEN ON MT5
SCREENSHOT TAKEN ON MT5
Looking at the two images above, both perfectly illustrates the two conditions needed to observe the bar combinations for getting outside the day.
The number one condition indicates that the market is trending bullish with the formation of higher highs and higher lows. While the second condition indicates that the market is Trending bearish with the formation of Lower Lows and Higher Highs. This set up helps to basically confirm trend continuation.
Using this bar combination, we can actually determine if a price will continue with the dominant trend or reverse and expect a new trend. There are some things to watch out for so that we can be able to get this. I will be explaining this for both trends below.
UPTREND
For an uptrend movement of price, we need to look at the bars, the ticks specifically, if the open and close of this bars are near to the high, then we should expect a continuation in trend but if the ticks of open and close are near the low, then we are to expect a reverse in the uptrend direction.
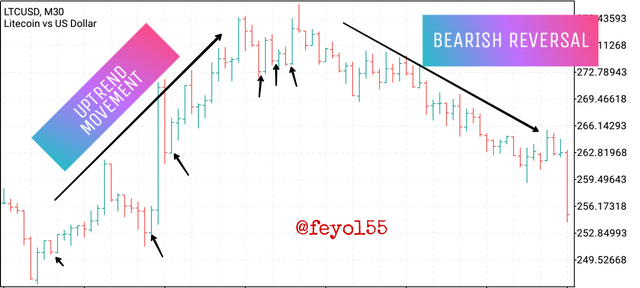
SCREENSHOT TAKEN ON MT5
Looking at the image above, we can see a perfect illustration of this, where the tick of the open and close were near the low which means price will reverse and we could see that price indeed reverse in the opposite direction.
DOWNTREND
For a downward movement of price, the reverse is the case, looking at the bars carefully, the ticks of the open and close are near the low, then we should expect a possible trend continuation but if the ticks of the open and close are near the high, then what we are to expect is a possible trend reversal in the opposite direction.
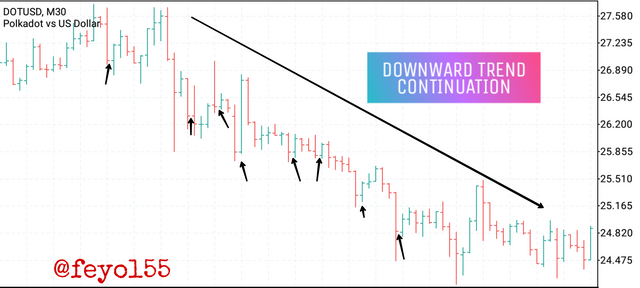
SCREENSHOT TAKEN ON MT5
The image above perfectly illustrate the explanation made, we could see the tick of the open and close was near the low which signals continuation of the trend and we saw that price kept going downward.
Reading the various Bar combination we have could be helpful for traders to make better trading decisions. Using this bar combination, we can predict if there will be a trend continuation or trend reversal, howbeit one needs to be careful to strictly follow the criteria and conditions needed to perfectly execute trades using this combination.
This course has been really helpful and I really find it quite interesting because I learnt a lot from it. Special thanks to my amiable professor @sachin08 for this wonderful piece.