[Psychology of Trends Cycle] - Crypto Academy / S6W4- Homework Post for @reminiscence01 by @farooq2923
Hello everyone. A very warm welcome in third week of 6th season. The professor @reminiscence01 has taught us Psychology of Trends Cycle. This is my homework task.png)
1. Explain your Understanding of the Dow Jones Theory. Do you think Dow Jones Theory is Important in technical analysis?
Dow Jones theory is very useful and well known theory in the crypto world. This was introduced in 1897 by Charles Dow. According to this theory, there are two trend in the market. Bearish or bullish. When the market is trending in upward direction while creating the higher high and high low, it indicate that there is the uptrend in the market. Uptrend also known as the bullish trend.
When the market is trending in downward direction while creating lower low and lower high, it indicate that there is bearish trend or downtrend in the market. The price is falling down and sellers are in control. This theory is known as the fundamental form of technical analysis which help the traders to identify trend and market structure. The strength of the movement of coin can also be determine using this theory. This theory define that the market basically have three type of trend
- Primary trend
- Secondary Trend
- Minor Trend
The primary trend are those which remain for months to year. The trend which continue in the market for multiple months and even year, this type of trend is known as the primary trend. The type of trend which remain from weeks to month is known as the secondary trend. The duration of secondary trend is from weeks to month. The third one is the minor trend. These are those trend whose continuity is from days to weeks. They end within few days.
This is very useful theory which provide the fundamental form of the technical analysis. This help us to identify the market trend. One can identify the type of trend either it is primary , secondary or minor trend. Without this theory, it will be hard to identify the market trend or predict the future direction.
This help us to predict the future trend in easy way. This indicator helps the traders to identify market trend on basis of supply and demand. When supply high, demand will be low and coin will move from top to down. When the demand get high, the supply will be low and price will move from down to top. This helps them in technical analysis. The traders get to know about the direction of coin, market trend and can also measure the volume of assets.
2. In your own words, explain the psychology behind the Accumulation and Distribution phases of the market. (Screenshots required).
The market basically have two trend, uptrend and downtrend. When the price move from down to top while creating the higher high, it indicate that there is uptrend. When the coin move from top to down, it indicate that there is bearish trend.
But when at the end of bearish trend, the coin keep moving in a ranging zone, the seller close the sell orders and coin now do not move in any particular direction, the market is said to be in accumulation phase. The coin keep moving within a zone. Then the buyers enter with high pressure and pull the price upward direction. Similarly, when while price reach to uptrend, the price start moving in a ranging zone with out moving in a particular direction. There is no clear trend at that time. The buyers close the buy position. Then price remain in that zone until the sellers start selling coin with high velocity. That ranging zone period is known as the distribution phase.
Accumulation Zones
The market basically have two trend which occur in the market because of the accumulation and distribution phase. The accumulation phase occur at the end of the downtrend. This phase show the war between the buyers and sellers. There is no clear trend and coin keep moving in the ranging zone.
When coin is trending downward, there will be some lower lows and lower highs. While trending in a particular direction, the volume will also be high. This happen because of high selling pressure. Then coin will be underpriced and the seller will close the sell positions. The market is in accumulation phase when the price of coin is low after a long bearish trend. After a long downtrend, there is pause in price at very bottom level where price is very low. This is the accumulation phase where the volume is quote low.
The price remain in this position for some time. The big hands now start opening the buy orders to push market a bit upward and create the buy opportunity. This will produce the trend reversal signals. The small traders will buy the coins expecting the coin will rise up. The demand will increase and supply will start decrease. In the result, the coin will reach to the high level.
.png)
Distribution Phase
The distribution phase occur at the end of the uptrend. This phase show the war between the buyers and sellers. There is no clear trend and coin keep moving in the ranging zone. When coin is trending upward, there will be some higher high and high low. While trending in a particular direction, the volume will also be high. This happen because of high buying pressure. Then coin will be over priced and the buyers will close the buy positions.
The market is in distribution phase when the price of coin is high after a long bullish trend. After a long uptrend, there is pause in price at very top level where price is very high. This is the distribution phase where the volume is quote low. The price remain in this position for some time. The distribution phase occur after a long bullish trend. In the distribution phase price take a pause. This is the best spot to sell the coins. When the coin is in distribution phase, volume is low because of having the selling interest.
When the people start selling the coin, the volume get high. The big hands now start opening the sell orders to push market a bit downward and create the sell opportunity. This will produce the trend reversal signals. The small traders will will also sell the coins . The demand will decrease and supply will start increase. In the result, the coin start declining.
.png)
3. Explain the 3 phases of the market and how they can be identified on the chart.
Bullish Phase
When the market in the bearish trend, the price is low and the traders invest into the market, They find it a good spot to enter into the market. Because of high buying ratio, the supply ratio get decrease and price of the coin start rising. The market then begin to move in upward direction and bullish season occur.
The upward movement of the market is known as the bullish trend. On the chart, the candle upward movement show the market bullish trend. The bullish trend is the best spot to exit into the market because the price is high here and chances of getting profit are also high. The people sell the coin at high price and earn high profit.
.png)
The above graph show that the market is in uptrend or bullish trend. The green candles represent the high buying ratio. Because of high buying ratio, the supply get decrease, the price and demand get increase and market start moving toward the bullish season
Bearish Phase
When the market in the bullish trend, the price get high and the traders sell their assets. They earn the good reward in bullish trend. Because of high selling ratio, the supply ratio get increase and price of the coin start falling. The market then begin to move in downward direction and bearish season occur.
The downward movement of the market is known as the bearish trend. On the chart, the candle downward movement show the market bearish trend. The bearish trend is the best spot to enter into the market. The people buy the coin at low price and hold it until it get rise.
.png)
The above graph show that the market is in downtrend or bearish trend. The red candles represent the high selling ratio. Because of high selling ratio, the supply get increase, the price and demand get decrease and market start moving downward
Sideway Market
There is another type of market which is known as the sideway market. This type of market have no particular direction but the coin move in ranging zone. Instead of moving upward or downward, the coin keep moving in a specific zone. The coin move between the resistance and support level. This phase show the struggle between buyers and sellers. When the buyers push price up, the price touch the resistance, the sellers bounce back the price downward and again it hit the support level. Support level stop price to decrease more. The resistance level stop price to increase more. So price remain in a sideway zone. This continue until the price break the support/ resistance level and start moving in a particular direction.
.png)
In the above screen short, we can see that the coin was rising up. There was uptrend where the coin was moving in upward direction while forming higher high and high low. Then coin started moving between support and resistance. There was no particular direction. Price was not moving in a specific direction. It was the sideway market.
How to Identify Phases in Market
There are a lot of methods and tools to identify the market phase There are a lot of technical tools to helps the traders to identify whether market ins in uptrend phase, downtrend phase or sideway market. The traders can use the market structure, charts, indicators tools to identify the market phase. All are really helpful but the chart is more useful. While having look on chart, one can determine the direction and phase of the market.
4. Explain the importance of the Volume indicator. How does volume confirm a trend? Do this for the 3 phases of the market (Screenshots required)
Volume Indicator
The volume is key component in the trading market on which, every trader should have focus because it is connected directly to the price of coin. When the price get change, volume get increase. The volume measure the volatility of the price of coin. It help to identify how volatile the coin is. The volume is very small in accumulation and distribution phase but while trending upward or downward and forming the higher highs and lower lows, the volume is high. While at time of retracement, volume is low.
The volume is shown to us in form of small candles with small bodies at bottom of the chart. When the candles are small, it mean that there is low volume. When the body of the candles get large, this imply that there is high volume.
In the bearish trend, when the coin move in impulsive way like in direction of trend, the volume is high. The volume indicator will show the high red color lines indicating the buying pressure is high. But when the retracement will occur, the volume will get low.
.png)
In the above screen short, we can see that the coin is trending downward. The coin formed the lower low where each low was lower than previous low. the lower low moves where the impulsive moves. When the coin raise a little bit to form the low high, the retracement move occur. These are the retracement moves when the coin move in opposite to the direction of coin. While the impulsive moves, the volume indicator show high volume. While creating the low high or retracement, the volume show low volume.
Bullish Trend
In the bullish trend, when the coin move in impulsive way like in direction of trend, the volume is high. The volume indicator will show the high green color lines indicating the selling pressure is high. But when the retracement will occur, the volume will get low.
.png)
In the above screen short, we can see that the coin is trending upward. The coin formed the higher high where each high was high than previous high. the higher high moves where the impulsive moves. When the coin decline a little bit to form the high low, the retracement move occur. These are the retracement moves when the coin move in opposite to the direction of coin. While the impulsive moves, the volume indicator show high volume. While creating the low high or retracement, the volume show low volume.
5. Explain the trade criteria for the three phases of the market. (show screenshots)
Bullish Trend
There are some points to consider for trading in bullish trend
There should be the uptrend in the market. Market must be moving in upward direction and direction of price should be from down to top.
The coin should make the higher high and higher low where each high will be higher than previous high.
During impulsive moves, the volume should be high. During retracement, volume should be low.
When the coin declined in retracement and form the high low, wait for the price to start rising again. When the coin show three to four bullish candles on the chart, place the buy order.
Place the stop lose and take profit with ratio 1:2 or 1:3.
.png)
Bearish Trend
There are some points to consider for trading in bearish trend
There should be the downtrend in the market. Market must be moving in downward direction and direction of price should be from top to down .
The coin should make the lower low and lower high where each low is lower than previous low
During impulsive moves, the volume should be high. During retracement, volume should be low.
When the coin raised in retracement and form the low high, .lace the buy order.
Place the stop lose and take profit with ratio 1:2 or 1:3.
.png)
Sideway Market
It is very difficult to decide the trading actions in the sideway market. In sideway market, there is no particular direction of coin so the direction of coin and trend cannot be decided. The traders cannot take the long term trading decision at the ranging market.
To buy the coin in the ranging market, the trader should wait for the price to hit the support level. When the price touch the support level, wait for the coin to start rising. When 2,3 bullish candles formed, place the buy order. This is best point to exit from the market.
.png)
To sell the coin in the ranging market, the trader should wait for the price to hit the resistance level. When the price touch the resistance level, wait for the coin to start turn downward. At this point, traders should place place the buy order. This is best point to enter into the market.
.png)
6. With the Trade criteria discussed in the previous question, open a demo trade for both Buy/ Sell positions.
Buy Trade
The below is the chart where coin was rising up. There was the uptrend in the market. Market was moving in upward direction and direction of price was from down to top. The coin was make the higher high and higher low where each high will be higher than previous high. During impulsive moves, the volume should be high. During retracement, volume should be low.
.png)
When the coin declined in retracement and form the high low, i waited for the price to start rising again. When the coin show three to four bullish candles on the chart, place the buy order. Place the stop lose and take profit with ratio 1:2 .
.jpeg)
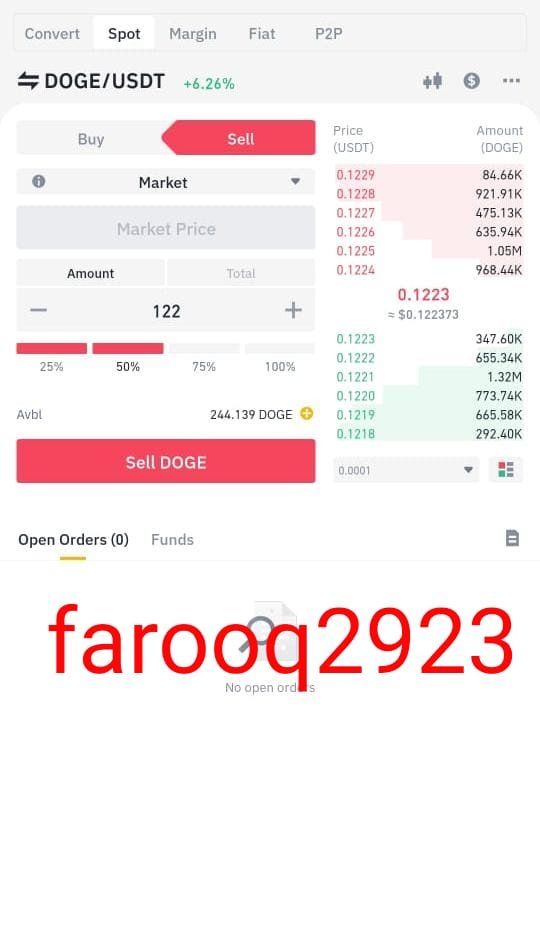
Sell Order
The below is the chart where coin was declining. There was the downtrend in the market. Market was moving in downward direction and direction of price was from top to down. The coin was make the lower low and lower high where each low was lower than previous low. During impulsive moves, the volume should be high. During retracement, volume should be low.
When the coin raised in retracement and form the low high, i waited for the price to start turn downward again. When coin took the turn to downward, i Placed the stop lose and take profit with ratio 1:3. and execute the order.
.png)
Conclusion
Trend identification is very important in trading world. A trader who do not have any knowledge about the market trend or who do not identify the trend before taking any trading decision, cannot trade successfully. The trend identification is most essential component of profitable trading. There are multiple tools to identify the trend. The Dow Jones theory also help the traders to identify the market direction. This theory helps the trader to measure the volume and mean of high and low at particular time period.
This theory is very important and useful in trading world. While using this technique, one can identify the trend and thus can enter and exit at the best trading spots.