Technical Analysis Strategies for Crypto Trading

Hi, How are you all, this is me your very own Faran Nabeel, It is amazing for me to share my knowledge and my personal strategy with everyone and I will try that I could explain everything perfectly with you. So I apply many strategies chart and I tried to cover all the concepts on a single chart like STEEM/USDT. It is really interesting challenge for me because it's hard but every thing is possible in the world.
Question 1: Foundations of Technical Analysis
There are many principals to find the market structure, direction of market and we can predict the next movement of market according to the previous chart data using charting tools like support & Resistance, Trendlines and Chart Patterns.
There are many ways to find the trend of the market such as find Swing Highs and Swings lows, Higher Highs and Higher Lows and it's respective for downtrend, but the trendlines is more effective because it's also works as a support and Resistance.
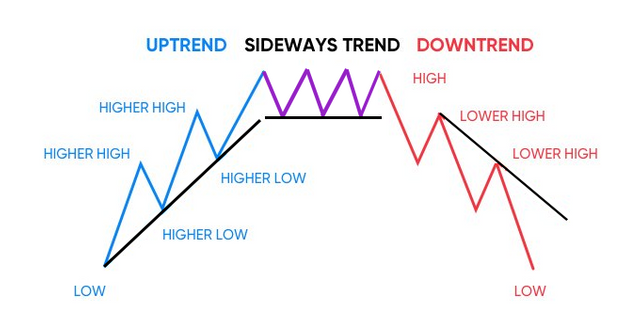
There are three types of trends in the market, Here's bellow:
- Uptrend
- Downtrend
- Sideways Trend
and the other one is the choppy market and it is suggestion to avoid this type of market. and I do like to describe with General approach and real time example with STEEM/USDT Chart.
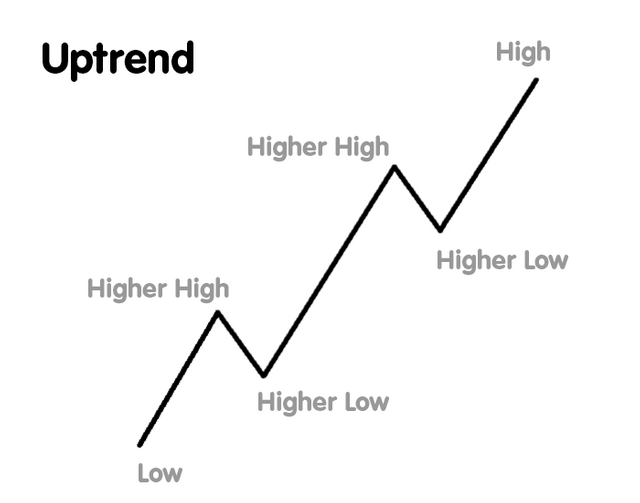
General Approach: This picture show the upward that go higher each time. Each new high is higher than the previous, and each new low is higher. This given pattern mean the price is rise and the market is growing. We can find the trend with the trendline.
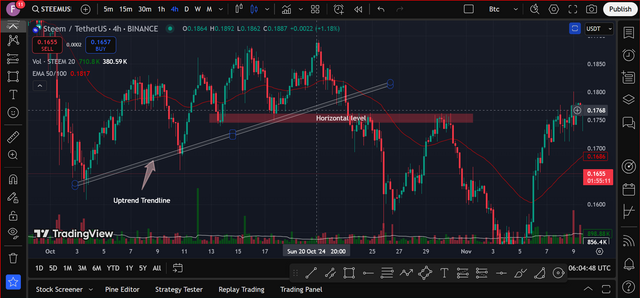
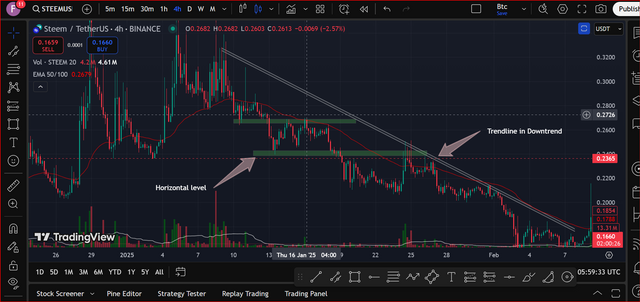
Example: The chart show the STEEM/USDT trading pair on four hours timeframe. The price moved up with uptrend trendline. The red box is the horizontal level that can act as support and resistance. The price fell quickly when it's break the trendline. When price respect the trendline it goes higher. They help visualize market trends and possible turning points.
Another example with the touches, The trendline has the three points where price touch and bounces up (mark as 1st, 2nd, and 3rd touch). When the price respect the trendline, it means the market is still bullish at that time. the valid trend must have three touches and when it's appeared at the third time at the trendline it is shows a strong trend indication.
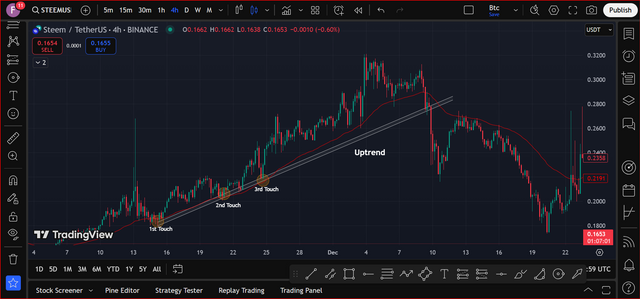
We can see when price appear third time at trendline, it's boom and goes higher. By practicing we can find the uptrend using draw a trendline.
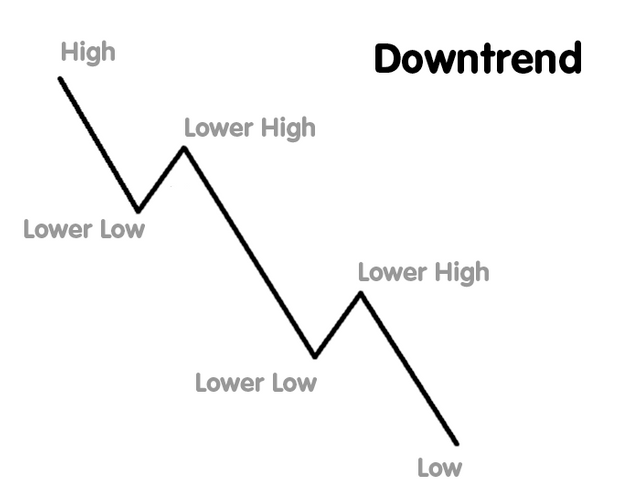
General Approach: This given picture show the downtrend that goes lower with each time. Each new low is become lower than the previous one, and each new high is also lower than the previous. This pattern shows the price is dropping and the market is weak. We can find the down trend with the trendline.
Example: This chart shows the downtrend, with trendline. The price move below the trendline, indicate the bearish environment. The horizontal green boxes in the chart highlight potential support or resistance level.
I watch these levels to see if price will continue falling or break level, helping to confirm the price direction.
General Approach: It shows three price movements: an uptrend, a sideways trend, and a downtrend. In the sideways trend, the price moves between highs and lows or in the tight range. And it can be moved both side if market moving in tight range.
Example: The price has remain within the horizontal channel over several days, as it is live. suggest the sideways trend without clear the bullish or bearish momentum. It is indicating the buyer and seller are balanced.
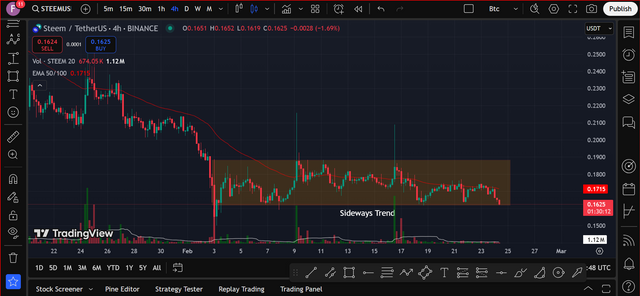
In the sideways market, price fluctuation are confine between establish support and resistance levels, as shows by the channel boundaries in the chart. In this situation, Traders wait for the breakout above the resistance and below support to confirm a strong major shifting in the trend.
Support is the price area where buyers usually are become in strength, stop further dropping the prices. Resistance is a level area where sellers become more active and strong, stop price from rising. We can watch this levels closely to identify potential reversal points and profitable opportunities.
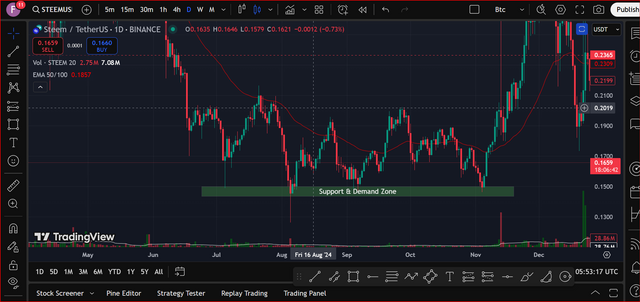
On the daily STEEM/USDT chart, there is the green box which shows the support and demand zone, indicate where buyers often enter. Price bounced up around this zone, suggest the strong demand.
As In the chart, there is the support zone where price come and then bounce back with quick momentum and show bullish area zone where buyers are active and ready to push the price up.
In the chart, a red zone highlight resistance and supply zone area. Where price make struggle to break above that area, it is also indicate the strong seller interest. it shows the confirmation that sellers remain active. A breakout can provide signal of bullish momentum.
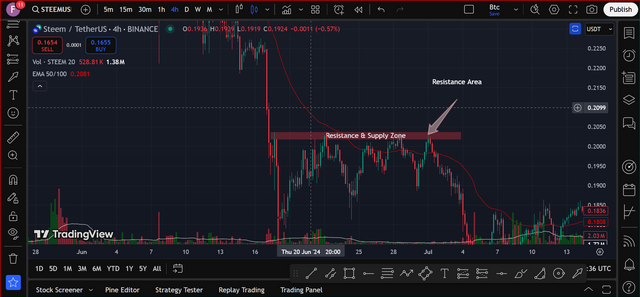
In the resistance phenomenon, it is the level where price come and then dropping with sharp momentum and it is the area zone where sellers are active and ready to push the price down.
There is anther approach in which zone behave like both "Resistance becomes Support" and "Support becomes Resistance". It is the zone which act as a retest mechanism. Here is the example:
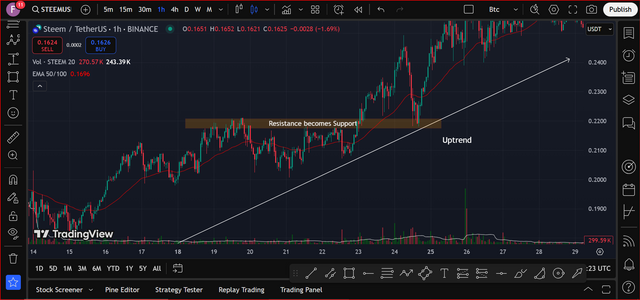
in this chart, we can see there is the clear uptrend and wee see the resistance act as a support after breakout when price try to retest this level. We can find the good trade opportunity using this method.
Chart patterns are form by price movements on a trading chart in every market. They help us to predict the future price direction. Common patterns include head and shoulder, triangles, and double tops and bottoms. By using this shapes, we can decide when to enter and exit trades and manage their risk. Chart patterns repeated with the time.
In this chart, The price formed a double bottom at the certain level, then moved up to the line as know the “neckline.” After breaking above the neckline, User can enter in the trade and the price can also retest it and continue higher toward a target. The target can be estimated by measure the distance from bottom to neckline and project it above the neckline.
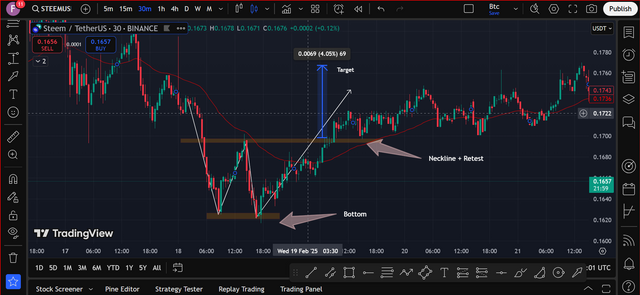
This pattern suggest the possible reversal from the previous downtrend, it giving a signal to enter the long position. If price stay above the neckline of the double bottom, it confirm the bullish momentum towards the target.
In this below chart, The price forms the symmetrical triangle, with two trendline with converging. The price broke above the upper line, suggest a bullish move. We often see the breakout from symmetrical triangle as sign of momentum, looking for continue the upward movement and price stays above the broken trendline.
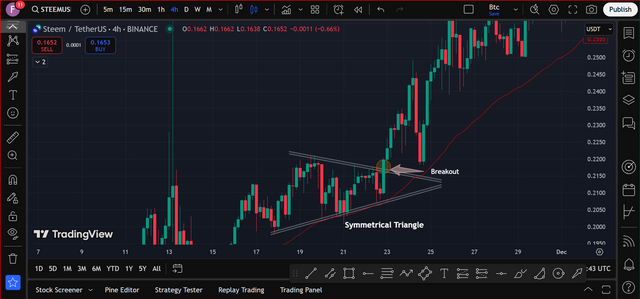
This chart shows same symmetrical triangle breakout. I highlight the price also retest the breakout line, then continue moving to higher high, suggest the bullish momentum overall.
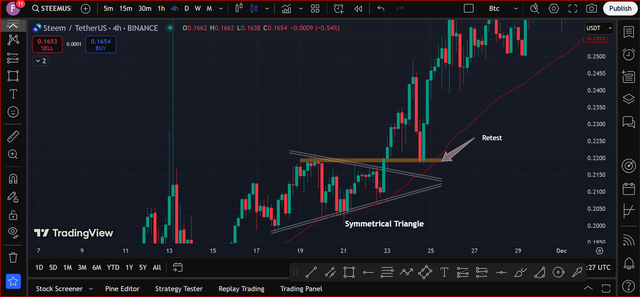
Retest is the best way to enter in the profitable trade and it is the strong confirmation of valid pattern formation.
Question 2: Applying Indicators for Decision-Making
Applying different indicators provide help to make better decisions by analyze price movements and trends in the chart. Indicators like moving average show to trend direction, while RSI help to identify overbought or oversold area. Using multiple indicator together to improve the accuracy and reduces risks.
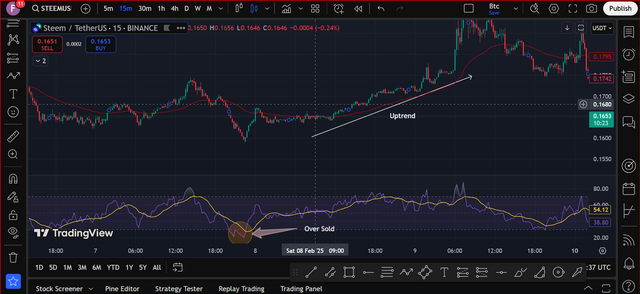
RSI measure price strength on the scale from 0 to 100. Above 70 shows overbought, below 30 mean oversold. It helps traders to find buy or sell signals.
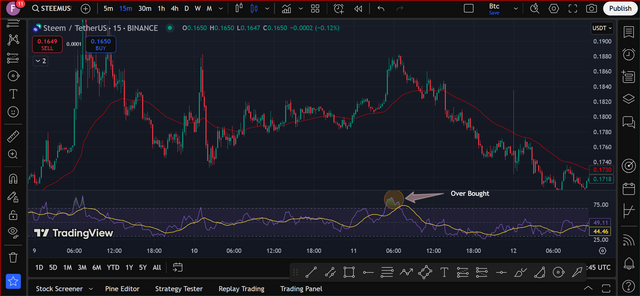
This chart show STEEM/USDT the RSI on the 15-minute timeframe. The RSI indicator have "Overbought" and "Oversold" mechanism. The mark area show the "Overbought," meaning the RSI price above to 70. This suggest the price can drop soon. And we can see that after breaking the 70 level again, it's shows it drop quickly.
I personally use only two strategies in RSI indicator to decide my trade plan. which is oversold and overbought.
As we know, the Exponential Moving Average also knows as "EMA" is the line on the chart that show average price over the time. It react the quick into price changes, helping us spot trends and make better decisions.
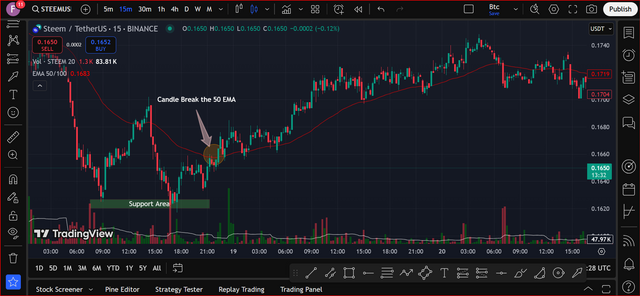
In the upper chart show the with 50-period Exponential Moving Average. The price was also in the support area which shows the price will reverse, then it broke above the 50 EMA, I personally use only 50 EMA. And the breakout signals the possible uptrend, means the price can continue rising as the buyers gain the strength.
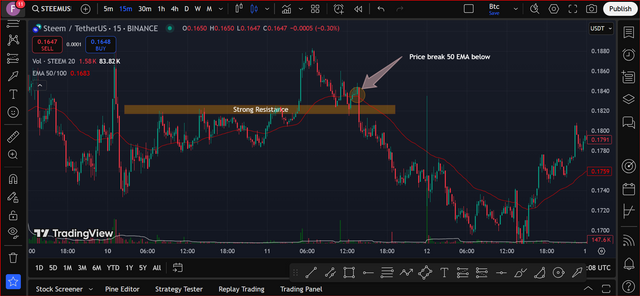
Above chart shows the price of STEEM/USDT with the 50-period Exponential Moving Average, in which the price face strong resistance and then brake below at the 50 EMA. This signals is a possible downtrend, meaning sellers are taking control to steem. After breaking the EMA, the price started falling, that is the confirm bearish momentum. We might see this signal as a selling opportunity, expecting with the lower prices. The resistance zone acted as barrier, preventing the further upward movement. This breakdown suggests the weakness in market and leading to a decline.
Question 3: Utilizing Chart Patterns
Chart patterns play the important role in technical analysis in trading, helping us to identify the potential market trends and reversal patterns. Here is how common patterns influence the trading strategies:
The price form the ABCD pattern and, This chart have Fibonacci retracement to identify the “Golden Pocket”. Price move sharply, then test that zone. After retesting it, the down move was confirmed, suggest the bearish momentum. The target should be next fibbonnaci ratios.
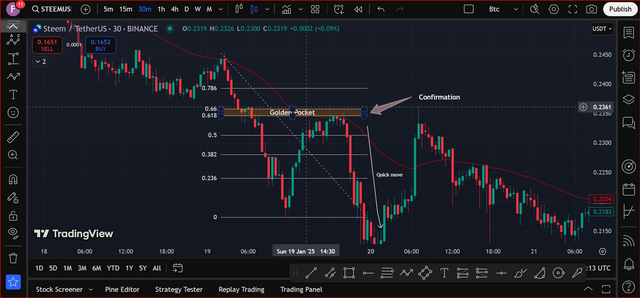
It is the good chart pattern to earn the handsome profit.
This charting pair with a falling wedge pattern. The price move within two downward sloping lines at the chart, narrows over the time. Price brake above the wedge upper trendline, then retested this, show signal possible to bullish momentum.
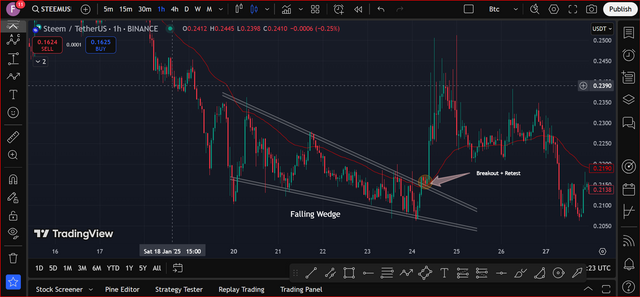
We should always remember that a confirm breakout from the wedges, along with the healthy volume, can strong the bullish signal.
Question 4: Developing a Technical Strategy
For trade in STEEM/USDT, a strategy which I used in this, EMA (50), RSI, volume, and support/resistance levels and major trend is important to adapts the different market conditions. In the breakouts phenomenon, I entered when price break the resistance with high volume and EMA confirms an uptrend. In consolidation phase, I trade within the support and resistance zones. For reversals, I looks for patterns like double tops and other reversal patterns, confirmed by RSI divergence.
This strategy is used for Intra day trading and I personally use for couple of months and earn handsome profit. It is start from 4 hours timeframe or 1 hour. Check the over all structure and trend of the coin.
Step #01:
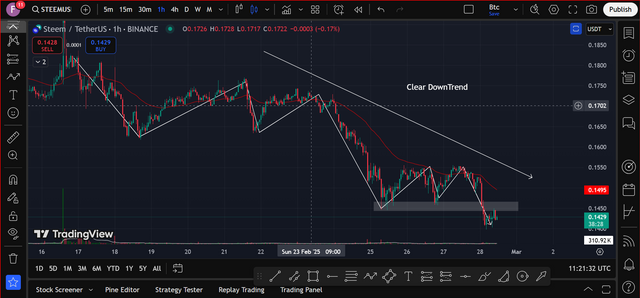
The STEEM/USDT chart show the clear downtrend, with making lower highs and lower lows forming as we can see. The price of steem is also moving below the 50 EMA, confirm the bearish trend in the chart. A support zone is occurs, but sellers remains strong. The market may continue downward in the chart unless buyer push above resistance. So it is clear the downtrend is running.
Step #02:
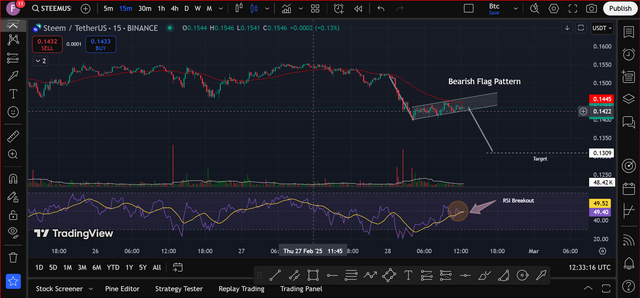
After shifting to lower timeframe, We will search the chart pattern. And i find out a bearish flag pattern, which usually indicate the price might fall after breakdown the horizontal channel. The breakout of RSI suggest the temporary buying strength, but the overall trend is still the bearish. If the price of steem drop below the support, it could reach 0.1309. We are watching for a breakdown to confirm further price movement in the downwards.
Question 5: Lessons from Real-Life Scenarios
According to my point of view, A real-life example of technical analysis help many traders to succeed in the recent Bitcoin bull run. Many trader use moving average, RSI indicator, and trend lines to ride the trend of the market and make profits.
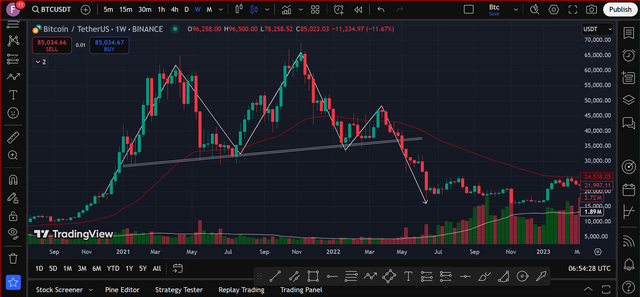
On the other side, ignore the technical signal can lead to failure. For example, in May 2021, Bitcoin form the head and shoulders pattern, which is a bearish sign. Many traders ignore this and keep their positions, believe the price would rise again. Bitcoin crashing from $60,000 to $21,000, cause of heavy losses.
There is a few key lessons for Key lessons:
- Follow trends: Use moving averages provide help to traders enter and exit at right time.
- Respect warning signals: RSI and chart patterns can warned you about trend reversals.
- Risk management is key: Set up the stop-loss can reduce huge loss.
By learn from real life experiences, Everyone can improve their strategies, and make profitable decisions using technical analysis.
Now i invite my friends @suboohi, @artist1111, @uzma4882, @chant, @adeljose, @wilmer1988 @josepha and @sameer07 for participating in this contest.
Regards,
Faran Nabeel
Cc : @kouba01

Upvoted! Thank you for supporting witness @jswit.