Support and Resistance Breakouts - Crypto Academy / S6W3 - Homework post for pelon53

Hi everyone! This time I want to try to participate in homework given by professor @pelon53 from the Steemit Crypto Academy community. The professor gave several questions related to Support and Resistance Breakouts.

Question 1
Explain in detail the advantages of locating support and resistance on a chart before trading
There are things we must know when trading in the crypto market, what I mean is that we must first know the support zone and resistance zone of the moving candlestick. By knowing these two things, traders will be more flexible in predicting price movements that are happening in the market.
The Resistance Zone is a zone where the highest price has been reached by a price in the market and usually the price tends to rebound downwards after the price has touched this zone, is because in that zone the market is in an overbought phase, and in this zone usually the traders who have previously bought cryptocurrencies will sell them.
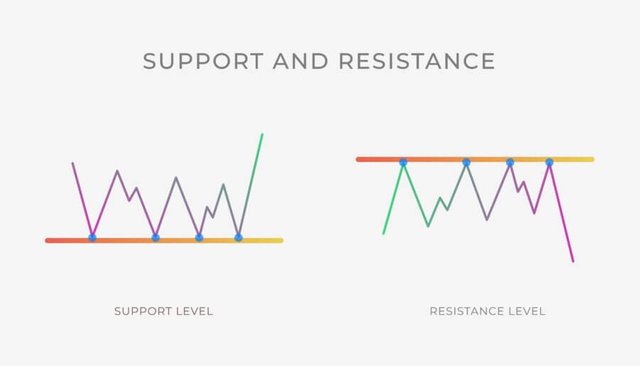
While the Support Zone is a zone where the lowest price has been reached by a price in the market and usually prices tend to rebound upwards after the price has touched this zone, this is because in that zone the market has entered the oversold phase and in this zone, it is usually traders who will buy cryptocurrency at the most ideal price.
The two zones that I have described just now are zones created by drawing a trend line on the chart, after we know the two zones, we will get some advantages, we can see these advantages in the table below.
| By determining the Support and Resistance Zones, traders will be able to determine the most ideal Stop Loss Level and Take Profit Level when they have started to enter a trade. | |
| Support and Resistance zones can also be used to determine the trend reversal that is happening in the market. Zoan Support can be used if the trend changes from Bearish to Bullish and Resistance Zone vice versa. | |
| By determining the Support Zone and Resistance Zone will help traders to identify swing points that exist in the market. | |
| Determination of the direction of the trend can also be planned with the help of the Support Zone and Resistance Zone. Because traders will be able to see the movement of the market trend when the candlestick touches or breaks these zones. | |
| By identifying the Support Zone and Resistance Zone, traders will be able to combine them with indicators in terms of confirming the signals given by these indicators. |
Question 2
Explain in your own words the breakout of support and resistance, show screenshots for the breakout of resistance, use another indicator as a filter
All crypto assets always move quickly in a relatively short time, therefore very often the movement of the price of a cryptocurrency experiences a break with the Resistance Zone or Support Zone, this situation is called Breakout.
As we know that these two zones are a barrier to the movement of a cryptocurrency, where the Resistance Zone acts as a barrier to price increases and the Support Zone acts as a barrier to price declines. But this is not absolute because the price of a cryptocurrency will definitely reach a point where it will break through these boundaries and start heading towards a new trend according to market conditions at that time.
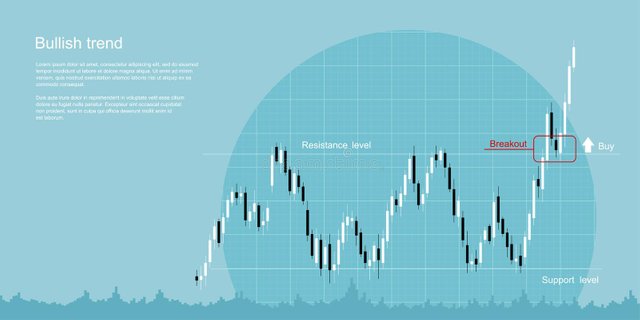
Breakout Resistance occurs when the price of a crypto asset increases and breaks through the Resistance Zone, while a support breakout occurs the other way around when the price decreases until it break through the Support Zone until it finally moves below that zone.
A breakout with one of these zones indicates the possibility of a trend change. If a breakout with the Resistance Zone will indicate that the price will start a Bullish trend, a breakout with the Support Zone can indicate that the trend is going towards a Bearish Trend.
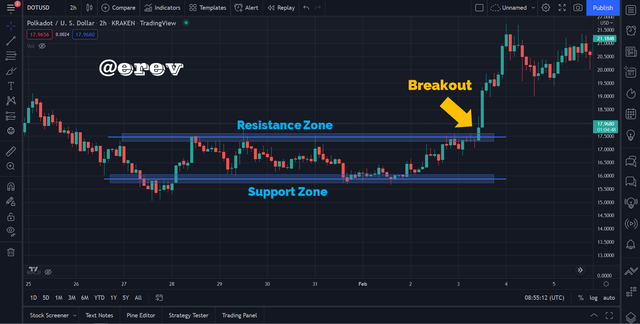
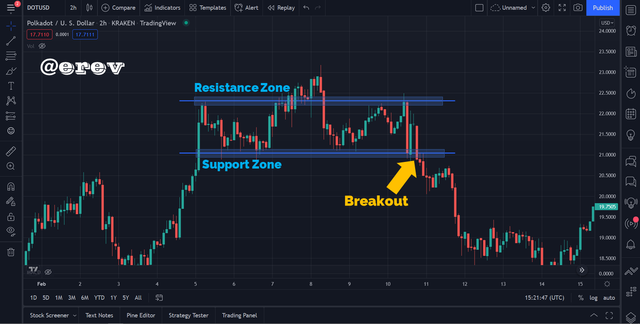
Now let's look at one example of a breakout of the Resistance Zone that occurs in a cryptocurrency market. We can see in the picture below that the DOT/USD market price is between the Support and Resistance Zones, then the price starts to increase until it finally breaks through the Resistance Zone.
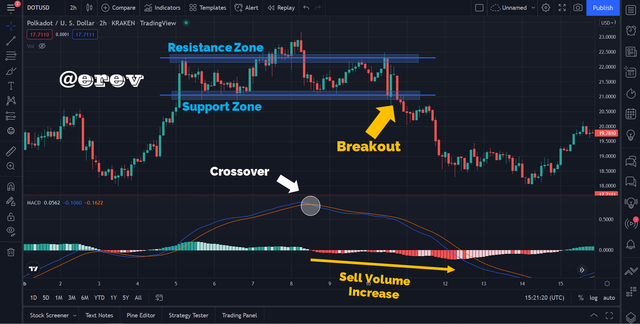
Then, we can use the MACD indicator to filter out the Breakout signal. And from the picture below the MACD indicator confirm the Breakout signal where there is a crossover between the 2 EMA lines on the MACD indicator and the trading volume of buyers has increased.
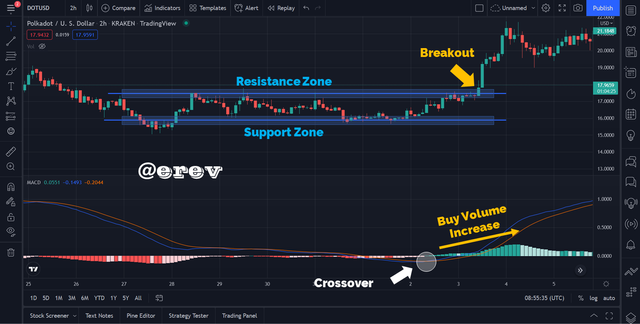
We can see that the breakout momentum that occurs in a market can be confirmed by using auxiliary indicators. This is to reduce the possibility of false signals that may be given by candlesticks.
Question 3
Show and explain support breakout, use additional indicator as filter, show screenshots
In contrast to the breakout of the Resistance Zone that we discussed earlier, the Support Zone Breakout is a phenomenon that will give us a signal that the trend will become a bearish trend and the price will decline in the near future, knowing this can give traders a signal to start selling the cryptocurrencies they had already bought.
Now for another example, let's look at an example of a Support Zone breakout occurring in a cryptocurrency market. We can see in the picture below that the DOT/USD market price was between the Support and Resistance Zones, then the price started to decline until it finally broke through the Support Zone.
Then, I also use the MACD indicator to filter out the Breakout signal. And from the picture below the MACD indicator confirms the Breakout signal where there is a crossover between the 2 EMA lines on the MACD indicator. Then there was an increase in trading volume, but the ones who dominated the market at that time were buyers so the bar chart tends to be red.
By looking at these two things we can conclude that the market is indeed volatile and prices will experience a deep decline.
Question 4
Explain what a false breakout is and how to avoid trading at that time. Show screenshots.
Not always the signal given by the breakout moment is a definite signal, there are lots of incidents where traders fall into the False Breakout trap. False Breakout is a condition where a candlestick that previously had a breakout with one of the zones then reversed back to enter the level between the two zones.
After the previous example, we saw a breakout moment, but that is not a certainty, because there will be a moment where the price has broken out in a certain area but does not seem to meet market expectations. For example, if a breakout occurs in the Resistance Zone, the price will reverse and start moving downwards again by breaking the resistance line again, whereas if a breakout occurs in the Support Zone, then the price will reverse and start moving upwards again by breaking through the Support Zone. again. This is very dangerous because it will trap many people until finally, they have to cut losses so they don't experience more losses.
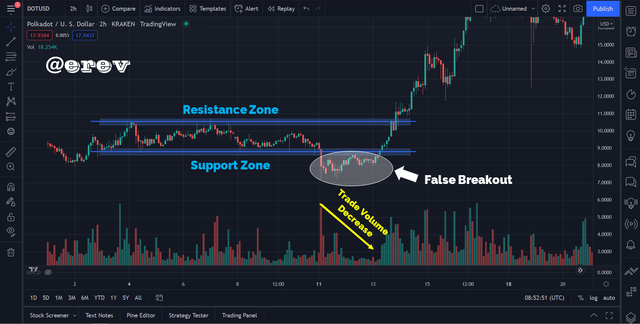
To avoid false breakouts, we can use the help of indicators as I explained in the previous discussion. However, for ordinary people who may not understand how to use an advanced indicator, the easiest way is to look at the trading volume that occurs in the market. If the breakout that occurs is a true breakout, then there will be an increase in trading shown by the volume indicator below the chart, be it buy or sell trades. Meanwhile, if the trading volume showed actually decreases, it is very likely that the breakout is a false breakout.
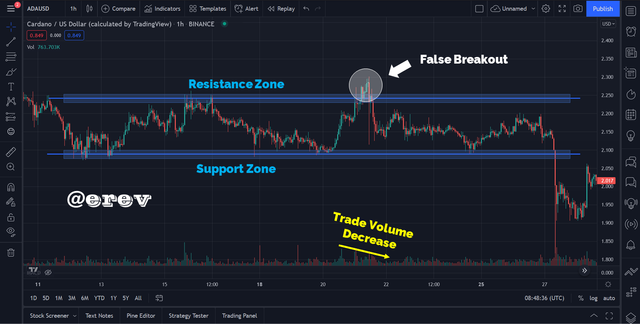
For example in the picture above it is shown that the candlestick started to break out with the Resistance Zone, but the trade shown on the volume indicator actually decreased, this proves that the volume indicator gave a signal that it was a false breakout. And after a while, the breakout was indeed a false signal and the candlestick started to fall again down until it broke through the Resistance Zone again.
Another example is when the candlestick makes a false breakout with the Support Zone. In the picture above it is shown that the candlestick started to break out with the Support Zone, but the selling trade volume shown on the volume indicator actually decreased, this proves that the volume indicator gives a signal that it is a false breakout. And after a while, the breakout was indeed a false signal and the candlestick started to rise again down until it penetrated the Support Zone again.
Question 5
On a demo account, execute a trade when there is a resistance breakout, do your analysis. Screenshots are required.
I will show you how to trade using the Resistance Zone breakouts. I will do this using a demo account on Paper Trading and I will use a 5-minute timeframe to make my trades faster.
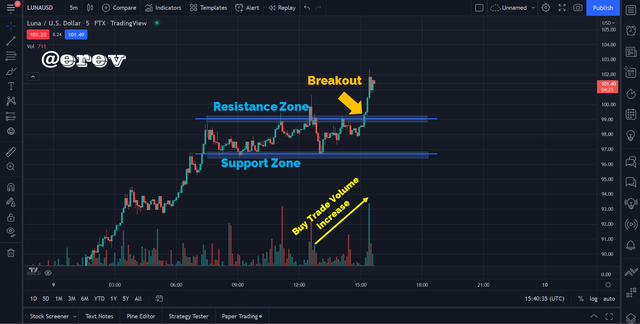
I drew the trendline at the lows and highs on the LUNA/USD chart so I got a Resistance Zone and a Support Zone. Then I saw a breakout that occurred between the candlestick and the Resistance Zone, which indicates a bullish trend signal. Then based on the trading volume shown by the volume indicator, there was an increase in the volume of buy trades that occurred in the market, and this confirmed the breakout signal.
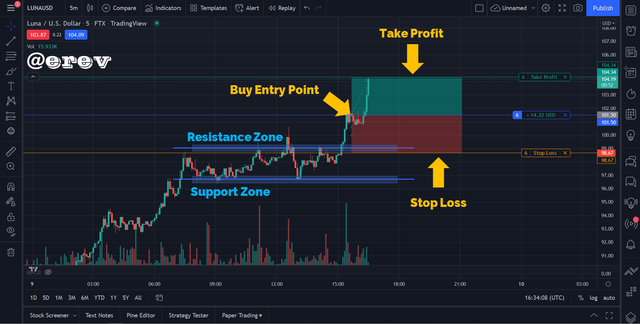
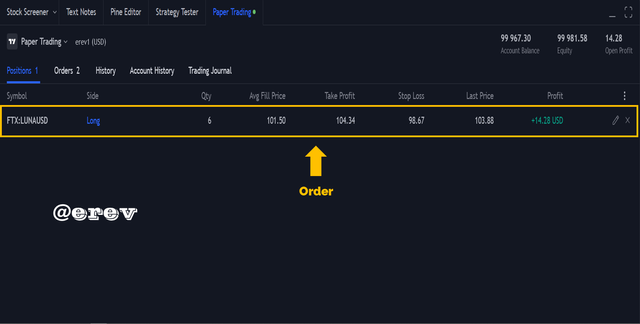
Then I waited for a moment until there were several candlesticks that formed swing points, then I started to enter trades with Long Positions with a 1:1 Risk/Reward ratio. I started trading at $101.5 and for my stop loss, I placed it under the Resistance Zone which was at $98.67 while for taking profit I placed it at $104.34.
Question 6
In a demo account, execute a trade when there is a support break, do your analysis. Screenshots are required.
Next, I will show you how to trade using the Support Zone and Resistance Zone breakouts. I will still be doing it using a demo account on Paper Trading and I will be using a 5-minute timeframe.
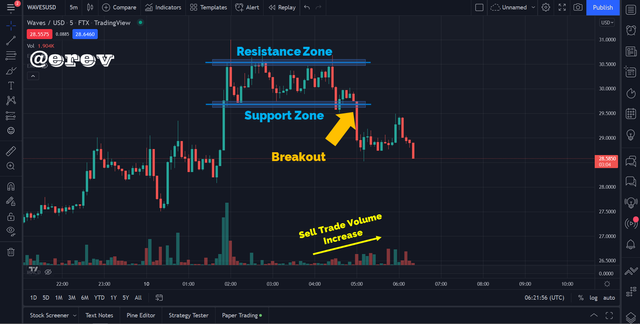
I drew the trendline at the lows and highs on the WAVES/USD chart so I got a Resistance Zone and a Support Zone. Then I saw a breakout that occurred between the candlestick and the Support Zone which indicated a bearish trend signal. Then based on the trading volume shown by the volume indicator, there was an increase in the volume of selling trades that occurred in the market, and this confirmed the breakout signal.
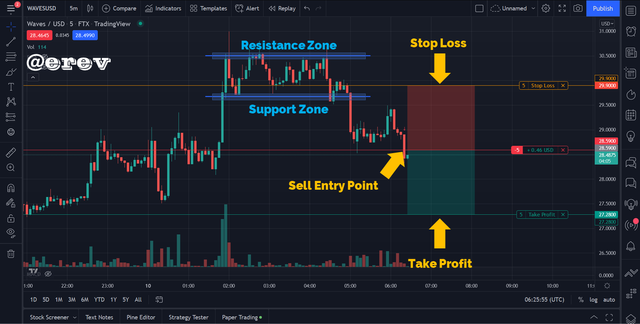
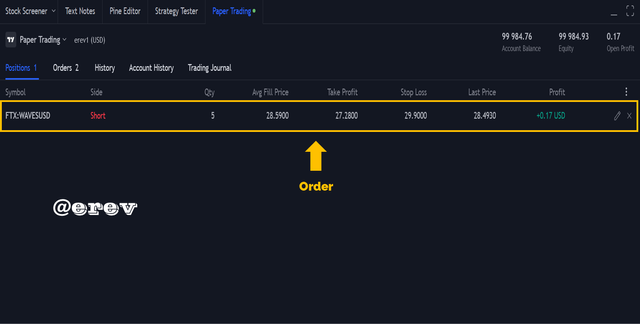
Then I immediately entered the trade because the candlestick had formed a swing point, I entered with a Short Position with a 1:1 Risk/Reward ratio. I started trading at $28.59 and for stop loss, I placed it above the Support Zone which was at $29.90 while for taking profit I placed it at $27.28.
Conclusion
Trading that uses Support and Resistance Breakouts is a trade that has a fairly good success rate because only by drawing 2 Trendlines on the chart we can already see which direction the chart will move, although we also have to consider false breakouts that might occur on the chart. candlesticks. In addition, Breakout Support Resistance is also very easy to understand and can be used by various types of traders in this world.
Support and Resistance Breakouts are also easy to use with various kinds of indicators, ranging from complex ones to even simple indicators such as volume indicators, this is because Support and Resistance Breakouts are not indicators but candlestick patterns so they are suitable to be used in conjunction with other indicators.
I thank professor @pelon53 who has given lessons on a very unique topic like this, I really get new knowledge from this given topic.