Candlestick Patterns - Steemit Crypto Academy Season 5 - Homework Post for Task 10
3 a) Identify these candlestick patterns listed in question 2b on any cryptocurrency pair chart and explain how price reacted after the formation. (Original Screenshot of your chart required for this exercise).
b) Explain the measures taken by the trader before trading candlestick patterns.
c) Using a demo account, open a position (buy or sell) on two crypto assets using any candlestick pattern and explain your reason for taking the trade. You can perform this operation using lower timeframes. (Show screenshots of your position and also your chart.

Identify these candlestick patterns listed in question 2b on any cryptocurrency pair chart and explain how price reacted after the formation. (Original Screenshot of your chart required for this exercise).

- Bullish Engulfing Pattern
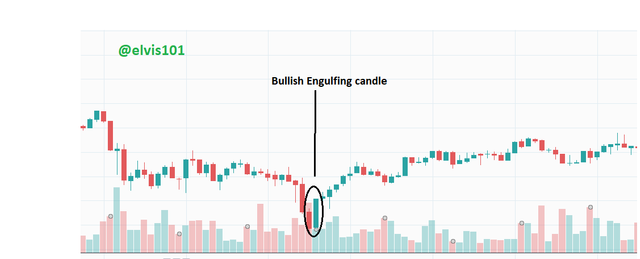
After the formation of the bullish engulfing pattern on the chart, the price went the opposite direction because buyers took over the market, pushing the price upwards.
- Doji
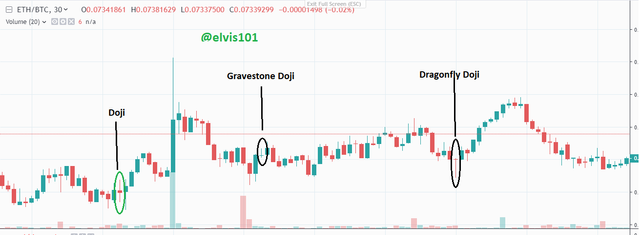
Though Doji signals indecisiveness in trading, buyers took over price action after the formation of the identified doji on the chart, pushing price upwards. This may be so because buyers had the last say in the doji even though it is a bearish candle.
- Gravestone Doji
After the formation of the gravestone doji, buyers briefly takes over the market price after which there is a continuous struggle between buyers and sellers on market price decision. The gravestone doji here is insignificant most probably because of its location: it appeared in a consolidation point.
- Dragonfly Doji
The dragonfly doji on the chart is significant as buyers take over price action after the formation of the doji, pushing price upwards.
Hammer
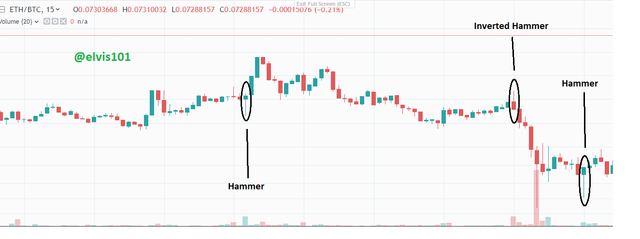
After a long consolidation, the formation of a hammer is succeeded by an immediate uptrend in price, showing that buyers have momentarily taken over the market (especially in the first hammer on the chart).
Inverted Hammer
The formation of an inverted hammer after a strong consolidation shows sellers pushing price downwards against the dominant trend of the market.
- Morning star
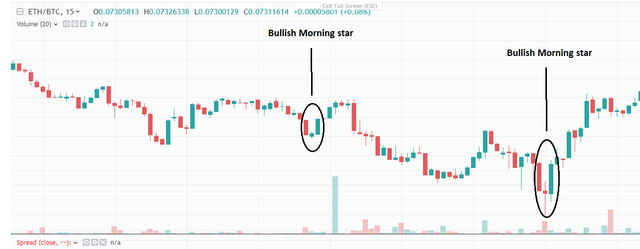
After the formation of the morning star on the chart, sellers seem to have been exhausted, thus giving way to buyers to momentarily take over the market by pushing price upwards.
- Evening star
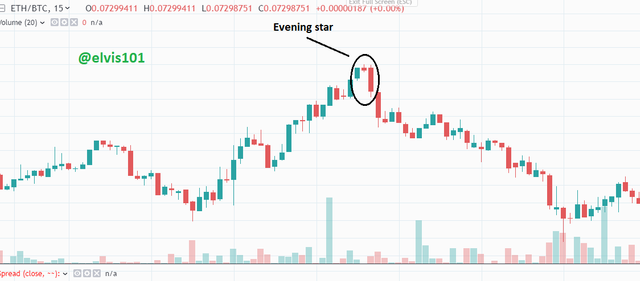
After the formation of the evening star on the chart, there is a strong bearish reversal- showing buyers pushing down the price and forming a momentary downtrend.
- Bullish Harami
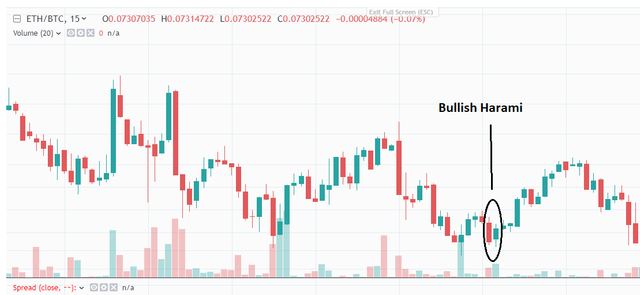
After the formation of the bullish harami in the support area of the chart, buyers significantly take over price action by pushing price upwards.
- Bearish Harami
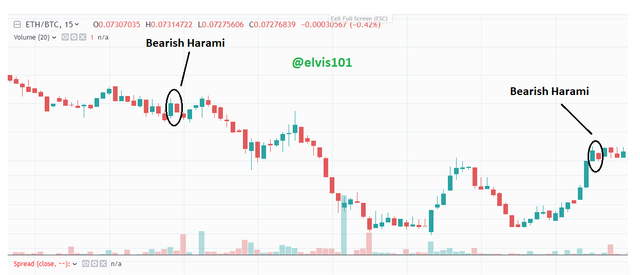
The first bearish harami on the chart occurs at a point where price is trending downwards, depicting there is going to be a continuation of the downtrend. As we can see price continue to head downwards after the formation of the bearish harami. This is a signal that should however be taken with caution as one needs to combine other indicators in determining the direction of price in the market.

Identify these candlestick patterns listed in question 2b on any cryptocurrency pair chart and explain how price reacted after the formation. (Original Screenshot of your chart required for this exercise).

Trend
Candlesticks are not traded in isolation but are traded within the context of the market structure. The first thing to observe is the trend of the market: the trader needs to understand whether the market structure is an uptrend or a downtrend. This gives a trader insight into the location where he can enter a trade. However, proper knowledge of the likely location for an entry is not sufficient for trading, hence should be combined with an Area of Value.
Area of Value
The area of value is the strategy employed by the trader to determine a fair entry alongside observation of the trend in market structure. The trader could use support and resistance or employ a strategy that requires the adoption of a couple of indicators or just a single indicator. A trader may decide to use the trendline, Bollinger band, and moving average to determine a suitable area of entry or use just one of these as an indicator for entry. The next thing to observe here is the entry trigger.
Entry trigger
The entry trigger could be any of the candles explained above. It could be the hammer, bullish engulfing candle, morning star, evening star, and harami e.t.c. An entry trigger (candlestick) that is formed in an area that goes in line with Trend observation and Area of value gives the trader a higher tendency for a positive trade than those that occur in isolation.
A trader also takes into consideration the size of the candle that functions as the entry trigger: As a trader, you don’t want to go short on a weak evening star. In such a case the candle must show that sellers have actually taken full control of price, else it is not so advisable to enter a trade. Also, the trader must understand the anatomy of a candle beyond its color and name. The trader must know what the body of a candle says in relation to the wicks.
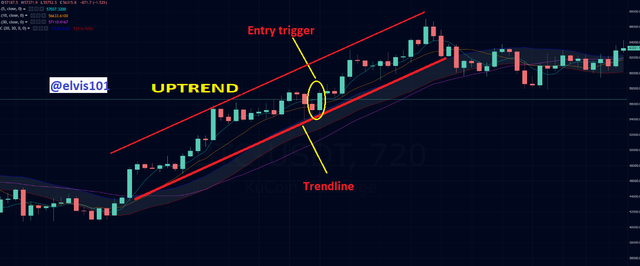
In the 1-hour BTC/USD chart below, the trend of the market structure is an uptrend and we can see that price is obeying the trendline, thus giving a trader an area of value. The formation of the bullish engulfing candle is an entry trigger that tends towards the continuation of the uptrend: and that is what we see happen in the chart.
Though the illustration above may not always be right considering the dynamic nature of the crypto market, it gives the trader a greater chance of making a good trade.

Using a demo account, open a position (buy or sell) on two crypto assets using any candlestick pattern and explain your reason for taking the trade. You can perform this operation using lower timeframes. (Show screenshots of your position and also your chart

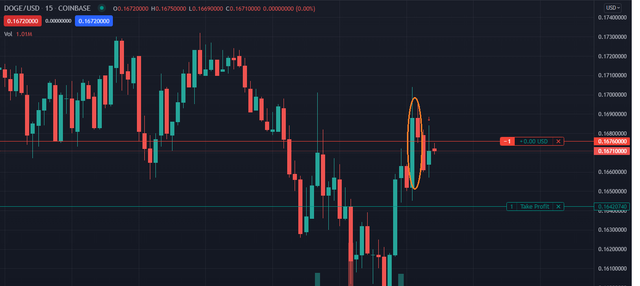

I entered a short position at 0.16760000 on the DOGE/USD chart when I spot the formation of a bearish harami after a successful upward price movement. Price was moving upward as if to touch the resistant position of the double top to the left of the chart but then a bearish harami is formed indicating that price may not be able to create another peak as the former peaks which is most likely.