Technical Indicators |Crypto Academy | S4W2- Homework Post for @reminiscence01
INTRODUCTION
Good day steemians, welcome to steemit crypto academy season 4 week 2. Today I'll b making a post about technical indicators. Most of is have heard of technical indicators before but today I'll be making an in depth post about it naded in the assignment given by professor @reminiscence01.
1a) In your own words, explain Technical indicators and why it is a good technical analysis tool.
The cryptocurrency ecosystem is very unique in a lot of ways . Every trader is trying to get the best part of it. That is to make profits from every trade. To be able to know how the market will react in the future, we make use of indicators.
Indicators are gotten by using historical data like previous prices, volumes and overall market behavior. The use of indicators are a way of using technical analysis during trading. From the information we have gathered above,we can now confirm that technical indicators are tools used in trading to assist traders in predicting future market prices, identifying current trend, identifying trend strength ,etc , amongst many others . They give traders an extra help in making the most out of their trades . That is making the most profit.
From all the information we have gathered above, we can see why indicators are a good technical analysis tool. Indicators are regarded as great technical analysis mostly because of the following reasons ;
Indicators assists us in predicting market price
Indicators allows traders identify the current trend of the market
Indicators show the trend strength of the market.
Indicators also show volatility of the market.
Apart from the few points mentioned above , technical indicators also show Moe technical analysis of a chart but it should be known that no indicator is 100% accurate and they're best used in a combination.
1b) Are technical indicators good for cryptocurrency analysis? Explain your answer.
When we want to trade, it is important to make plans and strategies so as to enable us get the proper entry and exit points. One of those strategies traders use is the usage of technical indicators. So yes , they are good for cryptocurrency analysis and here's why.
Each technical indicator is calculated based on previous market movement and historical data of that crypto currency. The market movement are often caused by traders behavior (buy and sell) and since the indicators are made from the previous buy and sell history ,it gives an insight on the next market behavior. This makes it very good for cryptocurrency analysis.
But as I said before , no indicator is 100% perfect but however technical indicators remain a very important tool to traders.
1c) Illustrate how to add indicators on the chart and also how to configure them. (Screenshot needed).
For this section I'll be using the Tradingview mobile app.
Adding indicators to the chart is really simple . Most times indicators are represented by "Fx" on most trading platforms so they are easy to see. Let's see how to add an indicator and then configure it to a setting of our choice.
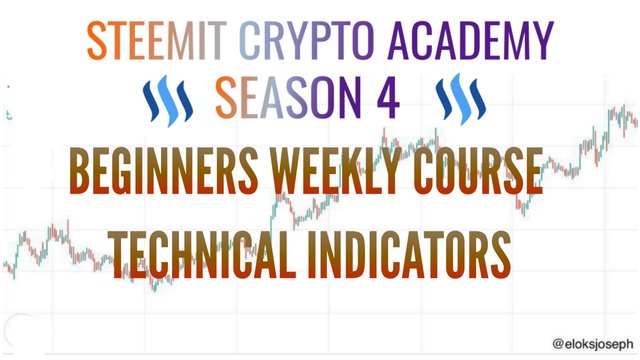
- The first thing to do is to click a cryptocurrency chart or pair of your choice. Here I'll be using BTC/USDT.
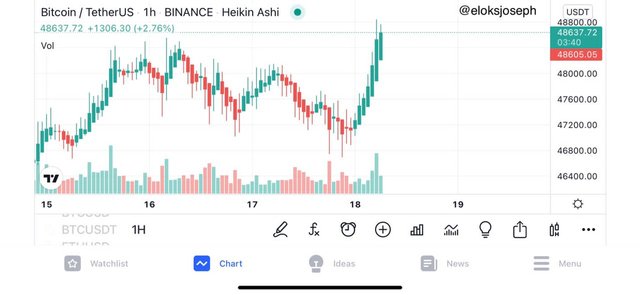
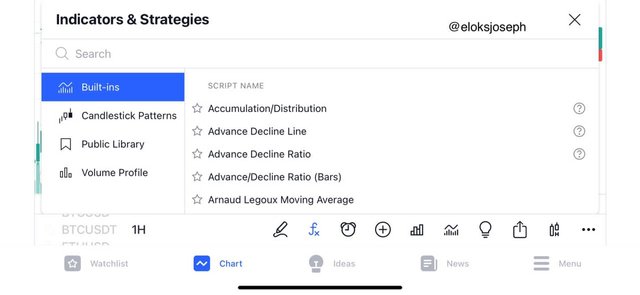
- On the chart, look for the Fx tab and click on it
- Here ,you have a wide range of indicators to choose from and you can easily search.
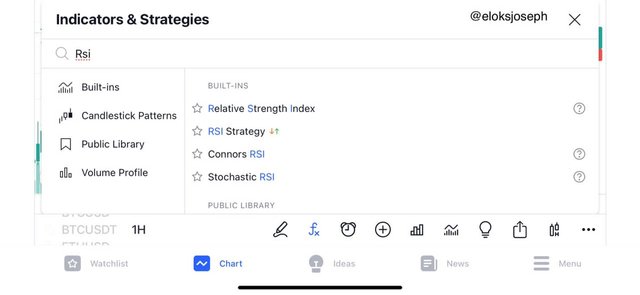
- Let's search for the RSI indicator then configure it.
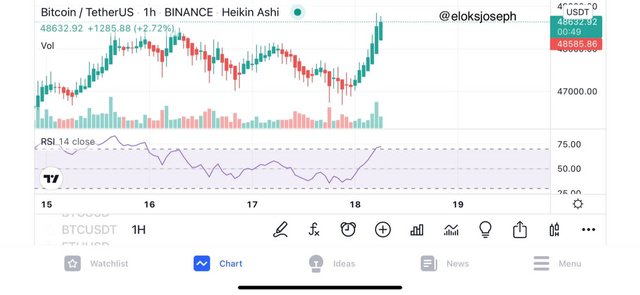
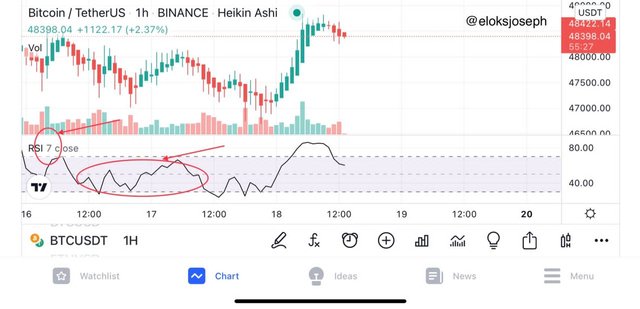
- This is the RSI indicator added on the chart. You can see the graph as it shows the oversold and overbought positions of the market. Overbought is above 70 and oversold is below 30.
- To configure an indicator, click on it and you'll see a setting .
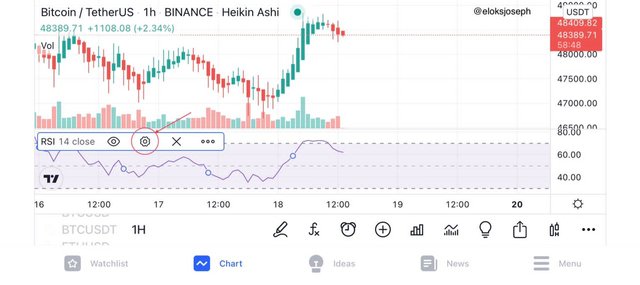
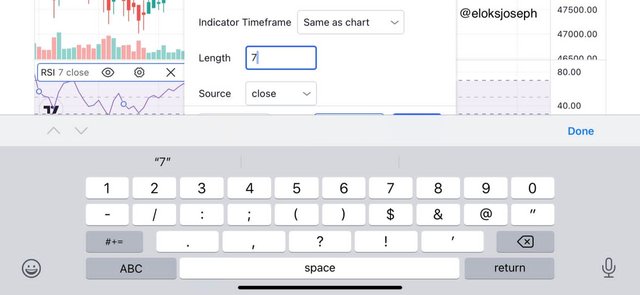
- Click on the setting and configure it to your specifications.
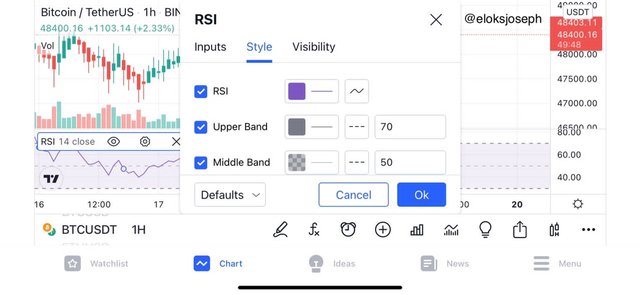
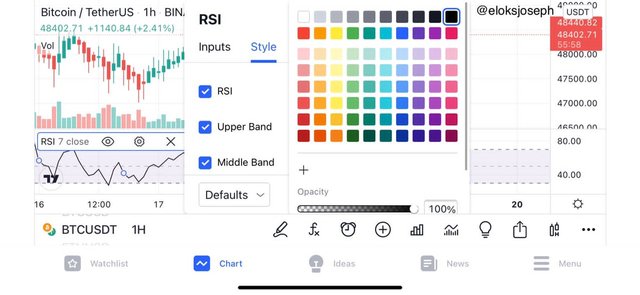
- I'll change the period and colour of the graph .
- We can now see the new change in the chart.
2a) Explain the different categories of Technical indicators and give an example of each category. Also, show the indicators used as an example on your chart. (Screenshot needed).
Screenshots from this section are from tradingview mobile app
Technical indicators have different categories which include;
1 TREND BASED INDICATORS
As the name implies, trend based indicators are indicators that deal with the current trend if the market. They follow market trend and market price on the chart showing if it is in downtrend or uptrend. From the professors lecture , we know that the trend is our friend so these Indicators show market trend easily. Some treen based indicators are;
- Moving average ( Simple or exponential)
- Parabolic SAR
- ADX
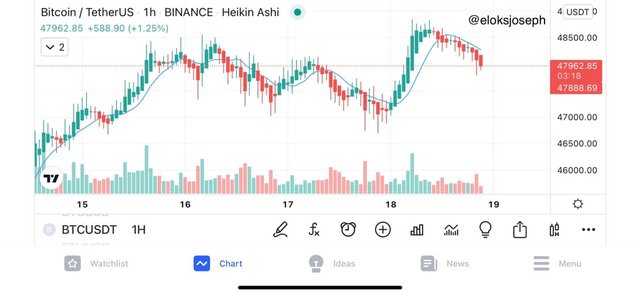
A screenshot showing the Moving Average on the chart:
2 VOLATILITY INDICATORS
These type of indicators shows how quickly proves fluctuate. Crypto markets are very volatile ones so these indicators help traders know the strength of each swing in a market . They are used to measure market volatility. They include;
- Bollinger bands
- ATR indicator
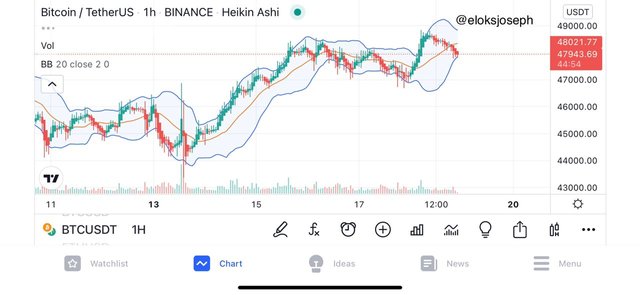
The Bollinger bands indicator on a chart;
3 MOMENTUM BASED INDICATORS
These type of indicators often show how far the market price has traveled. These type of indicators follow the market momentum closely. That means that when the market goes up, the indicator goes up and when the market goes down, the indicator goes down . These indicators are good at showing overbought and oversold position in a chart. They are also known as oscillators.Examples are;
- RSI
- Stochastic oscillator
- CCI, etc
Screenshot of RSI on a chart;

2b)Briefly explain the reason why indicators are not advisable to be used as a standalone tool for technical analysis.
When we think of using indicators during trading, what we should first remember that each indicator has its uses and every indicator has limitations. No indicator can successfully give the entire future market prediction.
I have said earlier in this post that indicators are best combines for maximum effectiveness as the usage of just one indicator can't give you total information you need. For example, if you use just the RSI for trading ,you can't get more information than the oversold and overbought positions of the market.
Another reason why the indicator shouldn't be used alone is the false signals that might be gotten from it . If certain indicators are used alone ,some false signals would be generated because of probably the period settings . On a lower time frame, a lot of fake signals are generated so it best to use more than one indicator to trade as no indicator has 100% efficiency.
2c)Explain how an investor can increase the success rate of a technical indicator signal.
To use an indicator successfully, you need to understand the indicator. If you don't understand how to use an indicator , you might read off the wrong signals an in turn make mistakes that lead to unwanted losses. We should also know the right indicators for our trading style - scalping or swinging.
Another way to increase the success rate of technical indicator signals is using the right combination of indicators. We have established that no indicator is 100 % accurate so we know that we'll have to combine 2 or more indicators for more authentic signals. But the combination has to be done right. For example, personally I use the combination of the KDJ, ADX and RSI indicators to get my entry and exit points .
After knowing the proper combination to use and how to use these indicators, we should also know the proper settings to use. Most times using a lower period settings show a lot of signals and a lot of false signals so most traders use a longer period settings.
CONCLUSION
Indicators are a very important tool in trading and proper understanding of the use and types of indicators helps every trader in increase trade success.
We should also bear in mind that every indicator had its strength and weaknesses so combination of 2 or 3 indicators would help a lot.
Thank you professor @reminiscence01 for the lecture.
Hello @eloksjoseph, I’m glad you participated in the 2nd week Season 4 of the Beginner’s class at the Steemit Crypto Academy. Your grades in this task are as follows:
Recommendation / Feedback:
Thank you for participating in this homework task.
Thank you for your review professor. I'll keep up the good work