STEEMIT CRYPTO ACADEMY SEASON 3 WEEK 7: THE AVERAGE DIRECTIONAL INDEX INDICATOR (ADX)
- Discuss your understanding of the ADX indicator and how it is calculated? Give an example of a calculation. (Screenshot required)
- How to add ADX, DI+ and DI- indicators to the chart, what are its best settings? And why? (Screenshot required)
- Do you need to add DI+ and DI- indicators to be able to trade with ADX? How can we take advantage of this indicator? (Screenshot required)
- What are the different trends detected using the ADX? And how do you filter out the false signals? (Screenshot required)
- Explain what a breakout is. And How do you use the ADX filter to determine a valid breakout? (Screenshot required)
- What is the difference between using the ADX indicator for scalping and for swing trading? What do you prefer between them? And why?
- Conclusion

THE ADX INDICATOR
The ADX indicator fully translates to Average Directional Movement Index. This indicator is often used to determine the strength of a trend. It is often used to determine the movement of the price of the market using the positive Directional Movement Indicator and the negative Directional Movement Indicator.
The indicator is ranged from 0 to 100 on the graph and as it moves from 0 to 100, the trend is stronger. It is often divided to 4 quadrants by most traders even though some use 5. These divisions are often not necessary but they are often made to mark out the ranges 0 to 20
or 0 to 25 as these are the ranges where the trend is very very weak or there is no trend at all.
That said we could use the following position of the ADX on the graph to determine the strength of a trend:
- 0 - 25 = very weak trend or no trend at all and this is often common in a market with low volatility.
- 25 - 50 = little trend in the market
- 50- 75 = the trend is very strong
- 75-100 = extremely volatile market and an extremely strong trend.
The mark at the 25 range is the most important as those who trade based on trend of the market are notified on the absence of a trend.
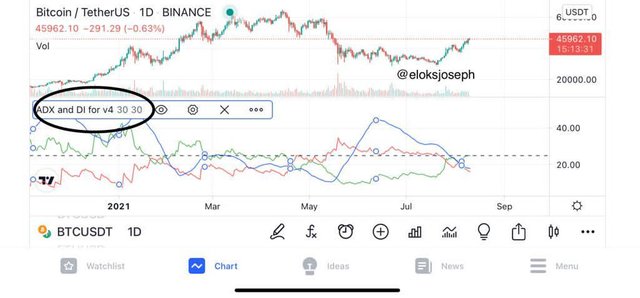
These DMI are most often used with the ADX as it makes it easier to read. When they are added ,it is in the + DI and - DI . The positive DI indicates the strength of an increasing trend while the negative DI indicates the strength of a decreasing trend. Both Directional indicators are more sensitive than the ADX and they react to trend change faster than the ADX.
Guide:
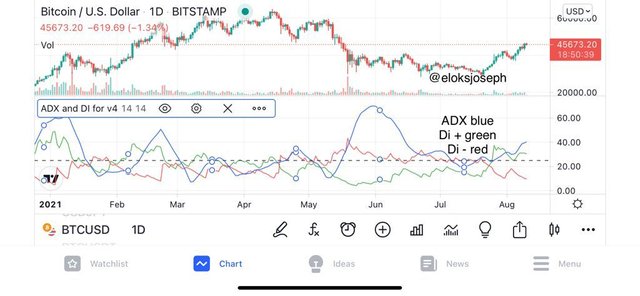
BLUE = ADX INDICATOR
GREEN = + DI INDICATOR
RED = - DI INDICATOR
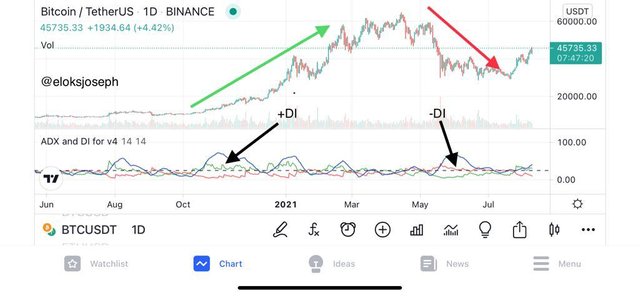
It has also been noticed that when the DI+ is above the DI -, the price is up and when the DI- is above the DI+ ,the price is going down.
HOW TO CALCULATE THE ADX INDICATOR
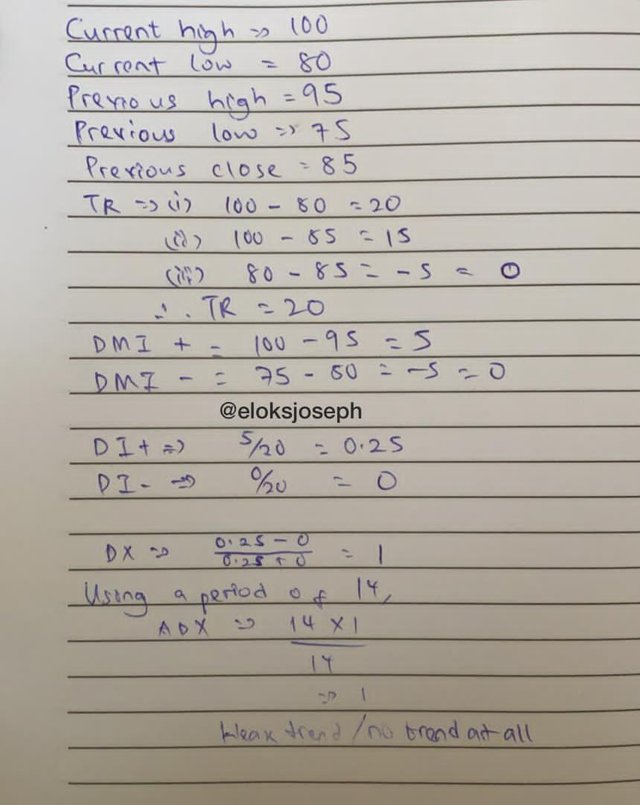
To calculate the ADX indicator graph, you'll need to calculate the to initially calculate the DMI , TR and DI . Let's start;
- + And - Dimensional Movement Indicator
Thrr are 2 DMI indicators. The DMI+ and the DMI -. These values are very important if we're to calculate the ADX graph. They can be calculated thus;
DMI+ = day high - previous high
DMI - = previous low - day low
From the formula written above, it can be seen that to calculate the negative DMI we make use of the previous low price and the current low price. The difference between them gets the negative DMI. On the other hand , for the positive DMI, we make use of the current high price and the previous high price. The difference between them gets the positive DMI.
- True range (TR)
The true range is an important value needed to be calculated which would be combined with the DMI values to get the DI which would now be in turn used to get the ADX indicator.There are different ways to calculate the true range;
• High of the day - low of the day
• high of the day - close of the day
• low of the day - close of the day
- DI+ and DI -
The values of the DI are calculated using the positive and negative DMI values divided by the true range to get the corresponding positive and negative DI values. A more simpler expression;
DI+ = DMI+/TR
DI- = DMI-/TR
- DX
The directional index is calculated thus;
(+DI - DI-)/(+DI + DI-)
- ADX
The formula for the calculation of the average directional index is now given as;
N[(+ DI - DI- )/ (+DI + DI-)] / n
Where 'n' is the number of period.
Lets take a practical example;
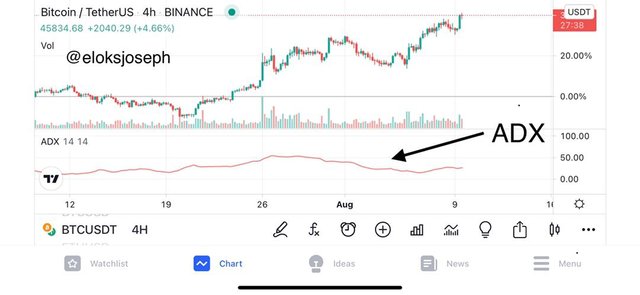
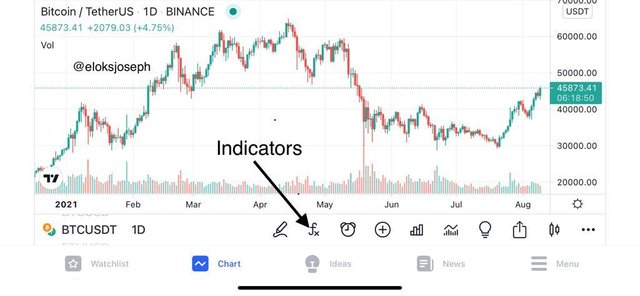
HOW TO ADD ADX INDICATOR TO THE CHART AND ITS BEST SETTINGS
For this section, I'll be using the Trading view mobile app. So I'll be showing how to add the ADX and DI on the app.
The first step is really simple as all you have to do is pick a crypto chart. I personally picked BTC/USDT.
In the chart, you'll see ' Fx '. These are the indicators.
- Clicking on it, you'll see the search option,so you can easily search for ADX and DI.
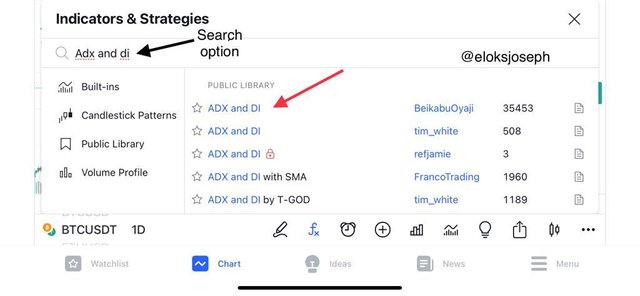
- Click on it and it'll be added to the chat.
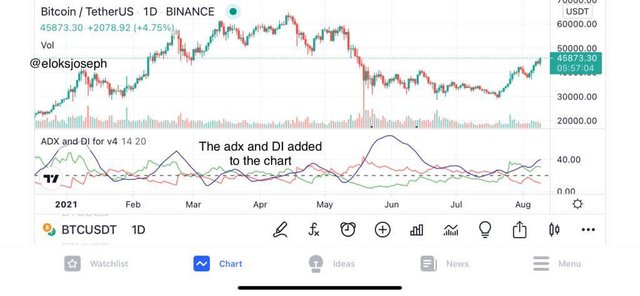
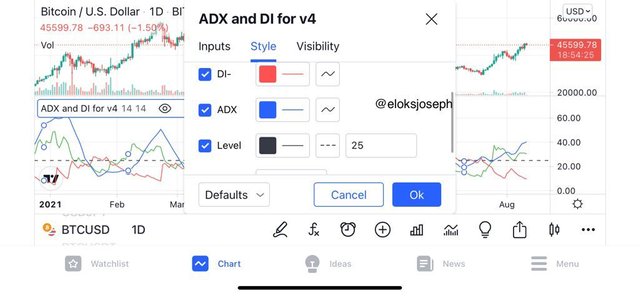
- To configure it to your personal setting, click on the setting option on the indicator and you'll see a tab where u can edit values and colour.
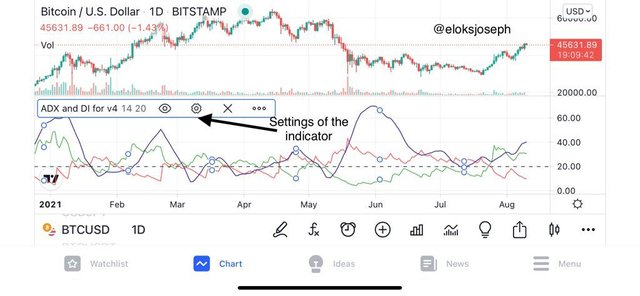
Here , I have edited my settings thus;
• style settings; ADX= blue
DI+ =green
DI- = red
Level= 25
This level is the 25 point at which indicates the absence of trend or no trend at all. Some traders use the 20 level but most often refer to the 25 level .
• Input; ADX smoothing = 14
DI = 14
It's best to put them in sync but it can also be changed.
• Visibility; we have seconds , minutes, hours ,etc in this section and I'll be leaving it in it's default settings.Click on ok and these new features would be added to your chart.
- As you can see, all the new settings have been inputed in the chart.
That said, the next question would now be ,which period setting is best when using the ADX indicator.
As we know by now ,the period can be changed to whatever length we want all though it is advisable to keep it between periods 7 and 30.
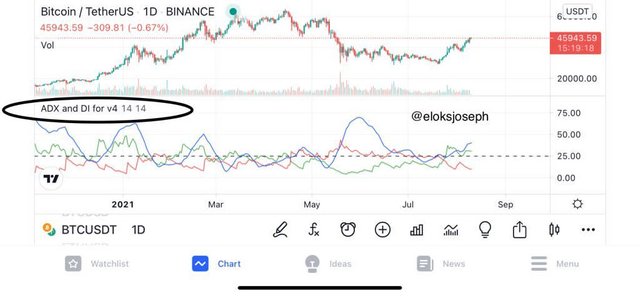
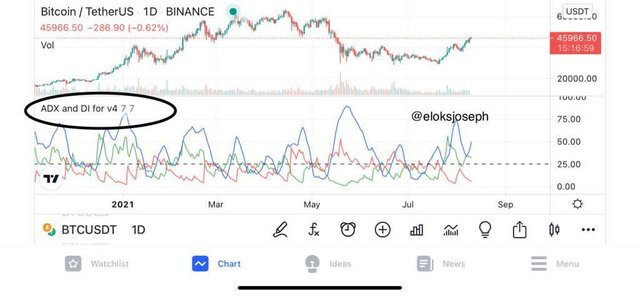
Overall, the best period setting is the 14. To back up my claims, I'll be showing you different charts using the period 14 , period 7 and period 30.Before then , it should be noted that these periods are directly related to the timeframe. If I pick a period 14 on a 1hr chart, it would create a graph for the last 14 hours and and if it is a 1day chart it would show for the last 14 weeks. Now let's get back to comparing graphs;
PERIOD 14
PERIOD 7
PERIOD 30
I used the 1 day time frame on all 3 charts so the obvious differences would be seen. On the 7 period chart, it is seen to be change direction on the slightest trend change too quickly therefore giving wrong signals sometimes . The 30 period on the other hand , is a bit too flat and doesn't identify some trends . The 30 period charts also doesn't recognize a trend until it's very strong making traders miss out on some trends. Comparing it with the 14 period which is see to move along with the trends accordingly so it's the best setting.
Do you need to add DI+ and DI- indicators to be able to trade with ADX? How can we take advantage of this indicator?
The ADX indicator can be used alone in tracking the strength of trends but it is advisable to combine it with the DI + and DI- indicators as they give the direction of trend. That said , it can be noted that while the ADX indicator determines and shows the strength of a trend, the DI+ and DI - indicators are responsible for showing the direction of the trend.
The DI+ and DI - graph reacts to the price movement faster than the ADX indicator so it is best to combine all 3 for better results. While the DI+ indicates a rising trend, the DI- indicates a falling trend.
Let's take a look at the advantages of these indicators;
As we all know by now , the ADX indicator often shows the strength of the current trend of the market. The higher the peak of the graph , the stringer the trend and the lower the graph, the weaker the trend. From that we can say the main advantage of the indicator is it's ability to determine the strength of a trend.
Now , adding the DI+ and DI- indicators ,we can also see the direction of a trend be it bullish or bearish. As we know by now that the DI+ shows a rising trend and the DI- indicator shows a falling trend. This is also useful as the indicators therefore shows if a trend is going bullish or bearish.
From the chart below, we can identify the DI+ and DI- signifying the uptrend and downtrend and also the case where there's no trend or a weak trend.
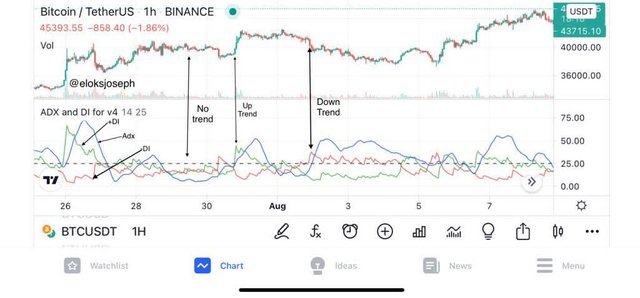
In addition to that , the DI+ and DI- indicators are often used by traders to track buy and sell signals. Although it is not 100% accurate, when the positive DI crosses the negative DI from below , there is an incoming uptrend and when the negative DI crosses the positive DI from below , there could be an incoming downtrend.
TRENDS THAT CAN BE DETECTED USING THE ADX INDICATOR
- WEAK TREND / NO TREND:
This is often indicated by the ADX graph falling between the range of 0 - 25. This position of the market doesn't do well with most traders as most traders trade according to the current trend of the market and when the ADX indicator is in this region, there is no trend and the market is not volatile at all.
- STRONG TREND:
This often happens when the ADX indicator is withing the range of 25-50. Here most traders enter into the market as it is increasing it's volatility and the trend is becoming strong.
- VERY STRONG TREND:
This occurs when the ADX indicator is within the ranges 50 - 75. This doesn't last long and at this level, the market is very volatile and previous support and resistance levels can be broken here due to the volatility.
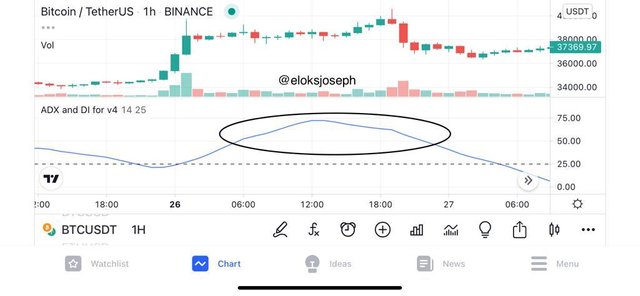
- EXTREMELY STRONG TREND:
This rarely happens and it is very hard to see this. The market is extremely volatile and the trend is extremely strong. At this point, the ADX indicator is often between the ranges 75- 100.
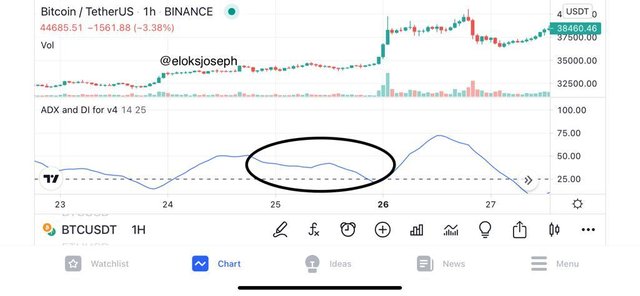
HOW TO FILTER OFF FALSE SIGNALS
Earlier in this post ,we talked about the different settings for the period of the indicator. If you had noticed, when using a smaller period length setting, the graph was changing direction very quickly and giving off more signals than usual, therefore increasing the number of false signals. The opposite can be said when using longer periods as lesser waves are seen and the graph is defined and more accurate signals are seen.
That being said it can be ascertained that the higher the period setting,the lesser the false signals as the sensitivity if the graph would have been reduced greatly.
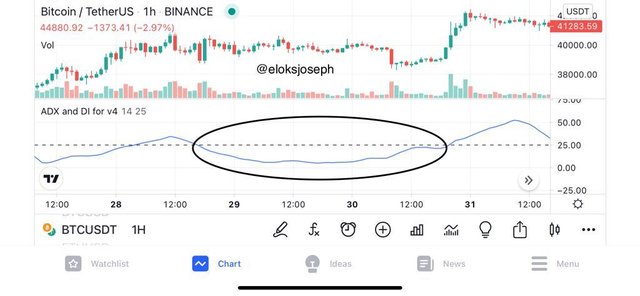
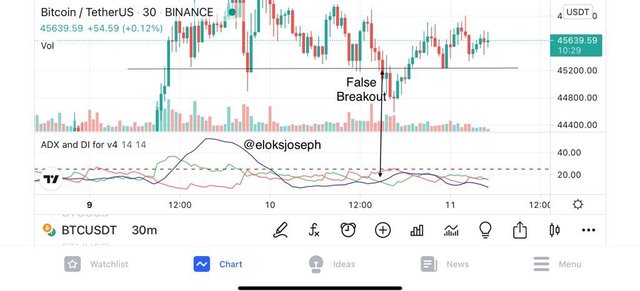
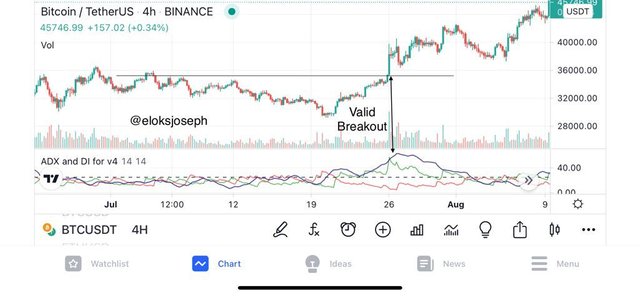
BREAKOUTS AND HOW TO USE THE ADX INDICATOR TO DETERMINE A VALID BREAK OUT
Breakouts occur when the price of a market breaks through a resistance or support level. When the price of a market breaks support or resistance, a break out has occured. Breakouts could be in 2 forms. True break out and false breakouts.
A true break out occurs when the price movement follows the breakout. That is, if there price of the market breaks out of resistance,it keeps going up or if the price of a market breaks support and it keeps going down. A false breakout the other hand occurs when there's a break out and an immediate reversal in the direction opposite to the breakout.
HOW TO DETERMINE A VALID BREAK OUT USING THE ADX INDICATOR
Recall that when the ADX indicator is within the ranges 0 -25 , there is no trend in the market or there is a very weak trend. Also, knowing that breakouts occur in trending markets ,we can now say that when a breakout occurs when the ADX indicator is in the range of 0-25, itwould be a false break out and when the breakout occurs when the ADX graph is above the value 25, it is a valid break out.
USING THE ADX INDICATOR FOR SCALP AND SWING TRADING
SCALPING:
Scalp trading is short term trading. This type of trading often lasts for a short period of time like 2 minute ,3 minutes, 5 minutes,etc. The trend of the market during that time frame can be identified using the ADX indicator on lower period settings.
It should be noted that the ADX indicator shouldn't be used alone as all indicators are best used together with other. So when using the ADX indicator, it can be combines with the RSI graph and price action amongst other indicators for proper entry and exit points.
SWINGING:
Swing trading on the other hand involves trading ok higher time frames including 4hrs ,12 hrs ,1 day ,etc.The ADX can also be utilized in this type of trading on a higher period setting.
As always ,it is always advisable to trade with more than one indicator so adding other indicators like the price action , RSI etc would be really effective for profitable trades .
PREFERENCE:
Personally, I prefer the swing trading on higher period settings as the graph is not as sensitive as it is on lower period settings so it filters out most false signals and gives more defined information on the market trend.
CONCLUSION
The ADX and DMI indicator serves every trader using it the opportunity to see the strength and direction of the current market trend. This indicator doesn't forecast signals but when used with other indicators, it is really helpful in filtering out false signals to give better entry and exit points when trading.
The indicator can also be setting to different period settings to suit your style of trading. But like every indicator, it is best to combine and add other indicators to the chart when being used for maximum effectiveness.
Thank you professor @kouba01 for the great lecture. It was a great experience learning about the ADX indicator.
Hello @eloksjoseph,
Thank you for participating in the 7th Week Crypto Course in its third season and for your efforts to complete the suggested tasks, you deserve a 5.5/10 rating, according to the following scale:
My review :
Work with average content, as part of your response was limited to stating information without analyzing it, resulting in a loss of critical work.
A simplified and understandable explanation of the indicator and its use.
The final operation is ADX = Sum of n [((DI +) - (DI-)) / ((DI +) + (DI-))] / n, So to get the correct ADX result, you need to calculate DX values for at least n periods then smooth the results.
Your answer to the second question was not deep in terms of analysis and providing examples of several positions for the two lines.
The same goes for how to extract the false signals and determination of breakout points by using the ADX indicator.
A superficial explanation of two methods of trading with ADX indicator, as you confined to stating generalities without going into more details.
Thanks again for your effort, and we look forward to reading your next work.
Sincerely,@kouba01