Heikin-Ashi Trading Strategy | Steemit Crypto Academy| S4W2 | Homework Post For @reddileep by @eloksjoseph
INTRODUCTION
Good day everyone, welcome to steemit crypto academy season 4 week 2!!! Today we'll be talking about the Heikin-Ashi Trading Strategy based in the lecture given by great professor @reddileep .
1- Define Heikin-Ashi Technique in your own words.
2- Make your own research and differentiate between the traditional candlestick chart and the Heikin-Ashi chart. (Screenshots required from both chart patterns)
3- Explain the Heikin-Ashi Formula. (In addition to simply stating the formula, you should provide a clear explanation about the calculation)
4- Graphically explain trends and buying opportunities through Heikin-Ashi Candles. (Screenshots required)
5- Is it possible to transact only with signals received using the Heikin-Ashi Technique? Explain the reasons for your answer.
6- By using a Demo account, perform both Buy and Sell orders using Heikin-Ashi+ 55 EMA+21 EMA.
THE HEIKIN-ASHI TECHNIQUE
Over the course of trading and going over charts, we'll have noticed that there are different types of charts and ways of representing market price. Most of us are conversant with the Japanese candlestick and the line chart,but another important way of displaying data is the Heikin-Ashi technique.
The phrase "Heikin-Ashi" is Japanese for "average bar" . From that phrase ,we can pick out that it is an average of market price represented looking like the basic japanese candlestick. The Heikin-Ashi technique may look like the Japanese candlestick but it differs as it is a smoother way of representing market price which is created based on the average value of market price. Every new candle is created based on the information of the previous candle which gives the candle more uniqueness and also the ability to identify trend. Let's take a look at a chart using the Heikin-Ashi technique.
Before then, let me show you how to change from the normal candlestick patterns chart to the Heikin-Ashi chart on tradingview.com
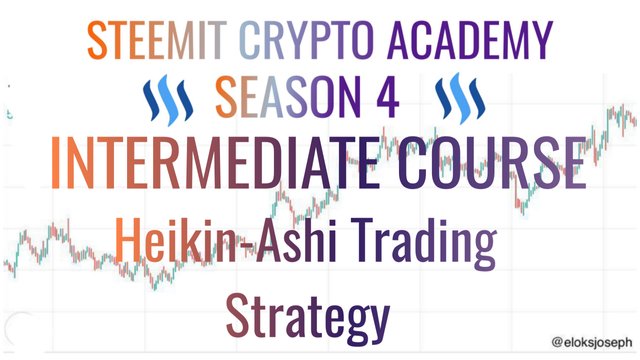
- First , you have to open any chart pair of your choice. I'll be using the BTC/USDT pair. At the bottom right corner, you'll see a symbol that looks like candles. Click on it
Screenshot from tradingview mobile app
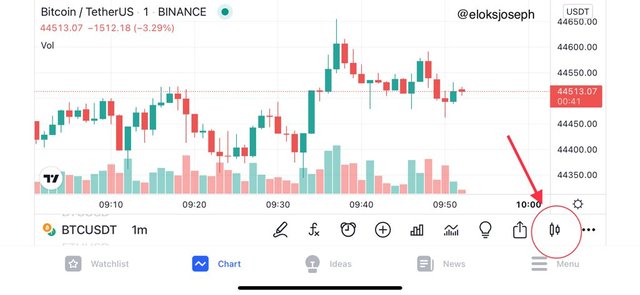
- After clicking , you'll see a pop up tab containing different way to show chart and market prices. Click on Heikin-Ashi
Screenshot from tradingview mobile app
- Once you click on Heikin-Ashi, the chart would change to that of the Heikin-Ashi.
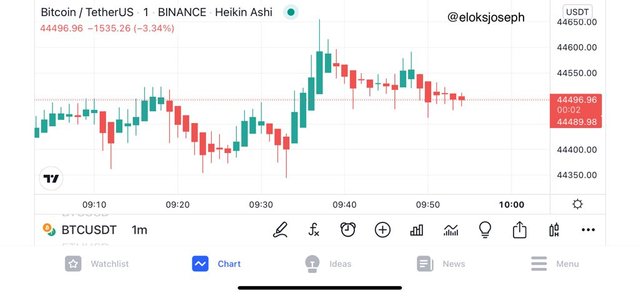
From what we can see above , the Heikin-Ashi chart is smooth and defines trend properly as it either goes as a string of green candles or a string of red candles.
DIFFERENCES BETWEEN THE HEIKIN-ASHI CHART AND THE TRADITIONAL CANDLESTICK CHART
Since we now have an underlying knowledge about how the Heikin-Ashi chart looks like, let's compare it with the traditional candlestick .
CANDLE PATTERNS:
When checking the candles on the traditional candlestick, they often change and the chart often contains a lot of red and green candles regardless of the trend. On the other hand, the Heikin-Ashi chart candles often show a long run of same coloured candles on relation to the trend. Let's check this comparison with a couple screenshots.
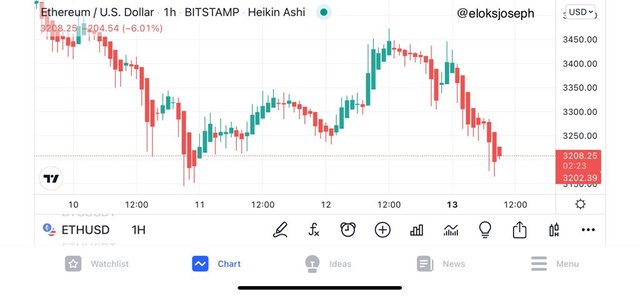
Screenshot from tradingview mobile app
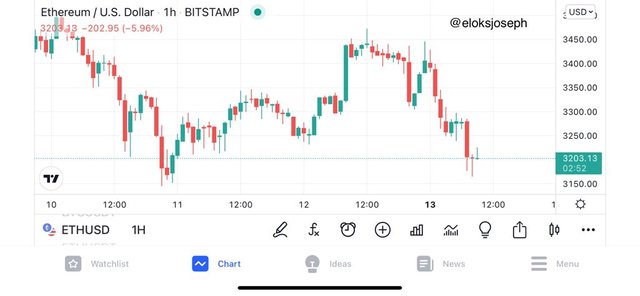
Screenshot from tradingview mobile app
From the 2 screenshots above , we can see that the one above (Heikin-Ashi) is more smoother and defined than the one below (traditional candlestick). For the Heikin-Ashi,when the price was going up, the candles were green and when it was going down, the candles were red. On the traditional candlestick, in both situation, there were mixtures of both red and green candles.
OPEN AND CLOSE :
The Heikin-Ashi candles often start from the middle of the former candlestick. This is because of the way it is calculated. The traditional candlestick on the other hand starts from where the previous candlestick closed.
Screenshot from tradingview mobile app
Screenshot from tradingview mobile app
IDENTIFICATION OF TREND:
In the Heikin-Ashi chart, trends are easy to identify as candles barely change colour in between strong trends. The traditional candlestick on the other hand has different colour changes regardless of current market trend.
Heikin-Ashi chart
Screenshot from tradingview mobile app
Traditional candlestick
Screenshot from tradingview mobile app
* * *
Above are the more significant differences between the Heikin-Ashi and the traditional candlestick charts , although others differences are that;
- The Heikin-Ashi chart is smoother than the traditional candlestick chart
- The Heikin-Ashi chart candles colours rarely change unless there's a trend change but the traditional candlestick candles changes in between strong trends.
- The Heikin-Ashi candles are gotten from calculations meanwhile the traditional candlestick makes use of the close price to start the next candle.
THE HEIKIN-ASHI FORMULA
As I had previously stated that the Heikin-Ashi candles are gotten from a formula. Here, we'll take a look at how the open , close, high and low of a candle in the Heikin-Ashi are calculated.
OPEN:
The open of a candle is calculated using the opening and close values of the previous candle. It is the average value of the open and close values of the previous candle.
Open = (previous open+previous close) ÷ 2
CLOSE:
The close is calculated using the average of the open ,close ,high and low values of the current candle. The formula is given by:
Close = ( open + close + high + low of current candle) ÷ 4
HIGH:
The high doesn't require calculation as it is the maximum value of either the high,open or close points of the current candle. The formula is given by;
High = maximum value of high, open or close of current candle
LOW:
Like the high, the low too doesn't require calculation as it is the minimum value of the low , open or close of the current candle. The formula is given by;
Low= minimum value of low,open or close of current candle.
TRENDS AND BUYING OPPORTUNITIES THROUGH HEIKIN-ASHI CANDLES
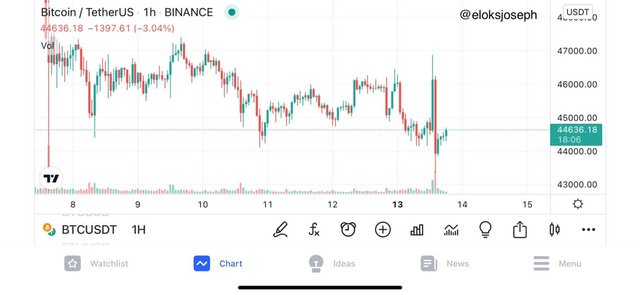
Identifying trends using the Heikin-Ashi is really easy as the candles doesn't change util there's a clear and obvious change in the market. So most times on the chart, you'll either see a long run of green candles or long run of red candles.
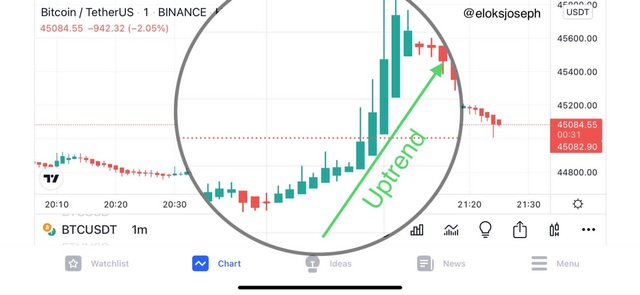
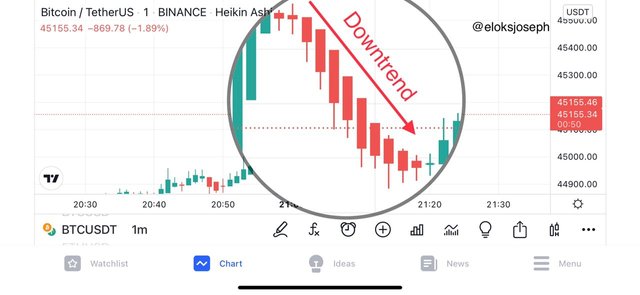
When there is a long run of green candles , it is often a bullish trend and the candles have their wicks above the candles. On the other hand when there is a bearish trend, there is a long run of red candles with the wicks hanging below the candle. Let's take a look at them on the chart.
Screenshot from tradingview mobile app
Screenshot from tradingview mobile app
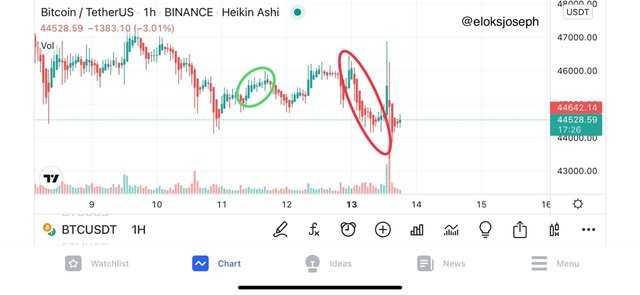
From the two screenshots above, we can see that the trends are easily identified with the candles. Now let's see how we can use the Heikin-Ashi candles to get buy and sell opportunities.
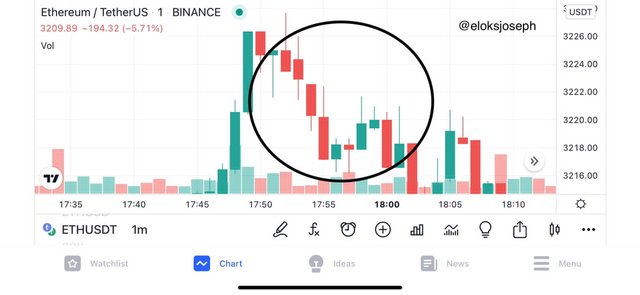
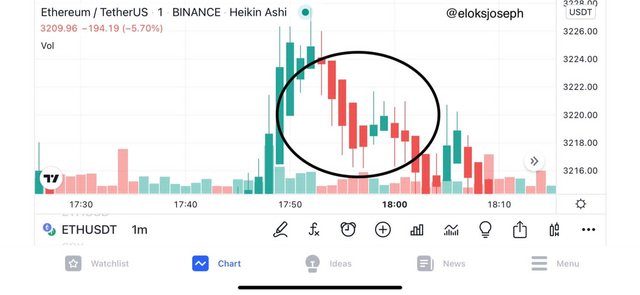
Screenshot from tradingview mobile app
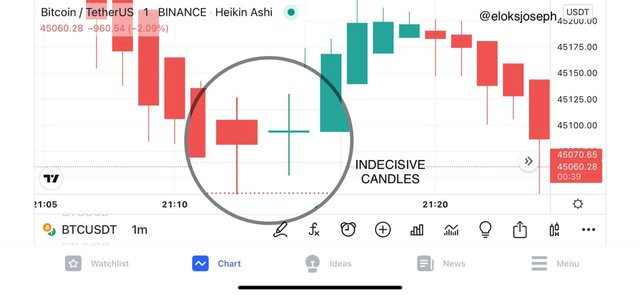
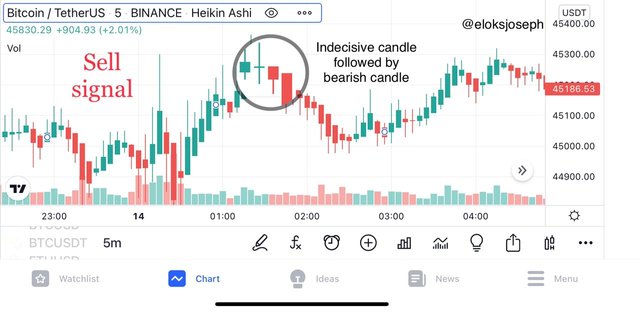
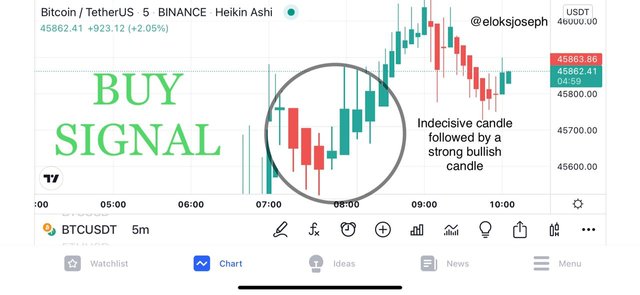
From the screenshots, we can see that the uptrend candles have it's wick above the candles while the downtrend candles have their wicks below the candles. That brings to question, what about the candles with wicks on both ends. These are called indecisive candles. These indecisive candles are what gives buy and sell signals . When a bullish candle comes after an indecisive candle , it is a buy entry opportunity. On the other hand when a strong bearish candle comes after an indecisive candle, it is a sell signal.
Screenshot from tradingview mobile app
Screenshot from tradingview mobile app
IS IT POSSIBLE TO TRANSACT ONLY WITH SIGNALS RECEIVED USING THE HEIKIN-ASHI TECHNIQUE? EXPLAIN THE REASONS FOR YOUR ANSWER.
I'll say no. It is not possible to transact only with the signals gotten from the Heikin-Ashi. This is due to a lot of reasons. First is the way the process of assets behaves. The Crypto currency market is a very volatile one so trading with just one technique is not effective. No technique should be used alone and it is always best to combine it with other techniques and indicators.
The Heikin-Ashi technique often represents current trend clearly but it doesn't have the ability to show when the market is overbought or oversold and so even if we see an indecisive candle which is then followed by a bullish candle and it is in the overbought position let's say RSI of 85. Here the Heikin-Ashi shows that it's a good buy entry but it doesn't show that the market is seriously overbought and could reverse at any point in time.
The Heikin-Ashi is a great technique in trading but it cannot be used to make transactions on it's own. It should be combined with other indicators as no single indicator is 100% efficient.
DEMO TRADES USING THE HEIKIN-ASHI TECHNIQUE WITH THE 21EMA AND 55 EMA
In this section,I'll be making two demo trades - buy and sell positions.
- BUY:
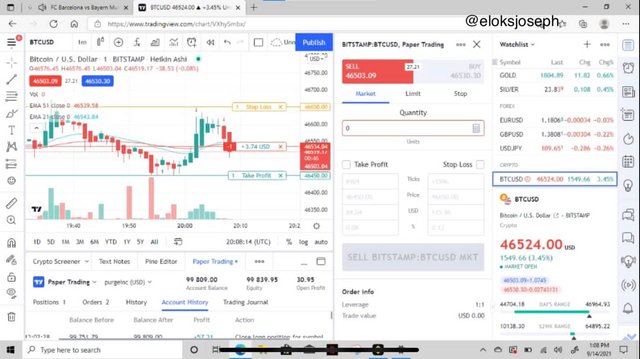
The market was undergoing a downtrend and at a point there was the creation of an indecisive candle which was followed by a bearish candle. Now I should have placed a sell order there but I noticed that the 2 EMA was setting up for a golden cross so I waited for the next few candles and behold green candles started forming so I placed a buy order.
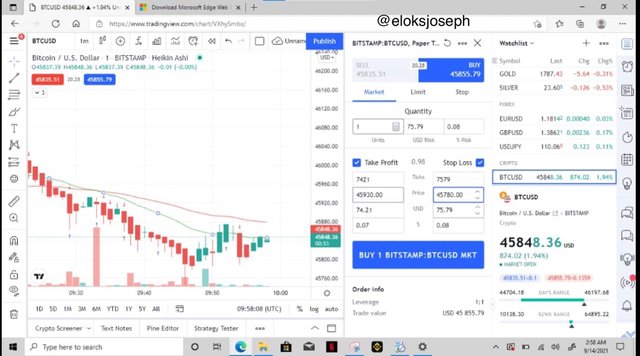
Screenshot from tradingview.com
Here's a screenshot of the trade when it was still in showing the take profit ,stop loss positions :
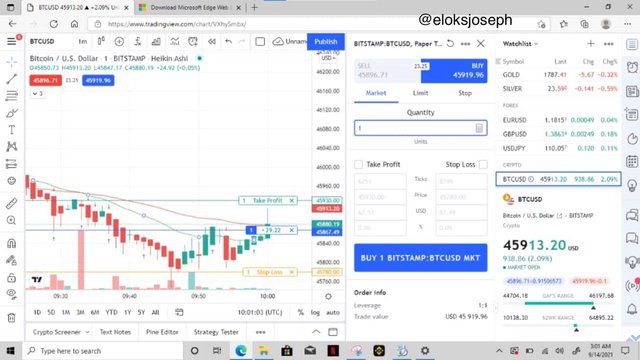
Screenshot from tradingview.com
At the end of the trade, this is my profit:
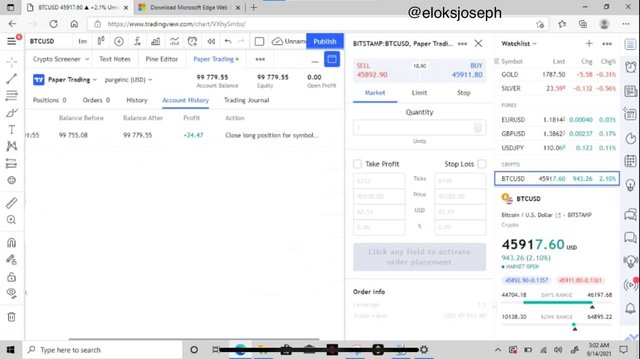
Screenshot from tradingview.com
Next we move on to the sell entry.
- SELL:
I monitored the market for a couple minutes and waited till the EMA crossed each other. After they did, I saw an indecisive candle which was the followed by a bearish candle. I quickly placed my sell order and waited for the to go down a little bit more.
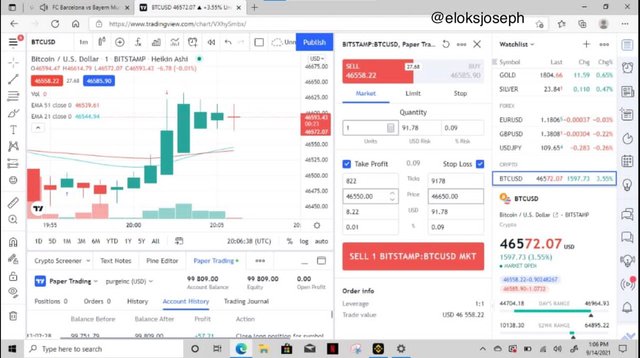
Screenshot from tradingview.com
This is a screenshot of the trade while it was still active. Here you can see my stop loss and take profit points.
Screenshot from tradingview.com
At the end of the trade , here is my profit.
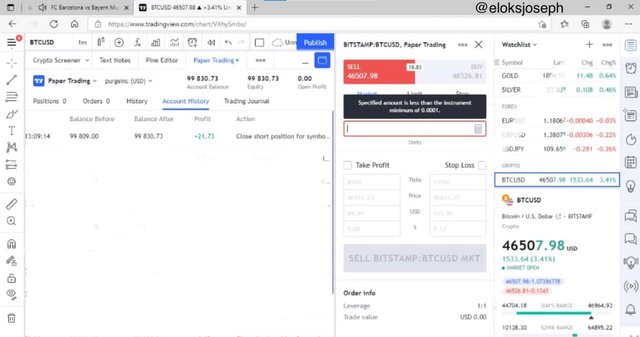
Screenshot from tradingview.com
CONCLUSION
The Heikin-Ashi is a really unqie and great way of representing market price on a chart as it helps in giving the direction of the market price. It also gives entry points for trades and shows the market trend .
Although it is a great technique, like every other trading technique, it should be combined with other indicators for more efficient trades.
Thank you for the lecture professor @reddileep . It was great learning about this new technique.
CC : @reddileep