Crypto Academy Season 3 | Intermediate Course: Crypto Assets and the Random Index (KDJ)
INTRODUCTION
Hi guys welcome to steemit crypto academy season 3 week 8 . Today , I'll be making a post based on the lecture given by professor @asaj on the RANDOM INDEX or better srilk the KDJ INDICATOR.
1.) In your own words define the random index and explain how it is calculated
2.)Is the random index reliable? Explain
3.)How is the random index added to a chart and what are the recommended parameters? (Screenshot required)
4.)Differences between KDJ, ADX, and ATR
5.)Use the signals of the random index to buy and sell any two cryptocurrencies. (Screenshot required)

THE RANDOM INDEX INDICATOR
The random Index indicator, also known as the KDJ indicator is a technical indicator used by traders in determining when the market is in the overbought or oversold position. It can also be used to determine the current market trend.
The KDJ indicator consists of 3 lines ; the K,D,and J lines. The most significant of the 3 lines is the J line. The J line is responsible for showing the displacement of the K and D line form each other. The K and D lines function similar to the stochastic oscillator. The combination of these 3 lines are what forms the random Index.
The KDJ indicator is a dynamic indicator as it can also give certain buy and sell signals using the position of the K,D,and J lines. The random Index indicator also contains a range from 0 to 100 like the RSI indicator. Unlike the RSI where the oversold levels and over bought levels are at 30 and 70 respectively, the KDJ indicator uses more extreme levels at 20 for oversold and 80 for overbought.
HOW TO CALCULATE THE RANDOM INDEX
Due to the advancement of technology ,the calculation of the random index is done automatically by the exchange platform in which you’re trading although it can be calculated manually. The calculation of the random index is done using 3 very important information; the lowest price of the day,the highest price of the day and the closing price. Another important thing we need to calculate is the reserve value of the day and it is given by;
- RESERVE VALUE: [(Close - Low)/(high -low) ] x 100
Note; The reserve value is always within the range of 1-100
Now let’s see how to calculate the K,D and J lines.
K line value for the day = (2/3 X previous day K value)+ (1/3 X RSV of the day)
D line value of the day= (2/3 X previous day D value) + (1/ 3 X K value of the day)
The calculation of the J line uses the value of both the K and D line values.
- J line value= (3 X day K value) - (2 X da D value)
The combination of these 3 lines forms the Random index indicator.
RELIABILITY OF THE RANDOM INDEX
It should be known that every indicator is not 100% efficient and shouldn’t be totally relied upon as there might often be false signals in some cases. Even with the uncertainty indicators suffer, the KDJ indicator should be held in high regard as it often shows the market price position, whether it is undervalued or over valued. It also shows the current market trend and can also be used to predict market price.
Some signals that can be read from the Random Index indicator include ;
OVERSOLD SIGNALS:
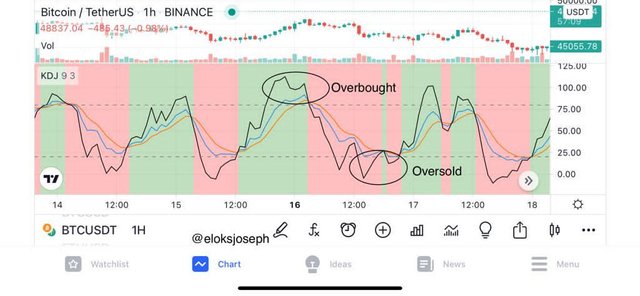
When the J line is below the 20 line on the chart,it indicates that the price of the asset is underpriced and under valued. Below the 20 level, the market is under a probability of reversing and entering into an uptrend. At this point,most investors like to get into the market so they can fork out maximum profit.
OVERBOUGHT SIGNALS:
When the J line is above the 80 level, it is in the overbought position . That is , the price of the asset is overpriced and investors sell off their assets at this level , causing a reversal of the price and possiby leading to a downtrend.
* * *
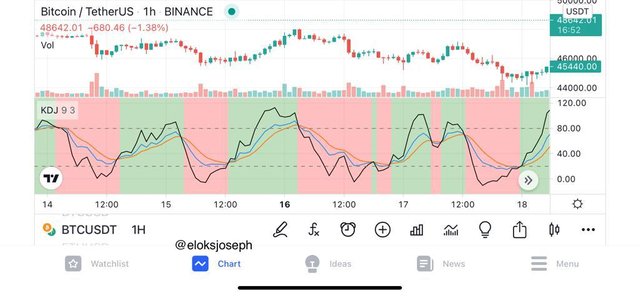
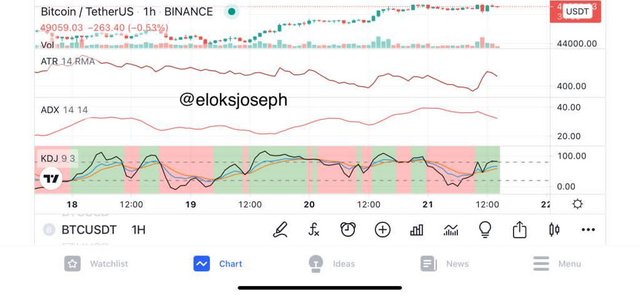
From the screenshot above, the overbought and oversold positions are clearly shown. From the chart, it can be seen that a downtrend often occurs after the price of the asset leaves the overbought position and an uptrend ensues after the market price leaves the oversold position. That said, let's look at other signals provided by the KDJ indicator.
* * *
UPTREND SIGNAL;
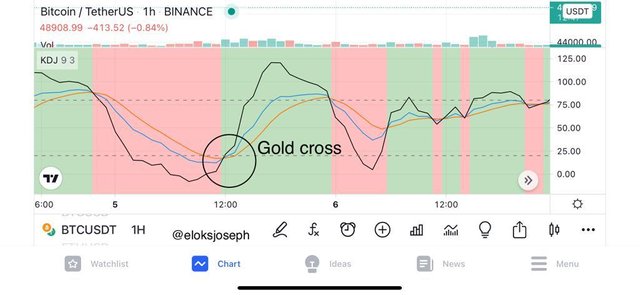
When using the KDJ indicator , we might often notice situations where the J line crosses the K and D lines. When the J line crosses the K and D line from below in an upward movement, it often serves as an uptrend signal. This can happen in any position in the chart but it often happens in the lower positions of the chart.
* * *
A special case can occur when the J line crosses the K and D line below the 20 level and this leads to a special uptrend signal called the GOLDEN CROSS OR GOLDEN FORK.
DOWNTREND SIGNAL:
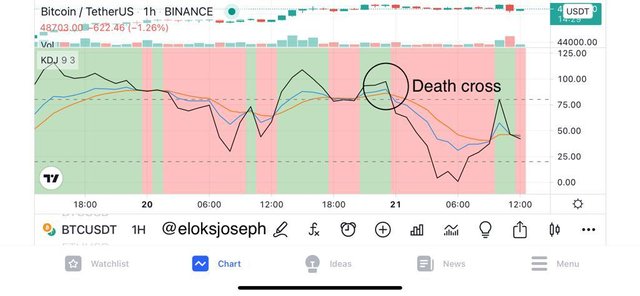
On the other hand, when the J line crosses the K and D line from above, it is a downtrend signal and an indicator that market price would drop. It often happens in the upper positions of the KDJ chart.
* * *
As in the case of the uptrend signal, when the cross happens above the 80 level, it is called the DEATH CROSS OR DEATH FORK. This signifies a strong downtrend.
* * *
It should be noted that no indicator is 100% efficient, hence , the KDJ indicator should be combined with other indicators like the ADX and ATR indicators amongst others.
HOW TO ADD KDJ INDICATOR TO THE CHART AND RECOMMENDED PARAMETERS
In this section, I'll be showing how to add the KDJ indicator to the chart in trading view.
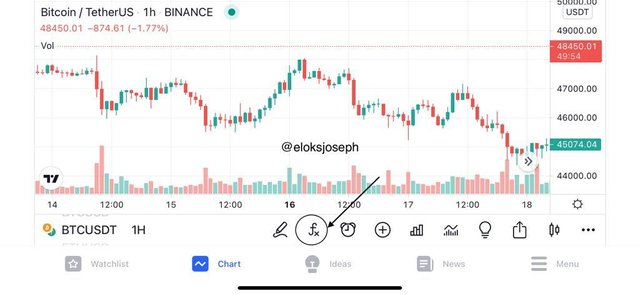
First , you should click on a chart of your choice. I'll be using BTC USDT chart.
Then click on the Fx tab
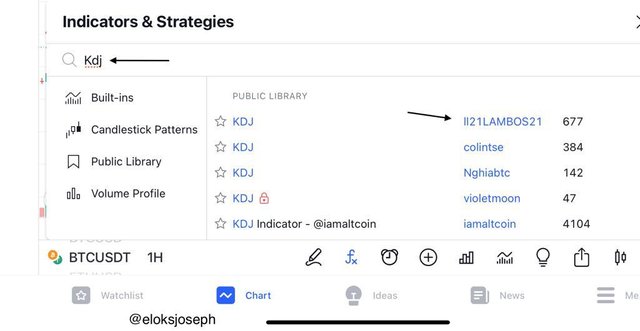
- Search for the KDJ indicator and then click on the one modified by "ll21LAMBOS21".
- The KDJ indicator is now added successfully.
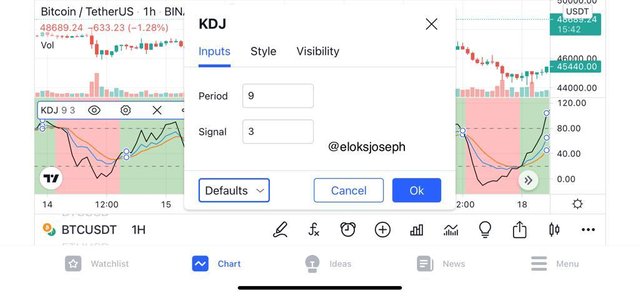
- You can change the settings and modify the looks of the KDJ indicator but it is best kept as the default settings done by the trader "ll21LAMBOS21"
DIFFERENCES BETWEEN KDJ, ADX, AND ATR
Since we have an underlying knowledge alresd about the KDJ indicator, let's talk a little about the ADX and the ATR indicators.
- ADX;
This fully means average directional index. It is an indicator used to determine the trend strength of a market. It is ranged from 0 to 100.This range is further divided into 4 to give the trend strength.
0-25 : no trend in the market
26-50 : a normally trending market or the start of a new trend.
51-75: strong trend
76-100: extremely strong trend
- ATR
The average true range indicator is an indicator which shows the volatility of a market. It shows the volatility of the market using a single line. It is very good for calculating stop loss when trading.
| FEATURE | KDJ | ADX | ATR |
|---|---|---|---|
| TREND | shows the current market trend | measures trend strength | measures volatility of market instead |
| Overbought/oversold | shows both positions | doesn't show overbought or oversold position | doesn't show overbought or oversold position |
| Number of line | 3 lines Indicator | 1 line indicator | 1 line indicator |
LIVE TRADE USING THE KDJ INDICATOR
In this section, I'll be making 2 trades using the signals given by the Random Index indicator.
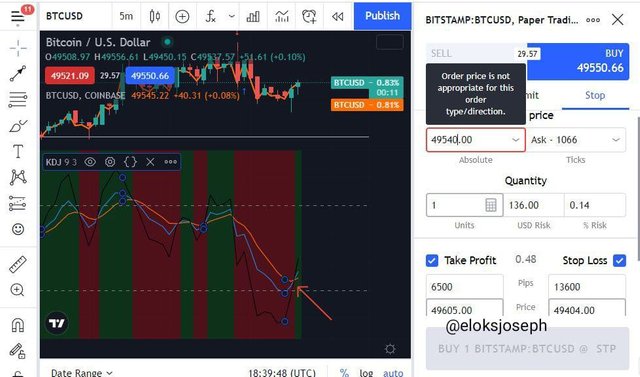
- BUY :
After monitoring the market for a while, I set my stop loss and take profit levels.
After the trade, my profits ;

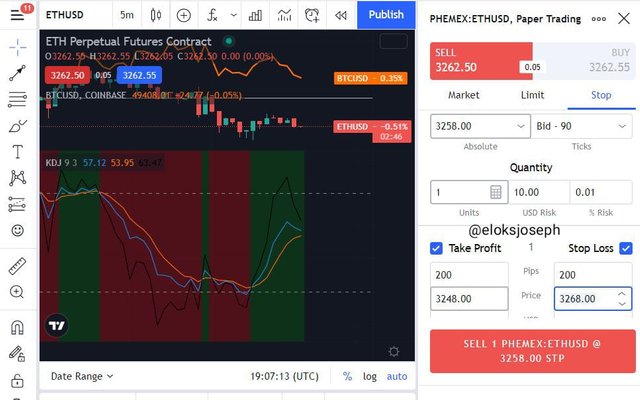
- SELL:
After monitoring the market and using the KDJ indicator, I waited for a death cross signal and then placed my trade. I set my stop loss and take profit
Here are my profits after the trade:

CONCLUSION
The random Index indicator is a very practical indicator utilized by traders. It gives great entry and exit signals using the position of the J line.
The random Index indicator also shows when the market is overbought or oversold. The random Index indicator when combined with the indicators like the ADX and ATR indicators for more solid signals .
Thank you great professor @asaj for the lecture.
Good job @eloksjoseph!
Thanks for performing the above task in the eighth week of Steemit Crypto Academy Season 3. The time and effort put into this work is appreciated. Hence, you have scored 7 out of 10. Here are the details:
Remarks
Overall, you have displayed a good understanding of the topic. You have performed the assigned task excellently. However, your work could benefit from more research.
That said, this is good work. Thanks again for your contributing your time and effort to the academy.