Crypto Academy Season 03 - Week 08 | Advanced Course - Trading Sharkfin Pattern by @eloksjoseph
INTRODUCTION
Hi guys , welcome to the last week of steemit crypto academy season 3!!! It has been a long run of learning and posting. Today I'll be making a post on the sharkfin pattern based on the lecture given by professor @cryptokraze.


1 - What is your understanding of Sharkfin Patterns. Give Examples (Clear Charts Needed)
2 - Implement RSI indicator to spot sharkfin patterns. (Clear Charts Needed)
3 - Write the trade entry and exit criteria to trade sharkfin pattern (Clear Charts Needed)
4 - Place at least 2 trades based on sharkfin pattern strategy (Need to actually place trades in demo account along with Clear Charts)
THE SHARKFIN PATTERN
The sharkfin pattern is a market reversal pattern that involves the price of an asset quickly changing it's direction. This rapid change in direction often forms some.kind of V shape or a sharkfin shape thereby getting the name SHARKFIN PATTERN.
The sharkfin pattern is really easy to spot in trading chart is it involves a market reversing back quickly and changing trend . The sharkfin pattern can be in 2 forms. It could either be facing downwards as an inverted v (^) or it could be a normal v shape.
This quick reversal that results in the sharkfin pattern is caused by the buy and sell orders placed in the market . It also occurs when a market undergoing a strong trend can't break out of a strong level of support or resistance.
Let's take a look at some sharkfin patterns on the chart.
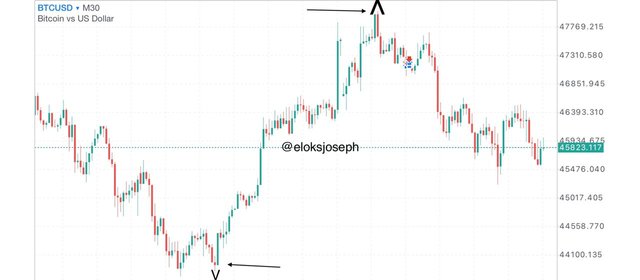
BTC/USD 30 minute chart
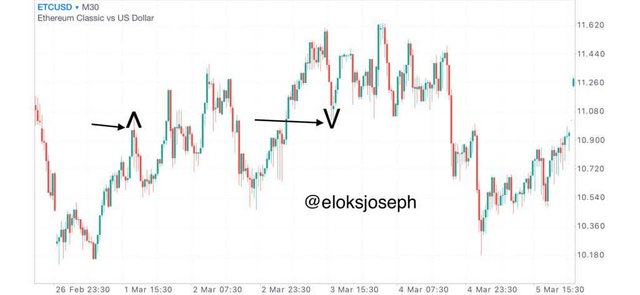
ETC/USD 30min chart
To be able to properly trade the sharkfin pattern,we would need the helo of indicators which shows the current trend if the market like the moving averages or Indicators that show if a market is in overbought or oversold position like the RSI.
SHARKFIN PATTERN AND THE RSI
The Relative strength index graph uses the historical data of a chart to show if the market is in an overbought or oversold position. It should be known that it is at these positions that possible reversals are bound to happen , therefore , combining the RSI with a chart to read the sharkfin pattern is a very wise strategy.
When the RSI graph is above the range of 70, it is in the overbought position and there is possible chance for a upward reversal. To get a valid sharkfin pattern in an overbought position, two things must occur:
The market should undergo a rapid reversal
The RSI graph should go above the 70 range level and then quickly reverse out of it.
Conversely,when the RSI graph is below the range of 30, the market is in oversold position and there is possible chance for a downward reversal. To trade a valid sharkfin in oversold position,two things must occur:
The market should undergo a rapid reversal
The RSI graph should go below the 30 range level and quickly reverse out of it.
Some chart examples include;
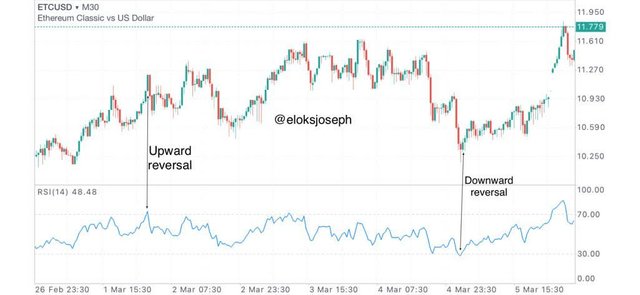
ETC/USD 30 min chart
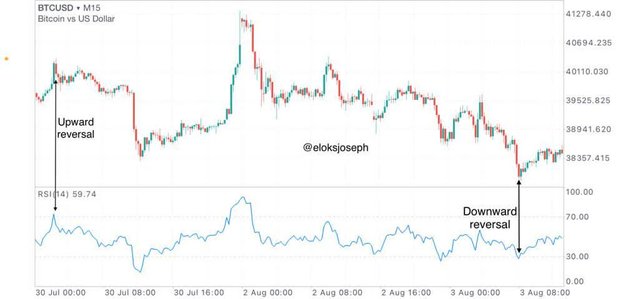
BTC/USD 15 min chart
From the charts above , I have identified valid sharkfin patterns as the prices of the asset quickly reversed out of their corresponding RSI levels.
TRADE CRITERIA FOR SHARKFIN PATTERN
You can trade the sharkfin pattern with the help of the RSI graph. In this section, I'll show the criteria for trading the sharkfin pattern on both buy and sell positions.
TRADE CRITERIA FOR BUY POSITION
To trade the sharkfin pattern in a buy position is really easy . Here are the steps ;
ENTRY
First and foremost, you need to add the RSI graph to your chart on a period setting of 14 and and set your levels to 30 and 70. For the buy position, you'll be making use of the 30 level.
The next thing is to monitor the market for an downward reversal i.e the price should make a rapid change from going down to going up.
Check your RSI graph and check if it quickly went below and immediately above the 30 level. This should form a v shape or sharkfin pattern.
Place your trade when the RSI graph has reversed clearly above the 30 level.
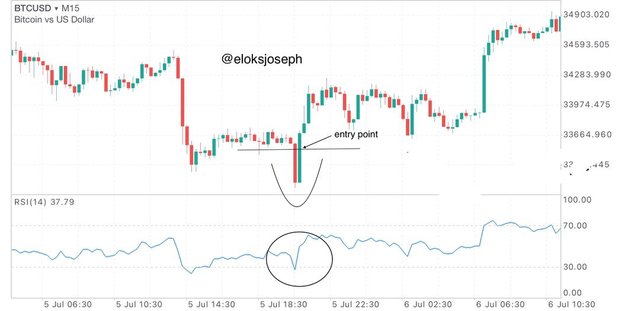
BTC/USD 15 min chart
There are some important things to note which include;
- Don't enter the trade if the RSI doesn't go below the 30 level no matter how close it is to the level as it might not a valid entry signal.
Also , if the graph doesn't reverse quickly out of the RSI graph, it is advisable not to enter the trade.
If a quick reversal has occured, don't jump into the trade. Ensure the RSI has clearly left the 30 level as in the screenshot above.
EXIT
Since we have successfully established how to enter a trade using the sharkfin pattern in the buy position. Now let's look at the exit requirements.
- First you have to consider your risk management, that is , setting your stop loss, take profit and also picking the risk reward ratio you'll be trading with .
- Setting our stop loss is very important as it helps prevent excessive loses. The stop loss should be set at the swing low point of the v pattern. That is the lowest point at the reversal.
- Next is to think of our risk reward ratio. If you're new to this trading strategy, it is best to trade at the 1:1 . That means for every amount if money you trade, that is the amount of profit you'll get back. Meaning if I trade $10 , I'll get about $10 back if the trade goes as planned.
- Since we've determined our risk reward ratio to be 1:1 , then our take profit would be the exact distance that our stop loss is from our entry point ,giving it that 1:1 setting.
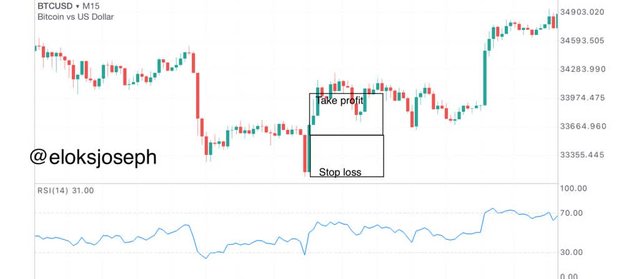
BTC/USD 15 min chart
From the chart above ,we can see that our stop loss was set at the lowest swing point made in the v pattern and the take profit level is at the same distance from the entry point as the stop loss.
We can also see from the chart above that if we had traded that pattern, the trade would have ended in profit.
Now that we know how to trade the sharkfin pattern in the buy position. Let's see how to trade in the sell position.
TRADE CRITERIA FOR SELL POSITION
ENTRY
As we did when talking about the buy entry , we would also need to add the RSI graph to the chart.
After adding the chart, wait and watch the market for an upward reversal. That is , the market price making a rapid change from upward to downward. The price pattern on the chart should make an inverted v shape.
Consequently, chek the RSI graph if the level crosses below the 30 level and quickly reverses back. It should form an inverted v shape.
Place your entry when the RSI is clearly out of the 70 level.
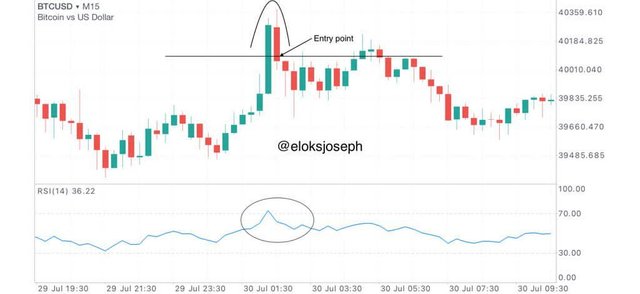
BTC/USD 15 min chart
When making an entry be sure not to make the following mistakes;
Don't jump into the trade too early. Make sure that the RSI has crossed below the 70 level clearly before entering the trade.
If the market doesn't reverse immediately, don't enter the trade.
The the RSI just touches the 70 level but doesn't cross it and make a reversal, don't enter the trade.
Let's take a look at the sell exit criteria;
EXIT
We'll be looking at how to set the level for our stop loss and our take profit.
Your stop loss should be set at the previous swing high point of the market. That is,the highest point the market got to before it's reversal.
Your take profit should be in the 1:1 risk reward ratio with your stop loss. That means that your stop loss and take profit should be in the same cost ratio. For every capital you risk,it's the same amount you're liable to earn.
An example is illustrated in the chart below:
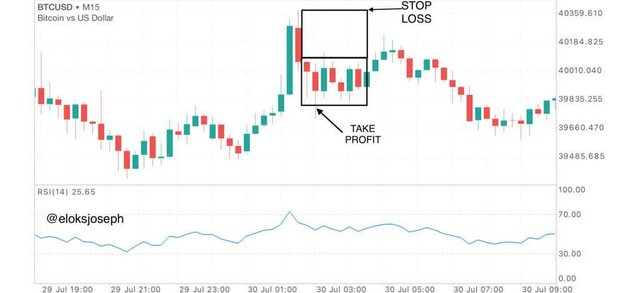
BTC/USD 15 min chart
From the chart above, our take profit and stop loss are in the ratio 1:1 . We can also see that it would have been a successful trade as the market hit our take profit before continuing in it's trend.
LIVE TRADES USING THE SHARKFIN PATTERN
In this section I'll be performing two trades. One in the buy position and the other in the sell position.
LIVE TRADE OF THE SHARKFIN PATTERN IN BUY POSITION
Since we've already gone through the criteria, I'll be going straight to the point. I've bee monitoring the market for quite a while and when it broke below the RSI 30 level I watched closely as it quickly reversed out of it. I waited patiently for the RSI to clearly come out of the 30 level before placing my trade.
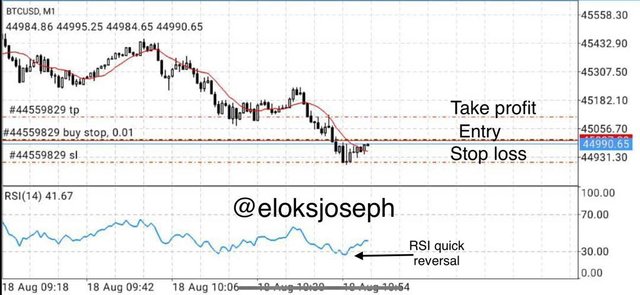
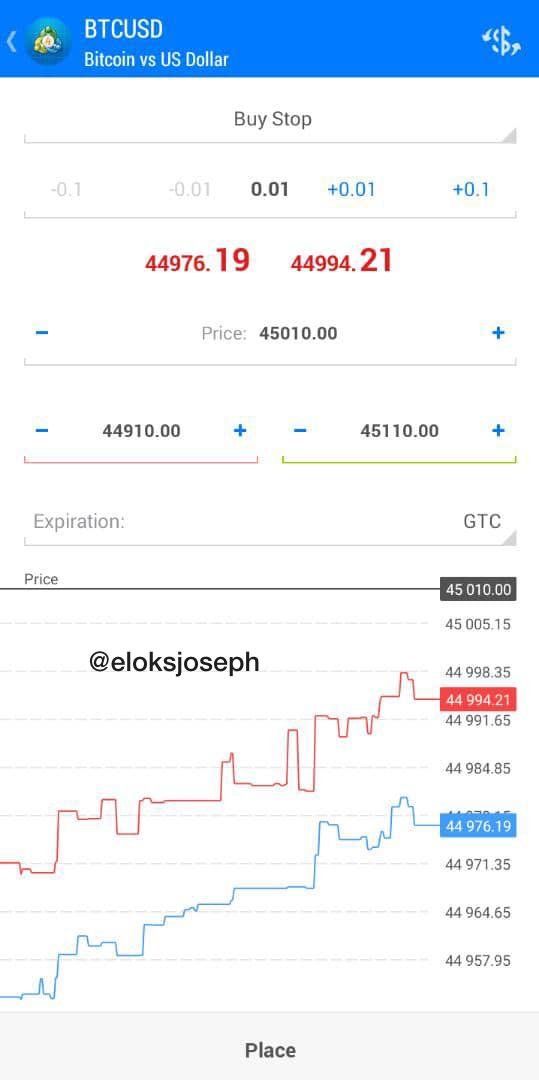
I placed the trade using the buy stop order and I set a stop loss and a take profit using the 1:1 risk reward ratio.
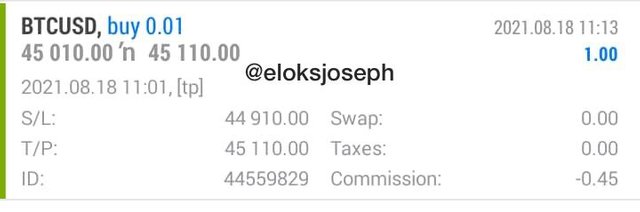
At the end of the trade , this is my profit made.
Now let's look at trading from the sell position.
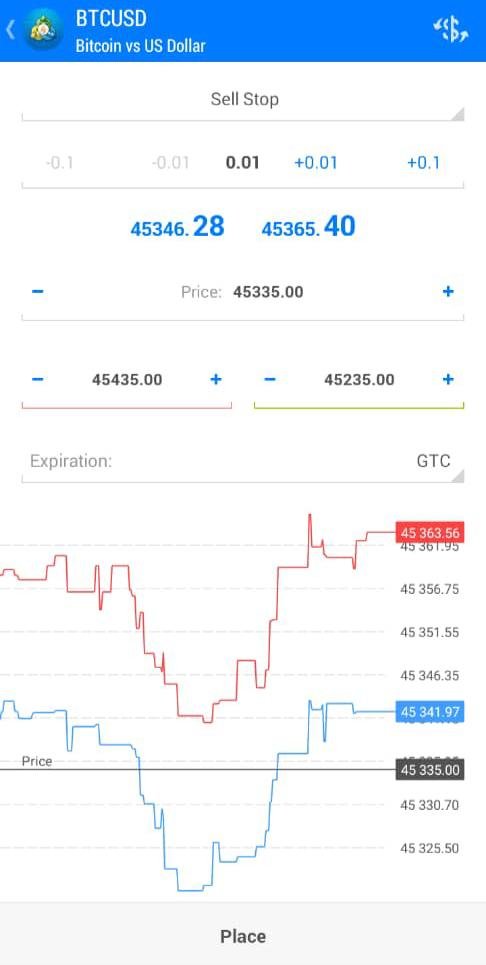
LIVE TRADE OF THE SHARKFIN PATTERN IN SELL POSITION
Here too, I monitored the market a while and waited for it to cross the 70 level in the RSI graph. After a quick reversal, I placed the trade using my sell stop order.
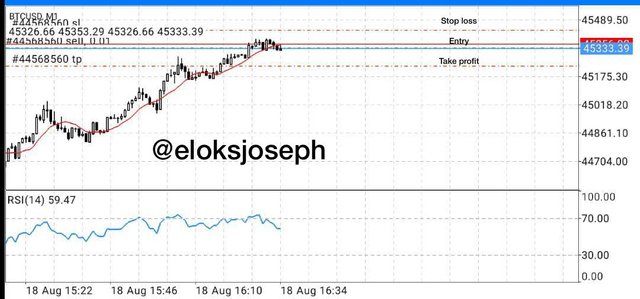
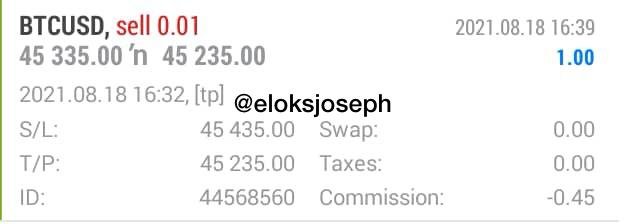
I set the stop loss and take profit in the ratio 1:1 of the risk reward and waited for the trade to complete.
At the end of the trade, these are my profits;
CONCLUSION
The sharkfin pattern is a trading strategy that is easy to use and can be utilized by every trader, both professional and beginner . It involves combining chart patterns with the RSI graph.
Picking the proper entry and exit points using this strategy would prove to be very profitable as it is not complicated.
Thank you professor @cryptokraze for the lecture.
Screenshots are from metatrader 4 and 5
Dear @eloksjoseph
Thank you for participating in Steemit Crypto Academy Season 03 and making efforts to complete the homework task. You got 7/10 Grade Points according to the following Scale;
Key Notes:
We appreciate your efforts in Crypto academy and look forward for your next homework tasks.
Regards
@cryptokraze
Thank you for your kind review professor, I'll do better next time