Crypto Academy Season 2 Week 4 – Homework Post for @kouba01 | Cryptocurrency Trading with RSI
Good day everyone, I trust we are all vibrant in this new week. In today’s writeup, I’d be answering the questions given by professor @kouba01 for the Steemit Crypto Academy homework. First, I’d look into the meaning of RSI, the trustability and how to configure it on a crypto chart. Still on the assignment, we’d look at interpreting overbought and over trade signals, then filtering true signals from false signals.

What is the Relative Strength Index - RSI and How is it Calculated?
In simple terms, the Relative Strength Index (RSI) is a specialised tool that used to perform technical analysis. It helps the trader to predict trends based on the current situation of the market. The phenomenon was initially applied to stocks, as it was used to study the performance of stocks.
The Relative Strength Index (RSI) measures the velocity and magnitude of change in price of a crypto asset. Hence, in is an important tool in the hands an experienced technical analyst. While the phenomenon was started by Willis Wilder, it is currently used around the world today.
When the price of a token is fluctuating, RSI helps to measures the rate of change. The RSI chart shows when there is an increase and reduction in selling pressure. It also shows when many people are buying.
The RSI also help traders predict price movements by showing overbought and oversold signals. An RSI value for a digital asset is usually between 0 to 100. When it falls below 30, it indicates an asset was overbought. On the other hand, when it goes above 70, it indicates that it was oversold. That helps a trader see the bottom and market high within the defined period.
Traders also study RSI to determine bearish and bullish market trends. For example, an RSI above 50 may indicate a bullish market, whereas an RSI below 50 indicates a bearish market.
How is RSI Calculated?
The Relative Strength Index (RSI) can be determined using the formula below;
RSI = 100 - 100 / (1 + RS)
While RS = Average Gain / Average Loss
From the formula above, you’d notice that the RS is a ratio of the average gain to average loss over a given time period. In order to get the average, the different gain values for 14 days are computed against loss values for 14 days.
Note that the value for RSI lies between 0 and 100.
Can we trust the RSI on cryptocurrency trading and why?
There are no certainties in life. Hence, I can not say we can absolutely trust RSI on cryptocurrency trading. That does not in anyway water downs the importance of using RSI when trading. Just the way an experienced cook includes a spice that improves the taste food, an experienced trader use RSI to determine the best time to buy or sell crypto.
As a friend would say, it simply serves as an indicator, you have to do the rest of the decision yourself. It’s best to use RSI to find divergence, and then determine if the trend would continue or change its course. Traders that use RSI often use it along with other indicators. It is not common to find a trader that relies on RSI solely. Indicators like RSI are best used to support one’s decision.
Nevertheless, I would never advice anyone to rely on just RSI.
How do you configure the RSI indicator on the chart and what does the length parameter mean? Why is it equal to 14 by default? Can we change it? (Screen capture required)
For the purpose of this task, I’d be using the Binance app. Normally, I’d use TradeView for this, but I’d like to teach others how to configure RSI on Binance.
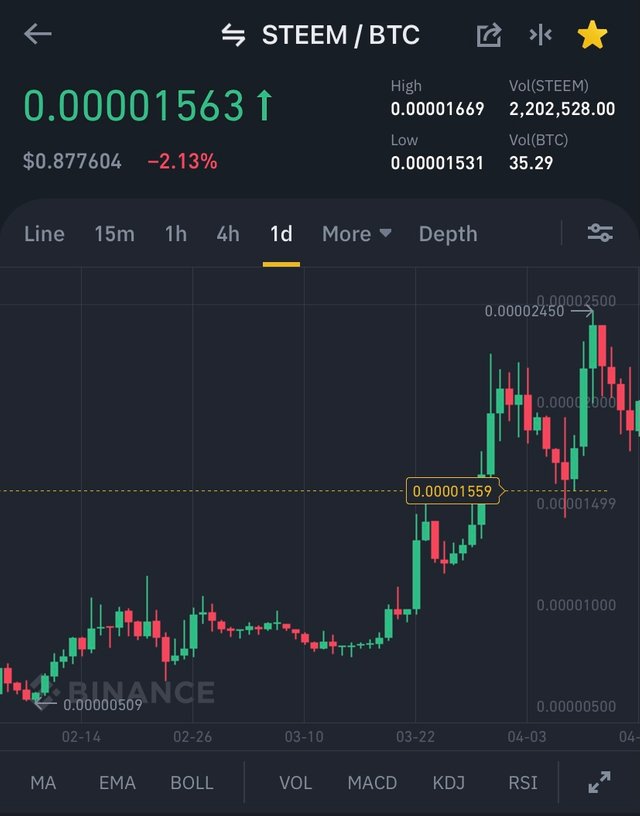
- First, select the STEEM/BTC Pair. Click on the settings icon on the top right corner of the charge.
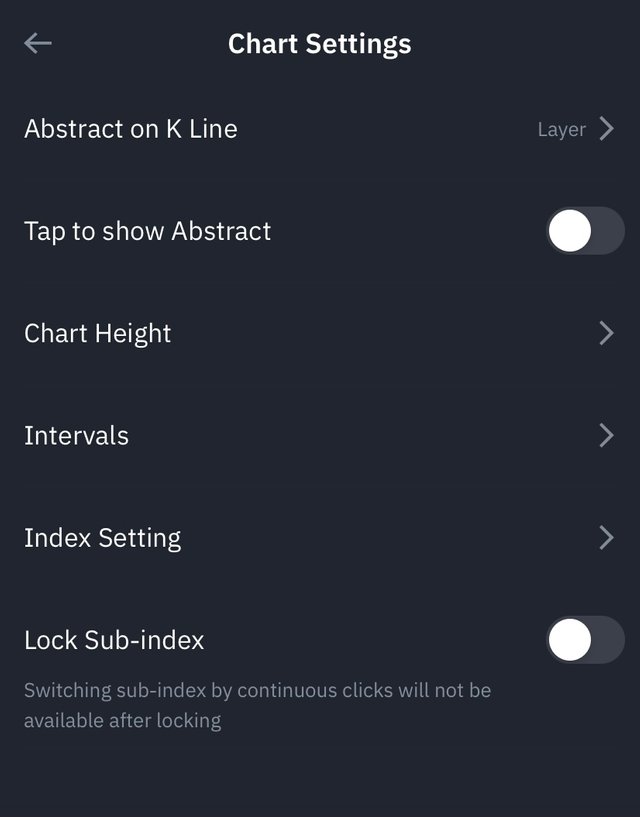
- Click on Index Settings
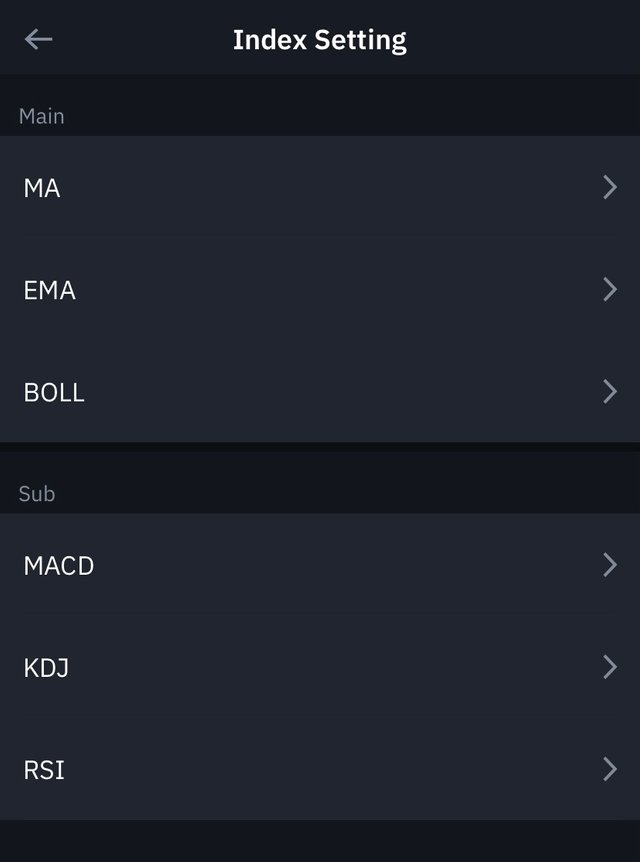
- Click on RSI
- Edit RSI Value
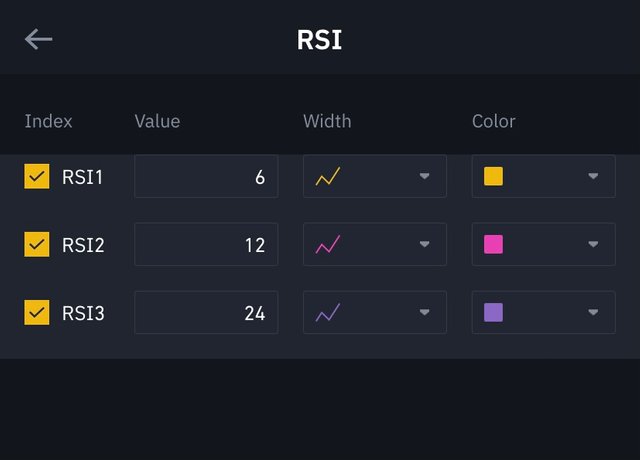
Here you’d notice that there are 3 RSI values for the period of 6, 12 and 24 days. This is used to compare the RSI values for 1 week, 2 weeks and 4 weeks respectively. Hence, you can determine if you oversold or overbought in 3 different period.
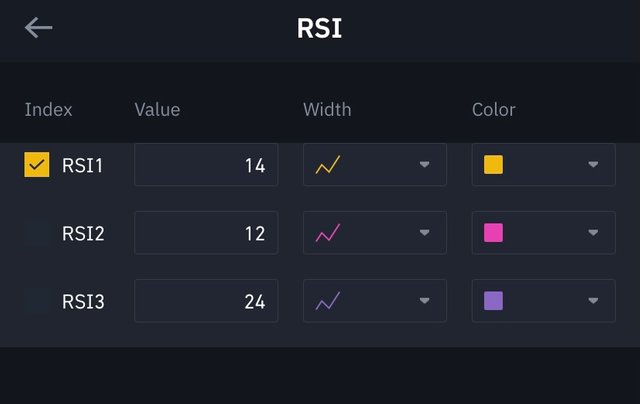
Nonetheless, for the purpose of this analysis we’d be using 14 days period. So I edited the first RSI value from 6 to 14. And I unchecked the other two RSI values.
- The next is to save the settings.
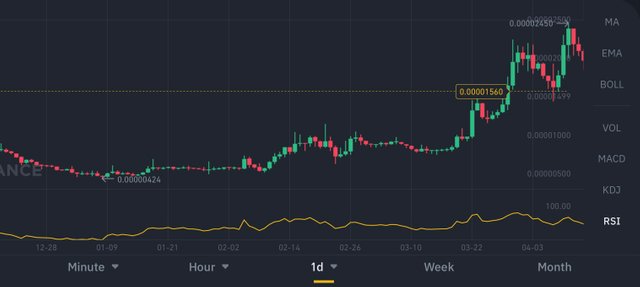
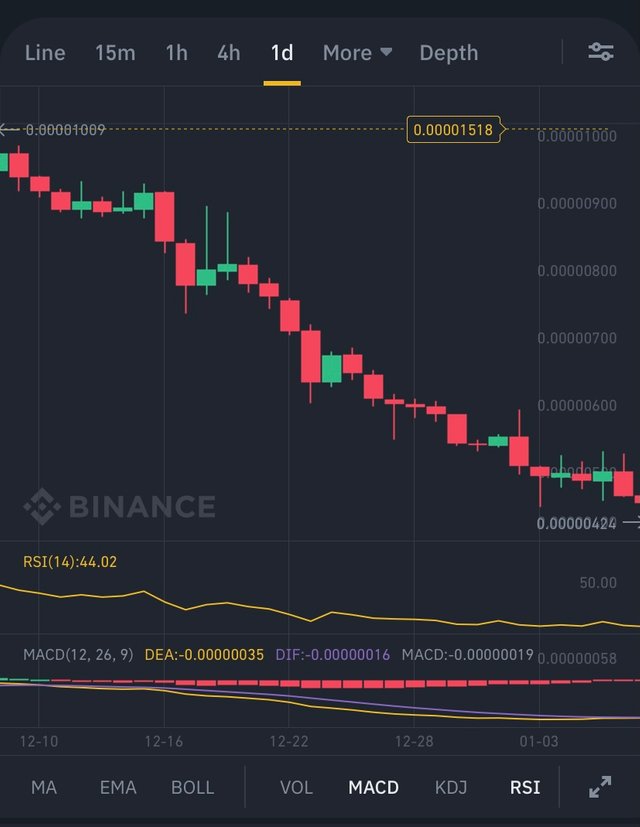
- Ensure to click on RSI at the bottom right. Now, the yellow line displays the RSI value.
Why is it equal to 14 by default? Can we change it? (Screen capture required)
In most trading charts, like the one in TradingView, RSI is 14 by default. This is because RSI measures the price over periods. So, when 14 is set by default, it means 14 days on a 1d time frame. For a 1h time frame, that is 14 hours.
While 14 periods is set as default on most platform, the Binance app sets 6, 12 and 24 as multiple defaults for RSI. This helps for multiple configuration and assists a trader to get compare different periods on the app.
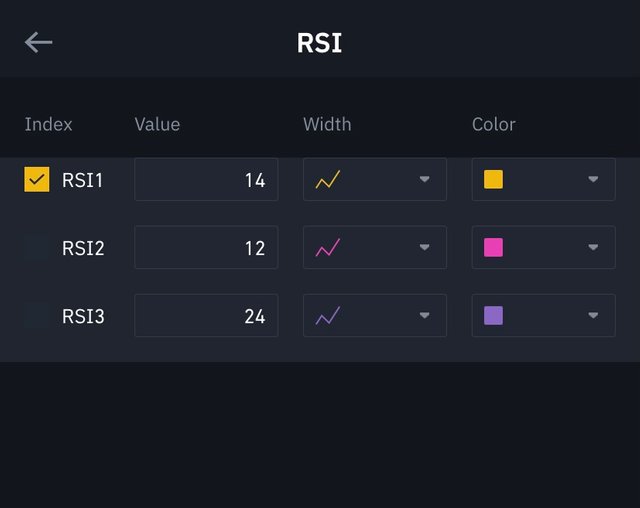
As shown above, the value can be edited to suit the trader’s taste. Irrespective of the period selected, a value below 30 indicates oversold and value above 70 indicates oversold.
How do you interpret the overbought and oversold signals when trading cryptocurrencies? (Screen capture required)

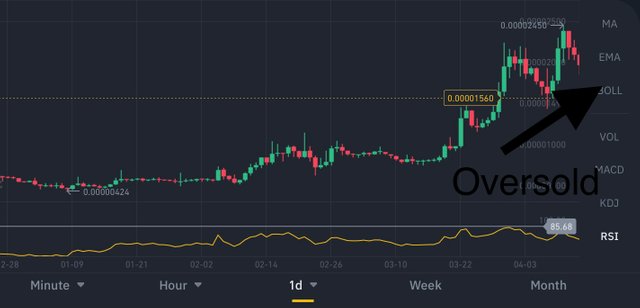
For the graph above, we can see that the RSI value is 85.68. Hence, the value is above 70 and that indicates that the asset was oversold.
We can conclude that on the 22nd of March, 2021, STEEM/BTC pair was oversold on Binance.
How do we filter RSI signals to distinguish and recognize true signals from false signals. (Screen capture required)
One way traders differentiate between true and false RSI signals is to use MACD in combination with RSI. MACD stands for Moving Area Convergence Divergence. On Binance app, MACD can be found close to RSI button.
Comparing both MACD and RSI on the chart above, we can see that both MACD chart and RSI chart are in unison.
The MACD periods can also be edited on the on the Index Settings of Binance App. When MACD and RSI are giving varying values then we can use MACD to filter out the false signals.
As a rule of thumb, the lower the period of RSI the more likely to see more false signals. This is because a lower period only examines the price movement for a few days. Hence, it is best to use a period of at least 14 days. And also use MACD to fish out false signals.
Review the chart of any pair (eg TRX / USD) and present the various signals from the RSI. (Screen capture required)
STEEM/BTC pair on Binance
From the chart of STEEM/BTC above, we can see that the RSI value on the 22nd of March 2021 was at 85.68. That shows it was oversold and is a signal for traders to sell their tokens.
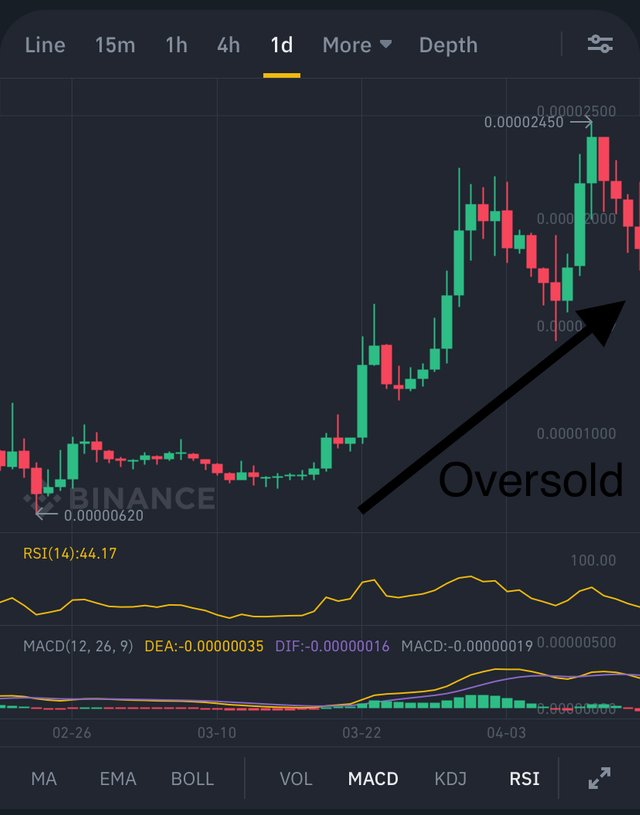
In comparison with MACD, we can see that the RSI chart doesn’t deviate form MACD chart. Hence, no bearish and bullish divergence trends.
Conclusion
When traders add RSI to other signals, they are able to identify movements that are not available on the chart of trading pair. RSI gives a better understanding of uptrends and downtrends. Remember that values above 70 is a signal to sell and values below 30 is a signal to buy. In order to filter out the false signals, it is best to use a period not lesser than 14 and include MACD signals.
Thanks to professor @kouba01 for the interesting homework task.
Hello @eloghosa,
Thank you for participating in the 4th Week Crypto Course in its second season and for your efforts to complete the suggested tasks, you deserve a 5/10 rating, according to the following scale:
My review :
An article of medium content in which you tried to answer the questions asked, where you succeeded in some of them and you were not successful in others. Among the notes I'm listing for you:
Thanks again for your effort, and we look forward to reading your next work.
Sincerely,@kouba01