Crypto Academy Contest / S4W1 - Crypto Market Technical Analysis by @ellabae

Introduction
The crypto currency market is a very lucrative one with trillions of dollars moving about. Because of this fact it has attracted a lot of traders to itself, both experienced and beginners.
One thing that is very noticeable is the crypto currency market is very volatile in nature, it is more volatile than the foreign exchange and stock market. It is good that anyone who wants to perform in this market should have a good understanding of how to operate on it.
I shall be discussing one of the ways to operate in the crypto currency market so as to have a good view on how to approach it.
How would you define Technical Analysis in the Crypto ecosystem?
Technical analysis is a trading method by which a trader analyzes the crypto currency market in such a manner where they focus on price trends and volume of trades.
The main purpose of performing technical analysis is to try to identify opportunities that can arise as the market moves to make profits or reduce risks and also get warning signals which tells you to be careful about a certain trade.
When performing technical analysis, traders make use of charts where they look out for things like historical and recent price movement, area of high volume, support and resistance levels, and the use of technical indicators for more streamlined analysis.
By applying this method of analysis for trading operations, traders can make informed decisions in lieu with their trading strategies.
Mention its Importance
The importance of using technical analysis as a trading method cannot be over emphasized. This is because it's usage in the crypto currency market is very profound.
I shall be talking about some of the importance of technical analysis in the next few lines.
It helps traders get acquainted with the events of the market. Whenever a trader performs technical analysis, he can see first hand the current situation of the market. They can also get to see what has happened in the past.
It makes a trader to be prepared to execute (or leave) a trade. After performing technical analysis, you get signals which gives you clues to enter or exit the market. Through this you get yourself prepared to enter or exit the market.
Technical analysis helps traders spot opportunities easily. By employing technical analysis you can spot trading opportunities in the crypto currency market. These opportunities are always there for the taking.
It is adequate for beginner traders. Technical analysis is a trading method that is suitable for new traders. They can learn it at their own pace and operate in the market within a few months.
It helps traders spot dangers that can arise. When performing technical analysis, there could be dangers that lie ahead that can become apparent. With the help of this, you know how to maneuver you way around in the market.
Do you have practical knowledge of how to conduct technical analysis?
I wouldn't explicitly say I have practical knowledge of conducting technical analysis. Most of what I know about technical analysis is mainly theoretical. I read about them on Steemit and on other online domains.
Notwithstanding, I can try to do a little of analysis with the little knowledge I have gathered up so far. I believe as time goes on I will learn more, but in terms of practical rather than theoretical.
To conduct a simple technical analysis here are some things to do.
1. Try to identify a trend
As the saying goes the trend is your friend. It is the first thing to do when performing technical analysis as you want to know about the trend and it's direction so that you know the appropriate strategy to use.
When the trend is up, the thing to do is to place a buy entry, likewise if the trend is down, place a sell entry.
2. Draw levels of support and resistance
A support level is a level where price fall have a pause because at that point the demand of the asset increases more than the supply, thus leading to a reversal of the movement of the price upwards.
In the same vein a resistance level is one where the price increase have a pause because at that point the supply of the asset increases more than the demand, thus leading to a reversal of the movement of the price downwards.
Knowing these support and resistance levels can lead to trend reversals and breakouts.
3. Having a good basis for entry and exit
After identifying a trend along with support and resistance levels, another important aspect is knowing where to enter and when to exit. You can use a strategy that shows you where there's momentum in the price in the direction that it is moving.
4. Risk and money management
This deals with the size of the position of the entries made and the risk to rewards ratio.
The size of the position is dependent on the capital you have at your disposal. You have to be very careful when choosing so that you don't end up losing all your capital in one trade. The risk to rewards ratio is the amount of capital you set to risk relative to the amount of profit you stand to gain.
The suitable risk to rewards ratio is 1:3.
Highlight some of the components of Technical analysis.
A trader needs to come into the full understanding of the components of technical analysis in order to have a grounded approach. Below are the list of some of the components of technical analysis.
1. The data for price and volume
There are mainly two data sets used in technical analysis, price and volume. These components of technical analysis are very essential because without them no analysis can be done performed.
The price data consist of the price that buyers and sellers have agreed to transact on in real time. The price are tracked and then analyzed in order to gain insight into it's emerging trend.
The volume data measures the degree to which traders play a role in effecting the change of price.
2. A trading chart
A chart is the visual representation of the price and volume data. It is necessary because price and volume data are so large, with thousands upon thousands of transaction taking place everyday. This makes it a very tedious approach to use conventional method to analyze the raw data.
3. Tools & Indicators
A tool or indicator is used to provide insights of price action in a different dimension. An example can be when looking expressly at prices on a chart, it can be difficult to determine trend of the price and the distance it might have moved. But using an indicator can make it easier to get.
Tools such as trendlines, fibonacci retracements are plotted on the charts to help show trends, support & resistance levels, and defined target levels.
What do you understand by technical indicators?
Technical indicators are simply mathematical expression that makes use of price and/or volume to help traders determine if an asset had reached it's peak or bottom.
It helps traders to forecast the direction of the crypto currency asset which is being analysed from which opportunities can be spotted.
Indicators comes in different forms and types depending on what it is set to achieve. There are trend trading indicators that help identify when the price of a crypto asset is trending upwards or downwards, e.g adx indicator. Another type of Indicators are the oscillator indicators that helps traders discover the momentum developing in a crypto asset. An example is moving average convergence divergence (macd).
There's also the volatility and the support & resistance indicators. The former measures the largeness of the upswing and downswing of price, an example being bollinger bands (bb), while the latter show the levels at which price is resisted and being moved to another direction, an example being pivot points (pp).
Do you consider them effective for trading cryptocurrency?
I consider them useful but maybe not effective. Looking at the price of a crypto assets plainly may not yield any deductions that are necessary to make important trading decisions but making use of trading indicators gives a better perspective of the movement of price which then gives you an idea on what to do.
Technical indicators only become effective when you have adapted them into your trading strategies and has proven useful to you any time you rely on it to make trading decisions and actions.
Which one is your favorite and how does it work? (Screenshots required where necessary)
My favorite technical indicator is Bollinger Bands (BB).
Bollinger bands is an indicator that measures the volatility (degree of increase or decrease) of a crypto asset's price. It uses a standard deviation to measure the volatility such that as the price increases or decreases, the deviation changes.
It consists of an upper and lower band that envelopes a moving average (middle band), thus being represented as three line when plotted on the chart. It has parameters that can be altered by the trader who decides to use them.
Depending on the parameters chosen, the distance between the upper and lower band moves from the middle band is determined by the number of standard deviation number.
If there's a price increase or decrease, the upper and lower bands widens. And if the price neither increases or decreases, the upper and lower bands become narrow thus indicating that the price is moving in a range.
It can also be used to determine the momentum of the price upwards or downwards such that when the price moves up or down and breaks out of the upper or lower band it shows strong momentum in such direction.
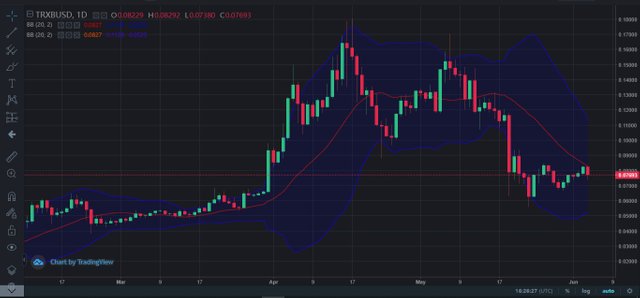
The image above give a graphical illustration of the Bollinger bands. We can see that it is made up of three lines with the middle line being in-between the upper and lower line. The middle line is the middle band/moving average, while the upper and lower lines are the upper and lower bands respectively.
We can also see that prior to the increase in price as shown by the candlesticks, the Bollinger bands contracted (close together), thus indicating that there was no increase or decrease in price, as such the was no deviation of the upper and lower bands from the middle band.
Then later on there was an increase and a decrease in price. This was was shown on the Bollinger bands as the upper and lower bands expanded, thus showing there was deviation of the upper and lower bands from the middle band due to the increase and decrease in the price of the asset.
We can also infer that at the time the bands were close together, there was low momentum in the direction of the price, thus it was moving in a range. And when the bands expanded it shows the was high momentum in the price as it increased and decreased.
Highlight the advantages and disadvantages of technical analysis.
Technical analysis has it's pros and cons like so many things in life. We shall be looking at some of them.
Pros:
✔️ Technical analysis makes approaching the crypto markets look logical and makes it easier to operate. Every information you can ever need is provided, you only need to get familiar with them.
✔️ It is a method of analysis that can be used in any financial markets.
✔️ In the midst of all the instruments used in technical analysis, you can only make use of a few. No one is better than the other, you can only decide to choose the one that suits your requirements.
✔️ Anyone who decides to function in the crypto currency market can begin with technical analysis. It is beginner friendly.
✔️ All the tools needed to do technical analysis are made free of charge and are in the trading charts.
Cons:
❌ Much dependence on information from a technical point of view because of it's relevance and reliability.
❌ We cannot get full disclosure of an event if something falls apart. We only get to see powerful movements in the chart.
❌ There's a lot of indicators which are easily accessible whereby a trader can decide to use plenty of them and end up getting confused or lost.
❌ Technical analysis doesn't give the same results to two or more people. They can use the exact same indicators and information and end up with different interpretation.
What's your advice to anyone about it?
I will advice that anyone getting into the crypto currency market should start with technical analysis. They should start by looking for a strategy to use, then build on that strategy by using tools and indicators that suits that strategy.
Also, they should use more than one indicator as it has a high tendency to give wrong observation and interpretation. It is adviceable to use between 2-3 tools at any given analysis session.
Conclusion
Technical analysis allows traders to analyze the crypto currency market with the primary focus on price and volume. It is composed of price and volume data, the chart which allows you to view the data, and the tools which helps to perform technical analysis well.
It is important to traders of all ranges as it helps them get information about the activities of the market first hand. It can be conducted in an manner, but with an eye for spotting trends.
Technical analysis has its advantages and disadvantages which I have duly stated above. My favorite trading indicator is Bollinger bands.
nice post friend,
BB indicator?
I've never used it but I've seen some big traders use it,
This indicator has 3 lines which allow to better analyze market price movements,
Good luck for the contest
👍👍👍
Thank you dear friend and I hope you will practice it soonest.
Alright my friend
🤗👍
Your definition of technical analysis is simply the best of it kind especially with the mathematical approach.
Good point, the outcome of every technical analysis is to identify trend and maximize profit or reduce risk by setting stop loss level.
After your analysis you should know where to enter to make quick profit and also exit to avoid greed. Knowing where to enter and exit is very important.
Bollinger band is a volatile Indic that project in the direction of trend. It can identify support and resistance with its upper and lower bands.
Please find time to visit my post as well. Good luck!!
https://steemit.com/hive-108451/@sadiqxylo/steemit-crypto-academy-contest-season-4-week-1-crypto-market-technical-analysis-by-sadiqxylo
There is best way when it comes to taking profit because one must be acquitted of when to enter and exist the market to take profit and avoid lost.
Goo evening pal,
To be sincere this the indicator known as the boiling band, is an awesome, famous and effective indicator which help technical analysing the Crypto market effectively.
To be sincere, although it's not the first time I have heard of this indicator but the way you explain it made me understand better.
Thank you very much for sharing
wishing you success
Thank you so much dear friend for visiting, i appreciate it