Steemit Crypto Academy Contest / S18W2: Mastery of Moving Averages and Fibonacci Retracements.
Hello and welcome to my blog . I wish you all are healthy and doing well in your day-to-day life. Today I'll take you through some important indicators like moving averages and Fibonacci retraceemeent as part of task set by this community. So let's begin:

Designed by Vistaprint

What is the difference between a simple moving average (SMA) and an exponential moving average (EMA)? Explain how each is calculated and their typical use in trading.
Moving averages are tools used by traders to analyze the market and take positions accordingly. The simple moving average gives equal weight to all the prices, whereas the exponential moving average gives more weight to the recent prices. Morphologically, they are just like wavy lines that move with price and hence the name moving.
The formula for calculating the simple moving average is different from that of the exponential moving average. It is also important to mention that the exponential moving average is more sensitive to price changes and reacts quicker than the simple moving average. However, a quick reaction does not mean that the exponential moving average is better than the simple moving average. Both of them are effective for traders and depend upon the preference and experience of the traders to explore these indicators and use them for making different decisions in the market.
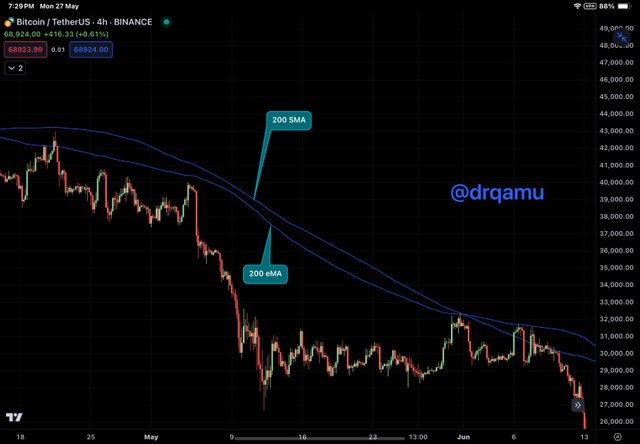
200 SMA and 200 EMA
As we look at the chart above, we get an insight that EMA is close to price than SMA which establishes it's sensetivity but not superiority. So EMA may help some traders in quick decison making contrary to SMA of same period.
Calculation of SMA and EMA
In school math, I was taught that the simple average is equal to the sum of observations divided by the number of observations. The same formula applies to the simple moving average here, where the observations refer to the closing prices of the asset under consideration and the number of observations means the time period.
For example, a 10-day SMA is calculated by adding the closing prices of the asset for the last 10 days and dividing it by 10.
| Day number | Closing Price ($} |
|---|---|
| 01 | 2 |
| 02 | 3 |
| 03 | 3 |
| 04 | 1 |
| 05 | 2 |
| 06 | 2 |
| 07 | 4 |
| 08 | 1 |
| 09 | 3 |
| 10 | 2 |
SMA = 2 + 3 + 3 + 1 + 2 + 2 + 4 + 1 + 3 + 2 / 10 = 23/10 = 2.3
Now, let's move on to the calculation of the exponential moving average. The formula is:
Current EMA = ((Price(current) - previous EMA) X multiplier) + previous EMA
In the above formula, the only new thing is the multiplier. As mentioned in the definition of the exponential moving average, it gives more weight to the recent price than the previous ones, contrary to the simple moving average where each price is given equal weight. The multiplier is the weightage factor of the recent price and is calculated by a simple formula:
Multiplier ={2}/{1 + N}
Where ( N ) is the period under consideration. For example, for a 20-day EMA, the multiplier would be calculated as:
EMA = {2}{1 + 20} = 0.095 = 9.5%
This means that the recent closing price weighs 9.5%, while the rest of the nineteen prices weigh 90.5% in descending order.
Typical use cases of moving averages include analysing trend in the market , taking or squaring off of positions in market, predicting reversal in the market and understanding sentiment of the market .
Explain what a 'Golden Cross' and a 'Death Cross' are in the context of moving averages. How do these setups influence trading decisions?
A Golden Cross, as the name implies, indicates something good. In the crypto market, a good thing is the rise in the price of an asset. So, a Golden Cross indicates a forthcoming bullish trend. It is a chart pattern formed by the crossover of two moving averages - short and long moving averages. The actual orientation of the cross is that the short-term moving average crosses above the long-term moving average.
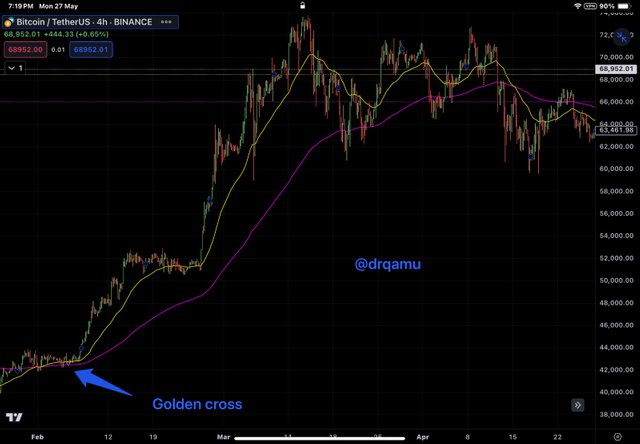
BTC/USDT showing golden cross and notice the bullish momentum that followed
A Death Cross, as the name implies, predicts something adverse. In the market, there is nothing more adverse than a market crash. So, a Death Cross indicates a forthcoming bearish trend. It is a chart pattern formed by the crossover of two moving averages - long and short moving averages. The actual orientation of the cross is that the short-term moving average crosses below the long-term moving average.
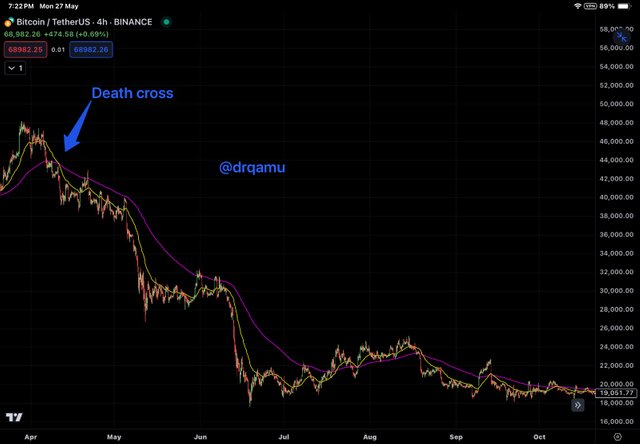
BTC/USDT showing death cross and notice the bearish momentum that followed
The significance of the Golden Cross and Death Cross lies in their predictive nature, which is often accurate. The accuracy of these chart patterns is increased by the simultaneous use of other indicators like volume and price action. Price action always lies at the heart of market cycles irrespective of the indicator, and the volume indicator has been shown to reinforce the reliability of the Golden Cross and Death Cross. The Golden Cross indicates a bullish market, and the Death Cross signals a bearish market.
Upon signaling a Golden Cross, traders can enter the market and take a buy position. It must be remembered that no indicator should stop traders from following the basic rules of trade. By saying so, I mean that traders should set stop-loss and take-profit ranges as per their risk management strategy. Nothing is certain, and unexpected moves in price action in the crypto market are not uncommon. So, don't compromise with basic trading rules.
Similarly, upon signaling a Death Cross, traders holding any asset should exit their position. On the other hand, traders can benefit from the Death Cross by short selling. In short selling, a trader sells their position at a high price and buys it back at a low price, benefiting from the price difference.
Two moving averages are used to identify the Death Cross and Golden Cross. A short moving average of 50 periods and a long moving average of 200 periods are typically used. This combination of long and short moving averages provides better results and trading signals. Short moving averages move faster and stay closer to the price line, whereas long moving averages move slower and remain farther from the price line. The short moving average of 50 periods is based on the average price of the last 50 days on a daily time frame, the last 50 minutes on a 1-minute time frame, and the last 50 hours on an hourly time frame. The short moving average indicates more recent price changes and is the indicator on which traders base their entry into the market.
The long moving average of 200 periods indicates price movement over 200 days on a daily time frame, 200 hours on an hourly time frame, and 200 minutes on a 1-minute time frame. This indicator takes into account farther price movements in relation to the current value. So, the crossover of the short moving average above or below the long moving average confirms trend reversal.
Give a real-life example where Fibonacci retracements can be used to determine support and resistance levels on a trading chart. Use recent market data to illustrate your point.
Fibonacci levels are important price levels used by traders for various trading parameters like finding out support and resistance levels, stop-loss, and take-profit levels. For drawing Fibonacci levels correctly, one must choose a trending market (up or down) and select two extreme points on the price chart, 100% and 0% (say high and low or vice versa), and then price levels are drawn at intervals mentioned in the Fibonacci ratio: 23.6%, 38.2%, 50%, and 61.8%. Note that 50% is not part of the Fibonacci ratio but is included for trading purposes.
Suppose the price of a token moves from $100 to $200. If we have to draw Fibonacci levels manually, how will we draw them? We can draw in either direction according to the Fibonacci ratio.
Identify the high point at $200 (100%) and the low point at $100 (0%).
Draw horizontal lines at 23.6%, 38.2%, 50%, and 61.8% of the price range.
These levels are expected to act as potential support or resistance points where the price might reverse or continue its trend. For example, if the price retraces from $200 to $150 (the 50% level), traders might look for support and a potential buying opportunity. Conversely, if the price breaks through these levels, it might indicate a continuation of the downtrend.
Now , let me give a example of a real token that's BNB. Look at the BNB/USDT chart below:
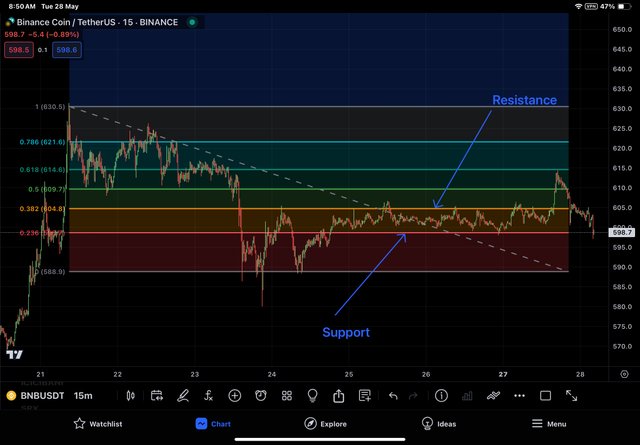
BNB/USDT chart
I have drawn Fibonacci retraceemeent between high and low of BNB . High and low can be seen as 100 and 0 on Fibonacci . We can see that price is strictly confined between fib level 0.23 and 0.38. we can see that 0.23 acts as a support and 0.38 acted as resistance . When price broke the resistance , it went up and met another resistance at fib level 0.618. The price then dropped and is again at previous support of 0.23.The point that we have to understood is that the price is beautifully respecting these levels .
Design a trading strategy using both EMA and Fibonacci retracements. Describe your approach to entering and exiting a position, as well as risk management
I will be using both EMAs and Fibonacci retracements to develop a strategy for both buy and sell positions. For buy positions, the entry strategy would involve the price taking support from a particular Fibonacci level and remaining above the short EMA (EMA 50). The target would be the next Fibonacci level above the support, and the stop-loss would be one Fibonacci level below the support, with the price below the long EMA.
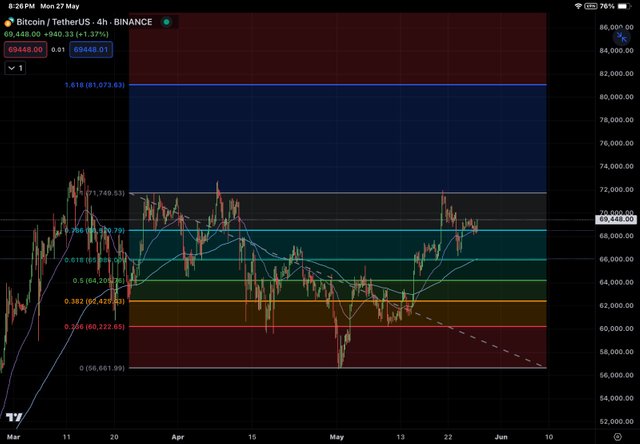
Fib and EMAs applied
It's important to emphasize that a crucial condition for entering my strategy is that the price should remain above the short EMA. At the time of exit, the price should be below the long EMA. Fibonacci levels would offer double confirmation in either direction.
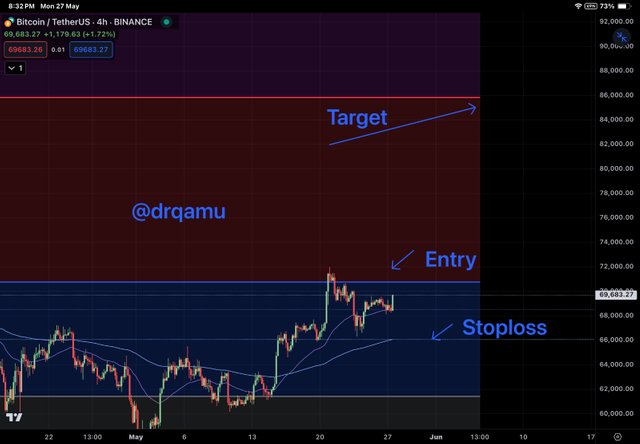
Buy targets marked
In the BTC/USDT chart above, I have marked the levels. I would enter if the price takes support from Fibonacci level 1 and is above EMA 50. I would exit at Fibonacci level 1.61, and the stop-loss would be at Fibonacci level 0.786 if the price remains below the long EMA.
The strategy for short positions would be somewhat similar but in reverse. I would enter if the price remains below the long EMA and breaks below the immediate support level. The target would be one Fibonacci level below the entry, with the price bouncing back above the short EMA, and the stop-loss would be one Fibonacci level above the entry price.
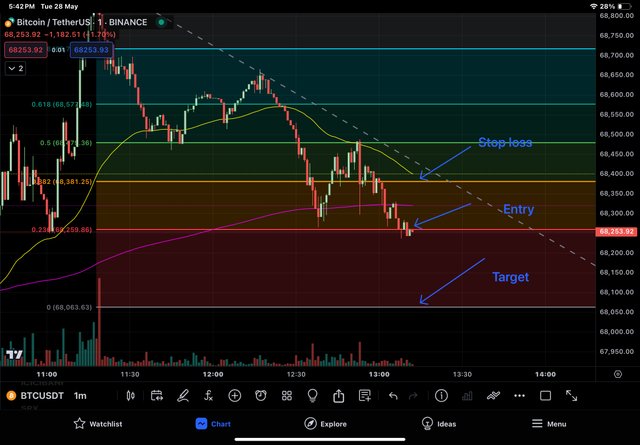
BTC/USDT - level for short sell
In the BTC/USDT chart above, I would enter at Fibonacci level 0.23 and set the stop-loss at Fibonacci level 0.36 and target at fib level 0. Price must remain below long EMA to enter short positionnin market.
Analyze a historical trading chart of STEEM/USDT pair where a 'Golden Cross' followed by a Fibonacci application led to a significant price movement. Explain how you would have negotiated this scenario
In the STEEM/USDT chart above, we can see that recent price data shows a Golden Cross followed by consolidation of the price between two Fibonacci levels, 0.5 and 0.618. I have marked these levels as support and resistance respectively.
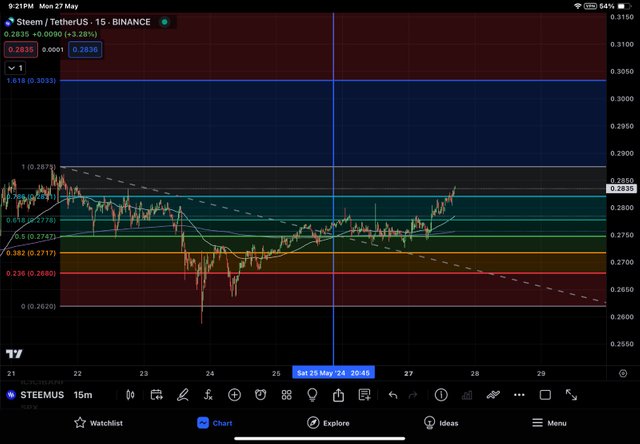
STEEM/USDT Chart - vertical line marks the golden cross
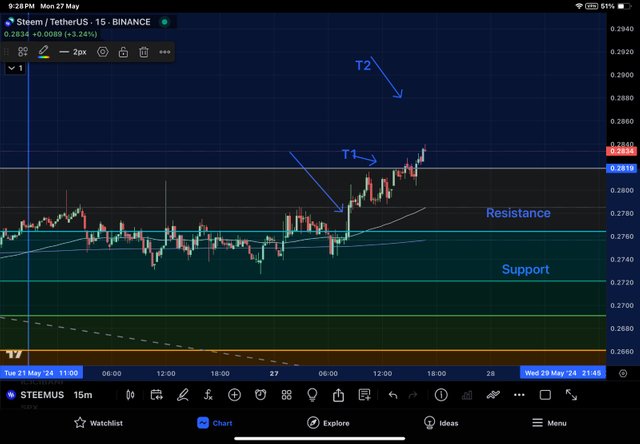
Price consolidated between two fib levels in a box
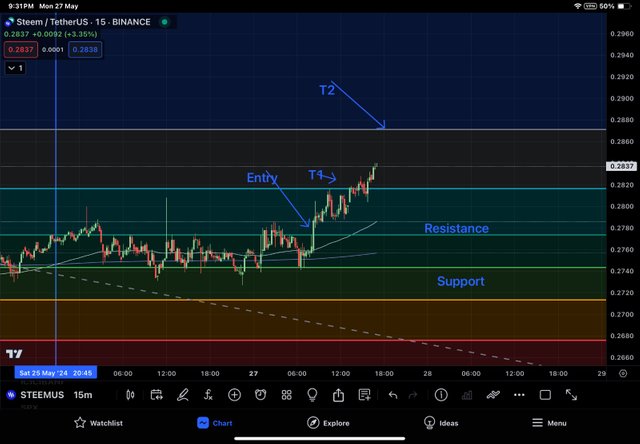
Levels marked
My entry would have been activated once the price crossed the resistance level. My target level 1 would have corresponded to Fibonacci level 0.71 with the price above the short EMA, while target level 2 would correspond to Fibonacci level 1. My stop-loss for this entry would have been below the Fibonacci level 0.5, which acted as support for the price after the Golden Cross.
Thank you, friend!


I'm @steem.history, who is steem witness.
Thank you for witnessvoting for me.
please click it!
(Go to https://steemit.com/~witnesses and type fbslo at the bottom of the page)
The weight is reduced because of the lack of Voting Power. If you vote for me as a witness, you can get my little vote.
Thanks
Very nice article @drqamu. the article provide detailed about support and resistance levels based on Moving average (MA).
Moving average (MA) 50 and 200 days provide good accurecy for up and down sides copared to other periods. Also, it helps for long holding. For Intraday or short term I believe EMA 10 and 13 days period is good.
That's nice to hear. You may have experience with that .
Thank you .
TEAM 5
Congratulations! Your post has been upvoted through steemcurator08.Greetings my friend @drqamu,
It's osm! Your point about the EMA's quick reaction to price changes is spot on. This makes it a valuable tool for traders needing quick decisions!
All the best in the contest, success for you👍.
Thanks for feedback .
Greetings friend,
Your entry is like a super well-built house as it has all the important stuff one needs to know and useful tips that can really help both newbies and pros in trading. You're doing a fantastic job at making complicated trading ideas easy to understand and giving practical advice. Good luck my friend.
Thank you for your kind encouraging remarks.
It's obvious you are fully aware and highly educated on the fact and datas concerning the Golden Cross and the Dead cross which is usually gotten when two moving average courses that self to move in the opposing direction. Also why preparing for the course I came across a video that said if you are not using the 50 period and 200 period then you are doing rubbish. So for using the two widely used periods how to say you are doing a great job.
At your free time drop a comment on my entry friend. https://steemit.com/hive-108451/@starrchris/steemit-crypto-academy-contest-s18w2-mastery-of-moving-averages-and-fibonacci-retracements
Thank you for your insightful remarks .