Crypto Academy Season 3 | Homework post for professor [@asaj] : Crypto Assets and the Random Index (KDJ)
Define the random index and explain how it is calculated
Random index or KDJ indicator is a technical tool used by traders to get various signals in the market. This indicator is extrapolation of stochastic oscillator indicator. As the name implies, KDJ indicator has three lines, %K line, %D line and J line. K and D line are same as Stochastic oscillator while J line represents divergence of D from K value. To differentiate these lines from each other, they have been differently colored, K line is colored Blue , D line is coloured purple and J line is coloured black. However their colours are not fixed, so they can be changed.
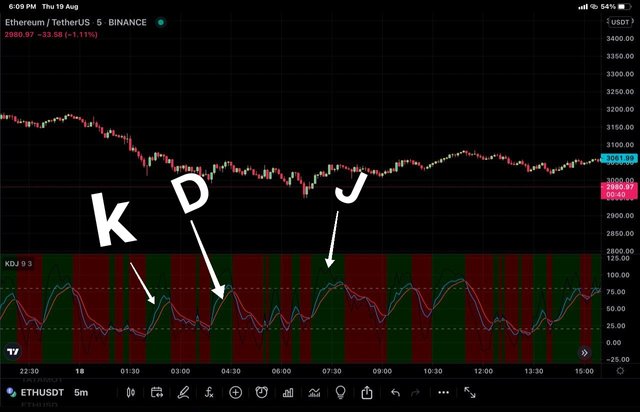
KDJ indicator on chart
Working of KDJ
The KDJ indicator help traders to determine whether an asset is overbought or oversold and trend reversal thereby. It also help traders to determine buy/sell signals, strength of signal generated. Let's take each of these parameters ;
Overbought and Oversold : KDJ oscillates between 0 to 100. When the indicator falls below the 20 , it means that the asset is oversold and the trend is likely to reverse soon. When KDJ is below 20, price line is projecting down and we should expect price to rise soon.
When the indicator rises above 80 , it means that the asset is overbought and the trend is likely to reverse soon. When KDJ is above 80, price line is projecting up and we Should expect price to fall soon. However, it must be remembered that 20 and 80 are not the magical numbers where you can expect price taking " V turn" but these are just the boundaries of zones within which reversal is expected.Buy and Sell : Convergence of curves gives buy/sell signal. When the J line crosses K and D line from below upwards , it is a less commonly called golden fork and is a buy signal. When the J line crosses K and D line from above downwards , it is less commonly called dead fork and is a buy signal.
Signal strength : When the above mentioned convergence takes place in overbought or oversold zones, those signals are considered strong. When golden fork occurs below 20 and dead fork occurs above 80 , these are strong signals.
Trend Direction : Direction of bullish or bearish trend is indicated by direction of K line. If K line is projecting up , it indicates bullish market and vice versa in bearish market.
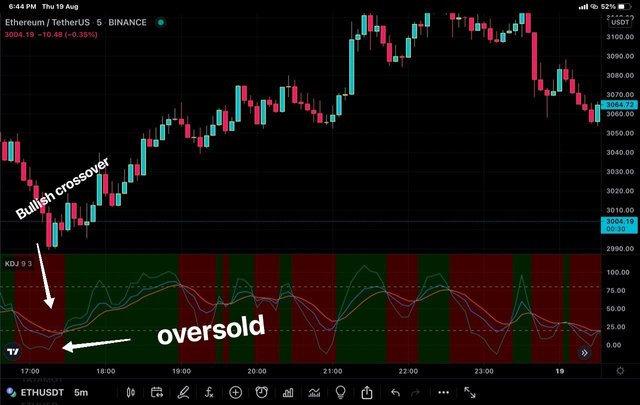
ETH/USDT chart showing bullish crossover and overbought zone
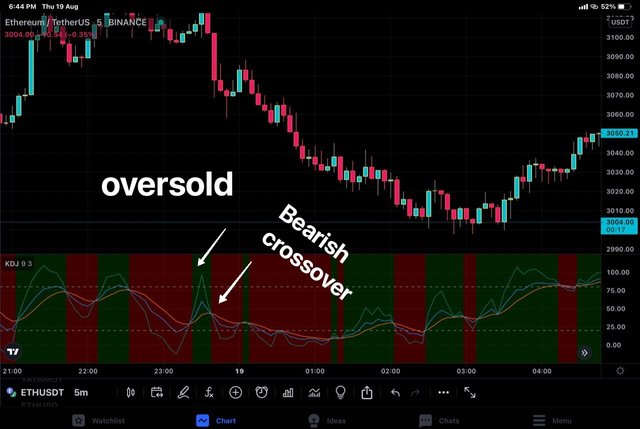
ETH/USDT showing bearish crossover and oversold zone
Calculation of KDJ.
Theee are many methods or calculating KDJ indicator. Have a look below at few simple methods.
%K Line = Closing price – lowest price within a specific time period) / highest price - the lowest price within a specific time period).
Specified period refers to the time period which is used in an indicator . If 9 MA is used , time period will be 9.
%D Line = Simple Moving Average of 3 Periods of the %K line
%J Line = 3 %K - 2 %D
Second method of calculation is easier than above, but here we need to have previous K, D and J values beforehand.
%K = 2 / 3 × K value of the previous day + 1 / 3 × RSV of the day
%D = 2 / 3 × D value of the previous day + 1 / 3 × K value of the day
J = 3 * K value of the same day - 2 * D value of the
same day
So first we need to calculate K value, for that we need RSV for the specified period. Suppose, we take 14 days period .
- RSV = (closing price of day 14 - lowest price ) × (Hughest price -lowest price ) × 100
Now, we can calculate K, D and J values easily :
K = 2 / 3 × day 13 K + 1 / 3 × day 14 RSV
D = 2 / 3 × day 13 D + 1 / 3 × day 14 K
J = 3 * K - 2 * D
K and D are of same day for J value .
Is the random index reliable? Explain
No indicator is absolutely reliable. Had it been like that, than no body would lose from the market and market will stop functioning. So the basic trading etiquettes should not be compromised like risk management. Every indicator has some shortcomings and so is the case with KDJ.
Although it acts reliably in the trending market, it is known to provide some false signals in sideways or choppy market. Moreover, the indicator is also not good to use on small time frames. So longer time frames and trending markets are favourable conditions for KDJ indicator.
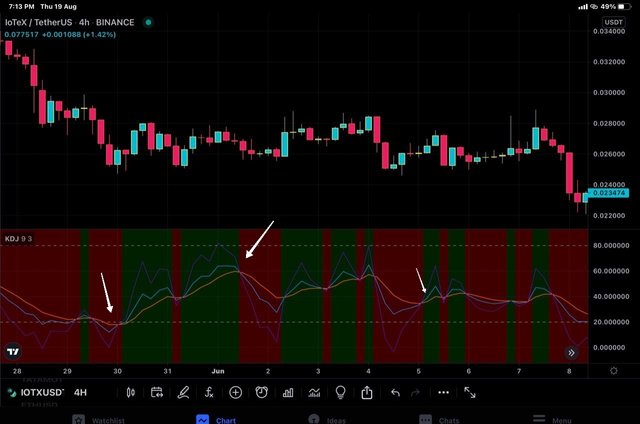
IOTX/USDT chart on 4h time frame in a consolidating market showing so many buy sell/sell signals.
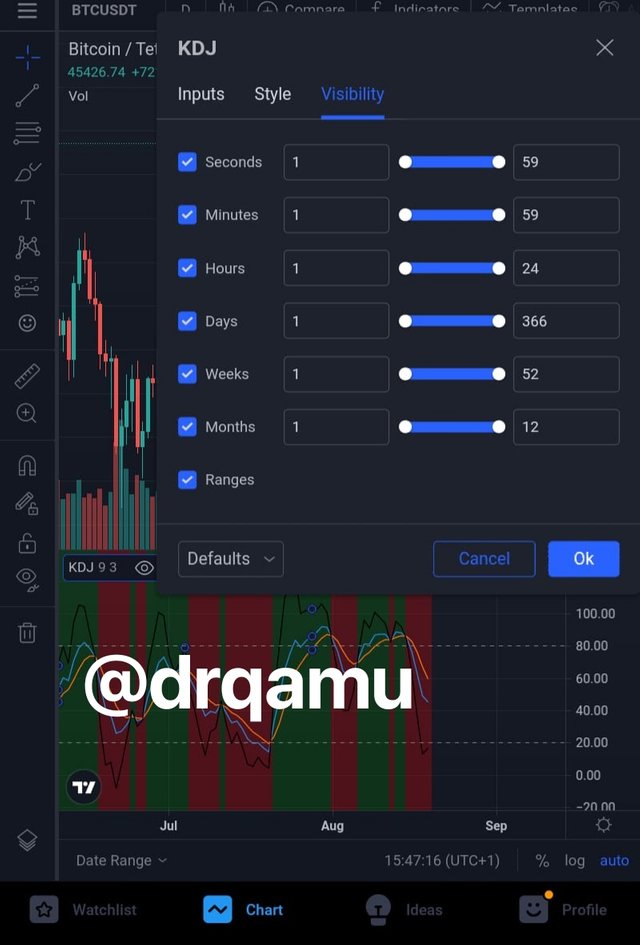
How is the random index added to a chart and what are the recommended parameters? (Screenshot required)
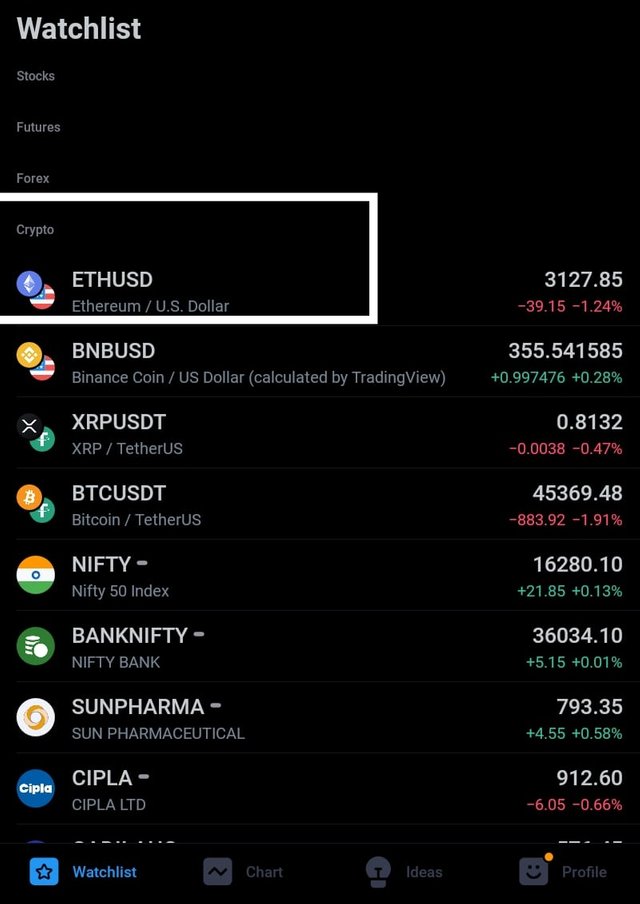
I'll be using trading view app. You can do it from official website of trading view too. I launched trading view app.
Select any trading pair. Chart of the pair will load.
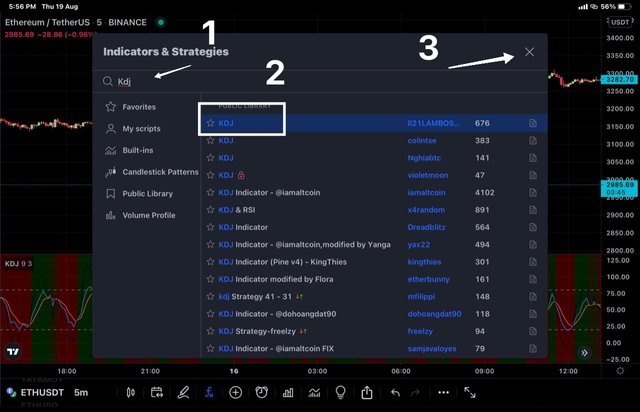
Click on indicators from the top menu.
Next we type name of indicator in the search box provided and select same Indicator from the suggestions. I type KDJ and select same from search.
- Go back to your chart and you will find KDJ indicator loaded at bottom of your chart.
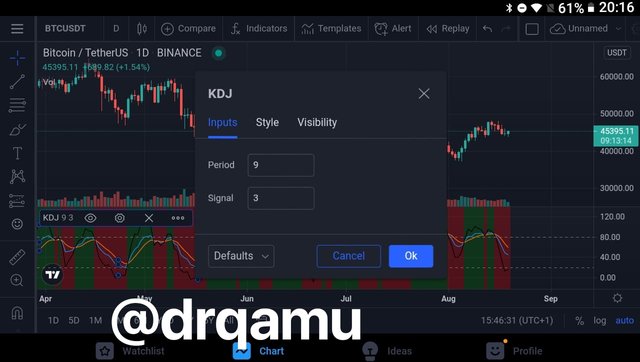
Configration of the indicator.
Double click on Indicator and chart settings will load.
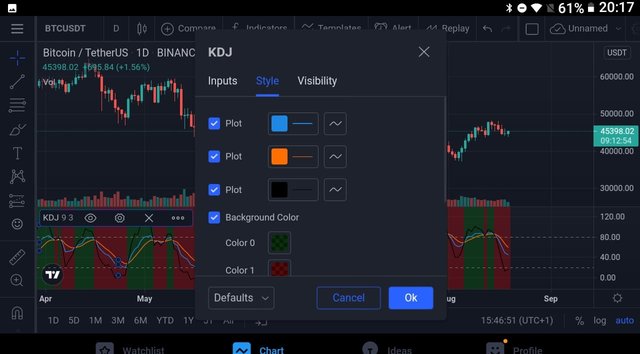
Style settings -
Here we can choose color and precision of indicator.In the Inputs settings, we have indicator period and signal. In KDJ we have default setting of 9 periods.
In the visibility, we have seconds , minutes, hours, days, weeks, months. Keep default settings for visibility.
Differences between KDJ, ADX, and ATR
ADX or average directional index is a non directional trend finding indicator, used to detect the strength of trend. The ADX indicator itself does not indicate whether the trend is bullish or bearish. ADX indicator is represented as a oscillating line below the price chart of an asset and oscillates between the value of zero and hundred. The whole range of oscillator is classified into four zones - zero to 25 is a weak trend, 25 to 50 is a strong trend, 50 to 75 represent very strong trend and 75 to 100 represents extremely strong trend. These zones are same for bearish as well bullish market. To find whether the market is bullish or bearish, ADX curve is supported by two curves . The two curves ( DM+ and DM -) along with ADX form directional movement index. When DM+ curve is above DM-, it represents bullish market and when DM- is above DM+ , it indicates bearish market.
ATR or average true range Indicator is a tool to detect the Volatility of an asset by taking into account simple moving average over specific period of time ( usually 14 days). As a matter of common understanding, if ATR of an asset is high, it means asset is highly volatile where as if ATR is low, it means asset is less volatile. The indicator helps traders gain entry or exit from the market.
KDJ indicator is combination of three lines. The indicator helps to find overbought and oversold assets. In addition, KDJ helps to spot entry and exit points in the market. In addition, the indicator also helps to detect strength and type of trend. To avoid falling in trap, KDJ can be used with above mentioned indicators in ranging markets. So combination of these indicators is reliable to use in any market.
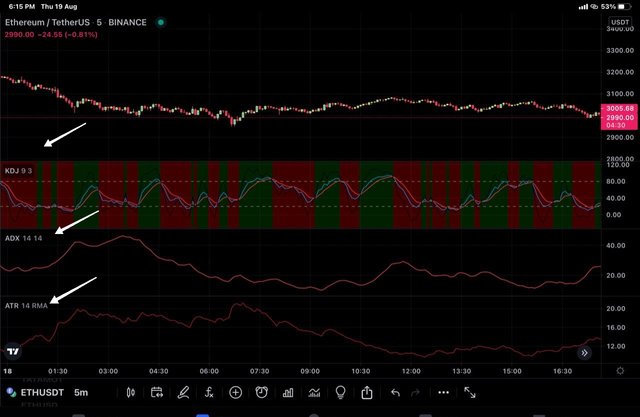
KDJ, ATR and ADX added to chart
Use the signals of the random index to buy and sell any two cryptocurrencies. (Screenshot required)
For this task I'll be doing analysis on tradingview and place trade on OctaFx demo account.
Trade 1 : LTC/USDT
Here I'll place sell trade on the basis of sell signal generated by bearish crossover of KDJ indicator.
I placed sell trade at LTC price of 170 and set stop loss at 169 and take profit at 171. Risk reward ratio is 1:1 .
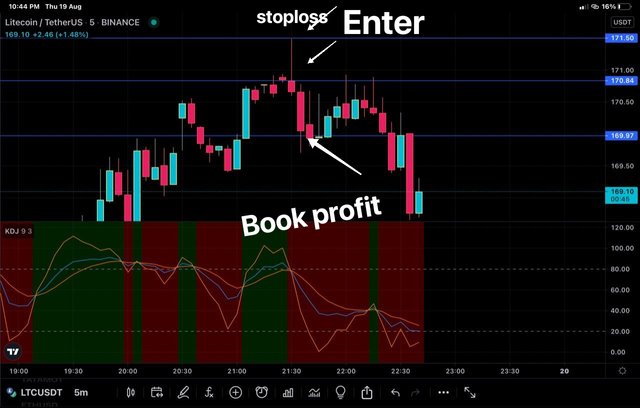
We can see that our target was hit amd we exit with profit.
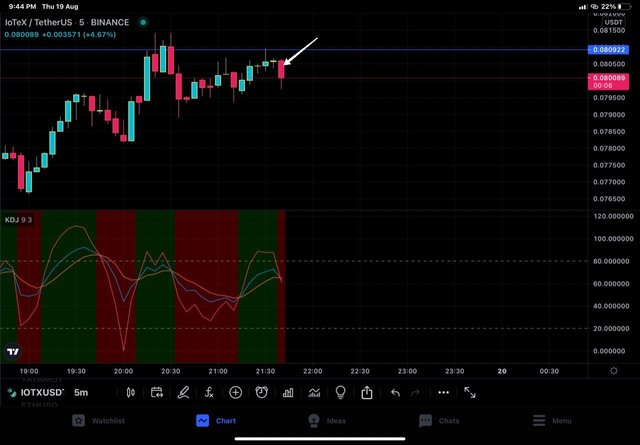
Trade 2 : Iotex /UsDT - Buy trade
On the basis of bullish crossover, i am taking buy trader at IOTX price of 0.0079 USDT, setting stoploss at 0.0078 USDT and take profit at 0.0081 . Risk reward ratio is 1:2.
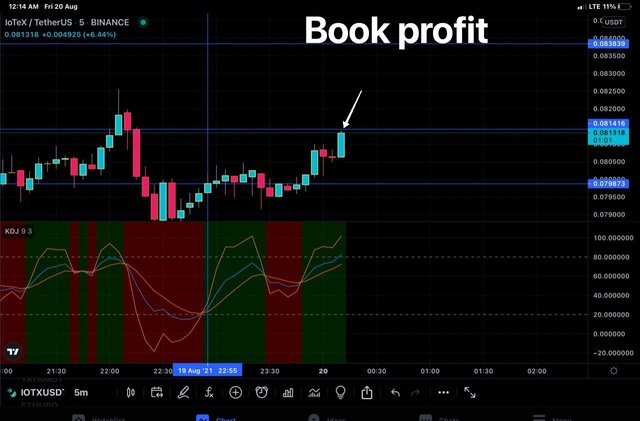
Here we can aee that targer was hit and profit is booked.
Good job @drqamu!
Thanks for performing the above task in the eighth week of Steemit Crypto Academy Season 3. The time and effort put into this work is appreciated. Hence, you have scored 7.5 out of 10. Here are the details:
Remarks
You have displayed a good understanding of the topic. You have completed the assigned task. However, there was no conclusion and you did not provide a screenshot of your demo account summary to show that you actually performed the trade.
That said, thanks again for the time and effort put into this work .