Trading Crypto with On-Balance Volume Indicator - Crypto Academy / S5W4 - Homework Post for @fredquantum
Everything revolves around timing; there is time to play, time to work, time to sleep, time to learn, and so forth. Everything would go wrong if you didn't time things correctly; if you sleep when you're supposed to work, you'll undoubtedly suffer when you're supposed to rest. The financial market is also affected by time; there is a period to invest in an asset and a time to liquidate the asset. If you buy when you're supposed to sell, you'll almost certainly lose money or make only a small profit. In the financial market, identifying the right time on your own is difficult; you need tools, such as technical indicators, to assist you in determining the ideal timing.
Technical indicators are market analysis instruments that traders use to understand market movement. These tools are used on the assets chart and analyze asset prices and trade volumes to provide information about previous and future market conditions. Hundreds of technological indicators exist, each serving a different or comparable purpose. Aroon indicators, average true range, bollinger bands, fibonacci retracement level, fibonacci, moving average convergence divergence, relative strength index, Williams alligator, pivot points, rate of change, and so on are examples of technical indicators.
This homework post will focus on answering the questions asked after the class thereby talking more extensively about "On Balance Volume," which is one of many indicators.
Question 1: In your own words, explain your understanding of On-Balance Volume (OBV) Indicator.
On-Balance Volume (OBV) Indicator
In the financial market, trading volume is quite significant. When there is a high volume, it means something huge is about to happen or is beginning to happen to the market. It shows the interest of market players and has a significant influence in determining the price of an asset.
For example, during the Christmas season (December), the trading volume, or demand and supply of Christmas decorations, is always high compared to other festive seasons (other months), and as a result of the high trade volume, the price of Christmas decorations will almost certainly rise. In the financial market, there are high and low volume moments, and one indicator that talks a lot about trade volume is OBV.
On Balance Volume, abbreviated as OBV, is a momentum technical indicator that uses the high or low movement of trading volume to represent the relative buying and selling pressure of an asset, with the intention of forecasting potential market movement.
Joseph Granville, a well-known stock trader, created this technical indicator in his 1963 book " Granville's new key to stock market profit ". He designed the indicator primarily for stock market traders, but it has also been used by traders in other financial areas, such as cryptocurrency and FX traders.
The indicator oscillates between positive and negative values, as well as around the zero-value line.
When the current closing price is higher than the previous closing price, the volume value is positive on balance. This indicates a positive volume pressure, which will almost certainly result in an increase in the asset's price.
When the current closing price is lower than the previous closing price, the volume value is negative. This indicates a negative volume pressure, which could lead to a drop in the asset's price.
Question 2: Using any charting platform of choice, add On-Balance Volume on the crypto chart. (Screenshots required).
Adding On balance volume to a chart is simple. TradingView is my favorite charting platform, therefore I'll show you how to use it.
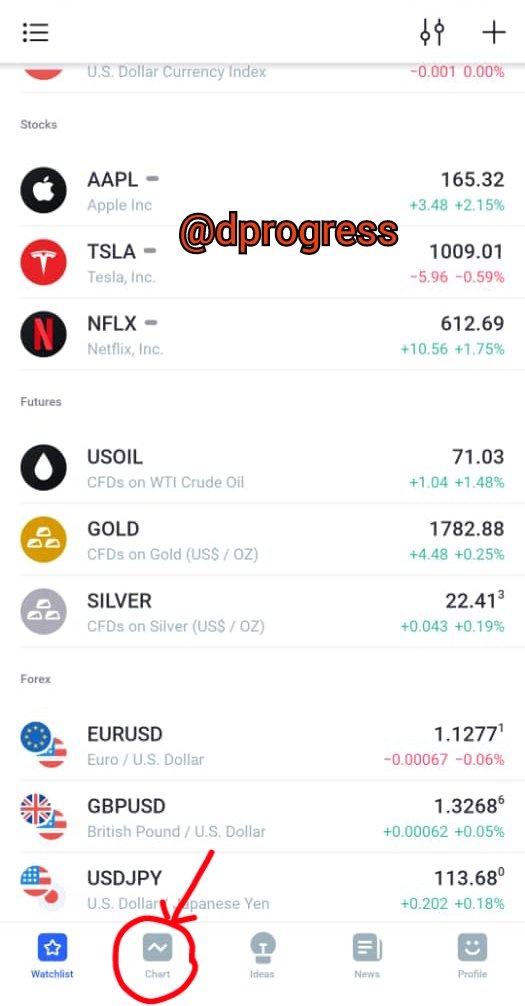
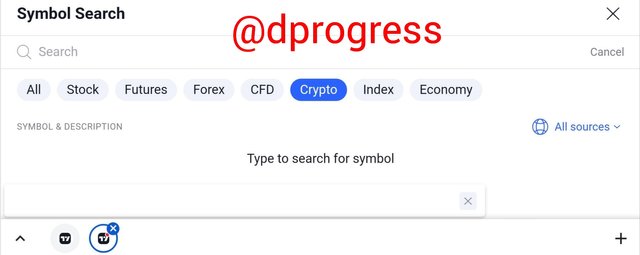
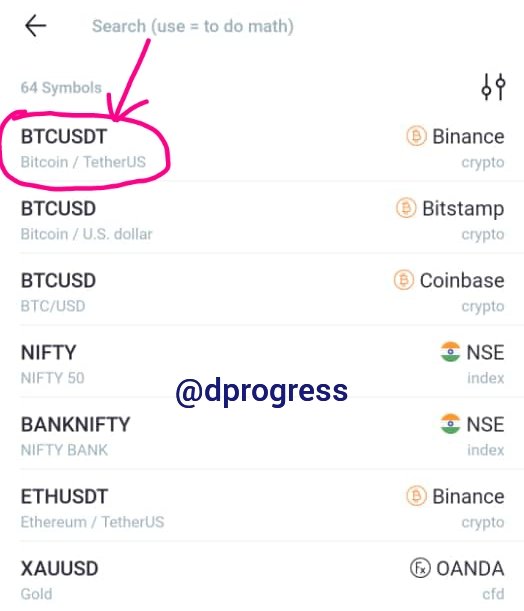
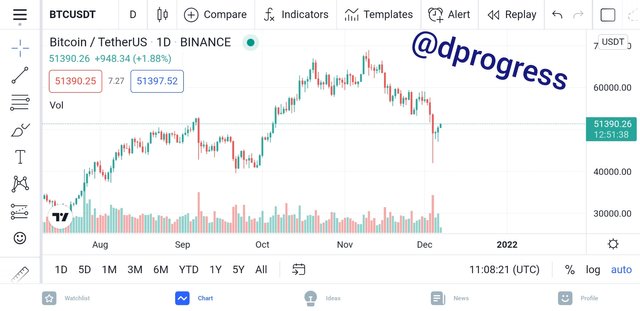
Open your trading view app, click chart, then search for a specific asset (crypto assets, currency, stock, and so on). Let's use the BTC/USDT pair because we're writing about cryptocurrency.
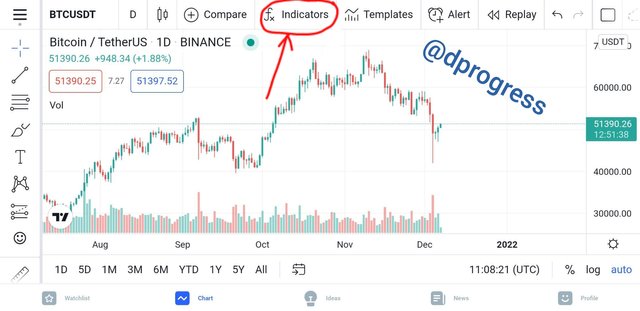
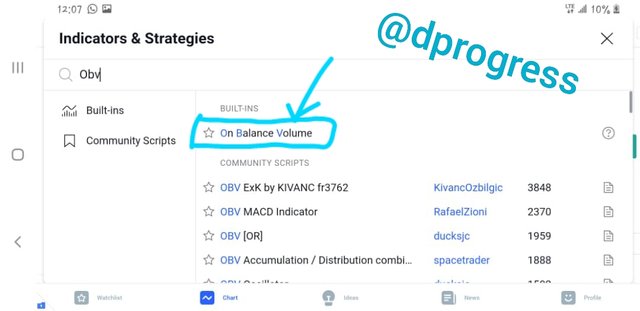
To add the indicator, click on the circled section in the image below; there are many indicators on the platform; then, on the search bar, type OBV; then, on the circled result, the indicator will be immediately plotted beneath the crypto pair chart.
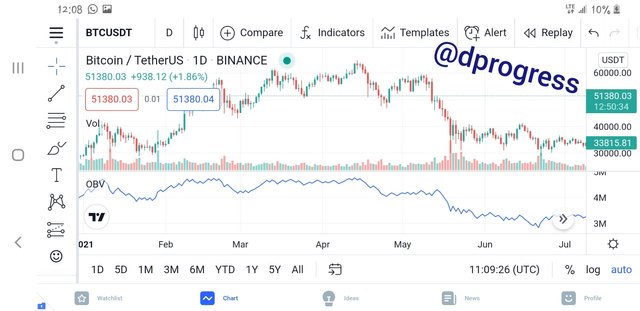
The graph is made up of a line that oscillates between positive and negative numerical values.
Question 3: What are the Formulas and Rules for calculating On-Balance Indicator? Give an illustrative example.
Before you calculate the OBV, you must first comprehend the formula. The formula for calculating the OBV is as follows:
When the current day's closing price is higher than the previous day's, the OBV is determined as :
OBV = Yesterday’s OBV + present day’s Volume
The OBV is calculated as follows when the current day's closing price is less than the prior day's closing price:
OBV = Yesterday’s OBV – present day’s Volume
When the current day's close equals the previous day's close, the OBV is calculated as follows:
OBV = previous ’s OBV
Question 4: What is Trend Confirmation using On-Balance Volume Indicator? Show it on the crypto charts in both bullish and bearish directions. (Screenshots required).
Trend Confirmation with OBV is when you use the indicator to see if the on balance volume line is trending in the same direction as the asset's price. It's all about validating the direction of the trend.
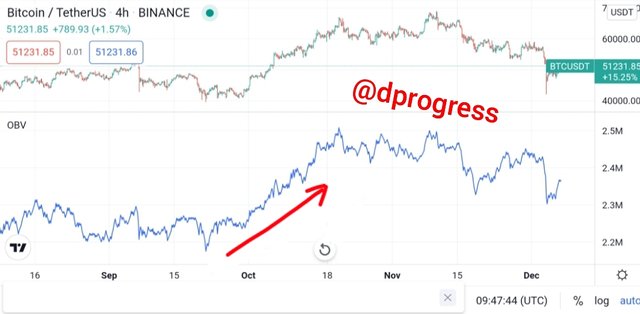
When the on-balance volume rises in tandem with the upward price movements and they continue to make higher highs and lower lows, this is said to be a bullish trend. The BTC/USDT chart, for example, is seen below. We can observe how the line has been oscillating and how it continues to swing upward at the underlined area, indicating an uptrend.
When the on-balance volume line falls in lockstep with price movements and continues to make lower highs and lower lows, it is said to be in a bearish trend. The BTC/USDT chart, for example, is seen below. We can observe how the line has been oscillating and how it continues to swing downward at the underlined area, indicating a downtrend trend.
Question 5: What's your understanding of Breakout Confirmation with On-Balance Volume Indicator? Show it on crypto charts, both bullish and bearish breakouts (Screenshots required).
One of the benefits of OBV is the breakout signal. When a ranging market crosses the support or resistance level, it is called a breakout.
OBV can be used to detect these breakouts as well as determine whether they are real or not. When a breakout happens, the obv and price move in the same direction as the trend, but when the breakout is fake, the obv and price move in the other way. To be sure of the breakout, draw a similar line on the OBV chart and price chart.The breakout is valid and strong if the OBV line also crosses through the levels. If it doesn't, a misleading breakout has happened.
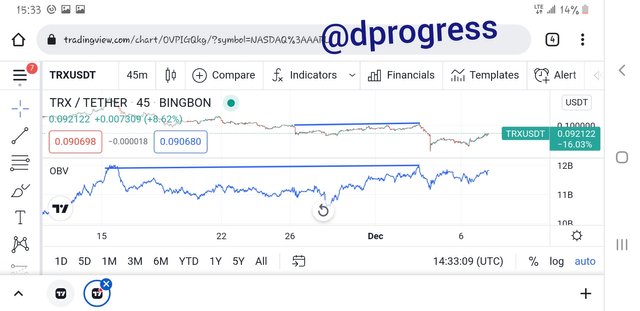
When price movements cross the resistance level and a strong upswing continues, this is known as a bullish breakout. The breakout and rising momentum are also indicated by the obv line.
The image above is an example of bearish breakout.
When price movements cross the support level, a bearish breakout occurs, and a significant downturn follows. The breakout and negative momentum are also shown by the obv Line.
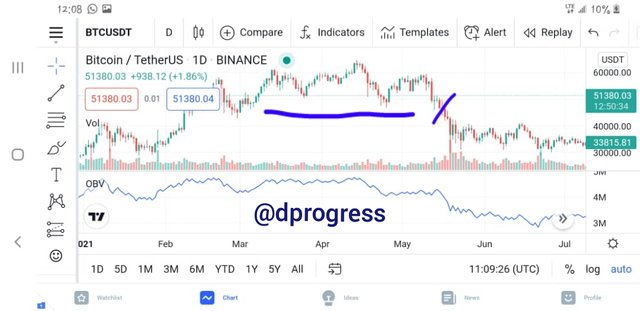
The trend started as a bullish trend, but as it progressed, the uptrend became fatigued, and the bear trend took over. The bear trend came to an end at a point that represents a support level, and the bull trend began as soon as it reached the support. Bears regained control, but the trend reversed at the support level. The breakouts occurred where the red slash is indicated, the price crossed the support level, and the OBV supported the breakout.
Question 6: Explain Advanced Breakout with On-Balance Volume Indicator. Show it on crypto charts for both bullish and bearish. (Screenshots required).
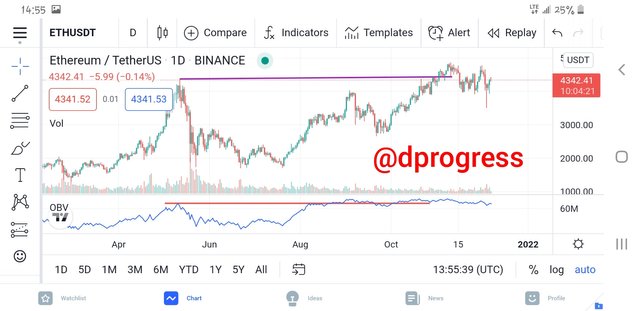
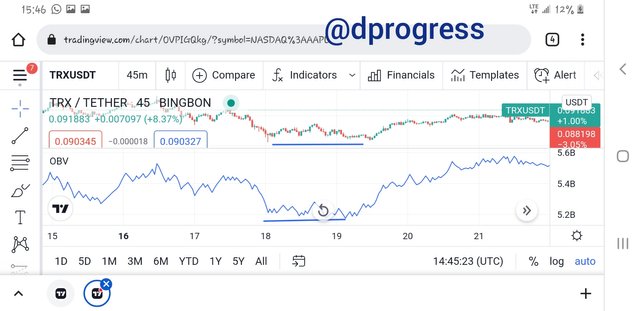
An advanced breakout occurs when the OBV line breaks the previous high, but the price does not. Due to high trade up volume, it's possible that the price will also cross the previous high. At this time, traders can begin determining where to open positions.
In the image above, the current price didn't break the previous high but the OBV line did.
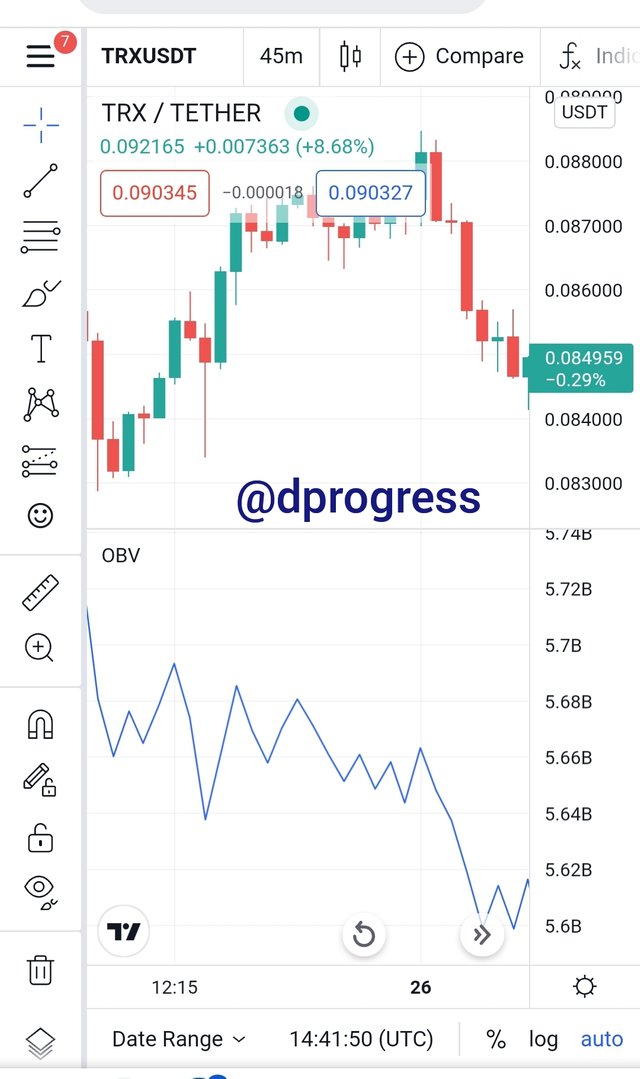
Advanced breakdown is the term used to describe a bearish advanced breakout. It happens when the price can't break through the previous low, but the underlying line has crossed through it. This is a sign of price weakness, implying that the price will continue to fall. At this time, traders can begin to close positions.
Question 7: Explain Bullish Divergence and Bearish Divergence with On-Balance Volume Indicator. Show both on charts. (Screenshots required).
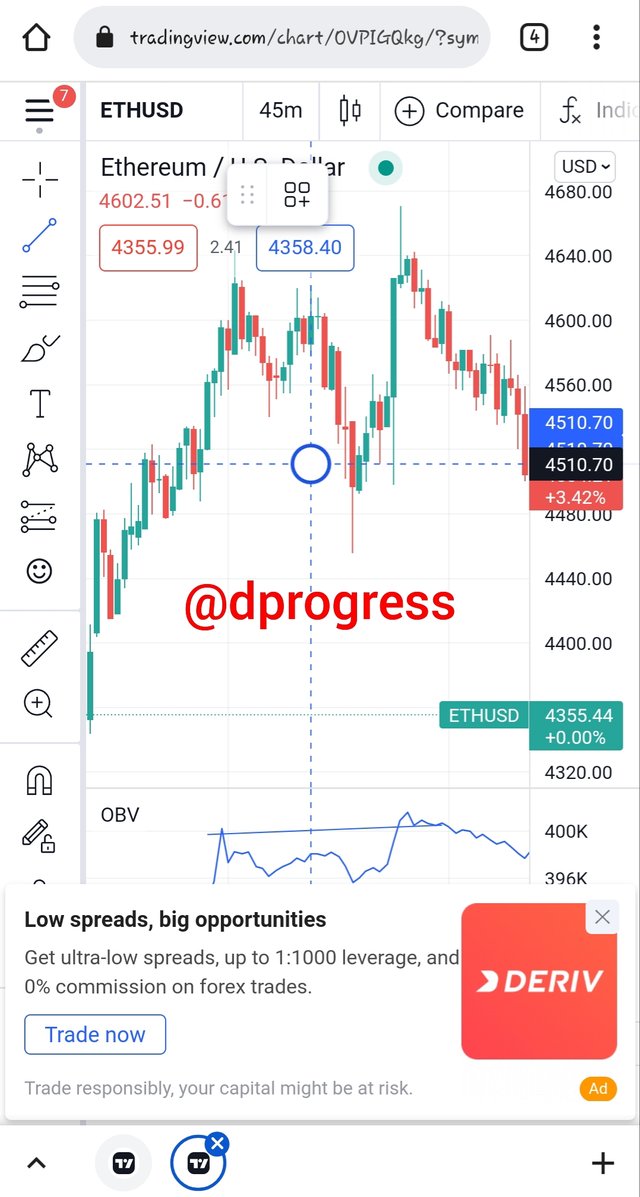
When the asset price action does not move in the same direction as the on balance volume indicator, it is called divergence. The obv line may be signaling an uptrend while the price is indicating a drop; this usually occurs when a trend reversal is in progress.
Bullish divergence happens when the price of an asset continues to fall while the OBV line continues to rise, signaling an uptrend. The on-balance volume line indicates higher lows while the price line shows lower lows.
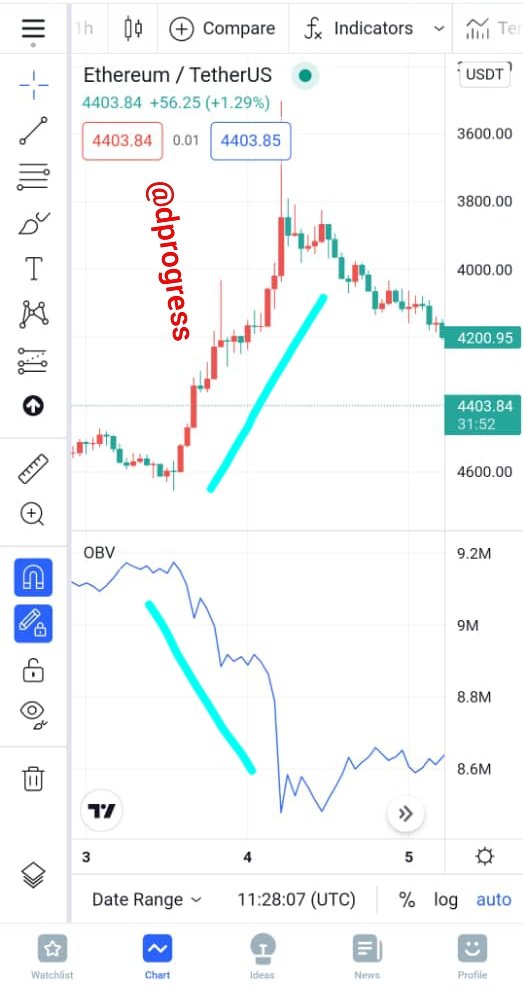
When the price of an asset continues to rise while the OBV lines continue to fall, this is known as bearish divergence. On balance volume lines would reflect lower highs while price reflects higher highs. When this happens, there's a good chance the market will start to trend upwards.
Question 8: Confirm a clear trend using the OBV indicator and combine another indicator of choice with it. Use the market structure to place at least two trades (one buy and one sell) through a demo account with proper trade management. (Screenshots required).
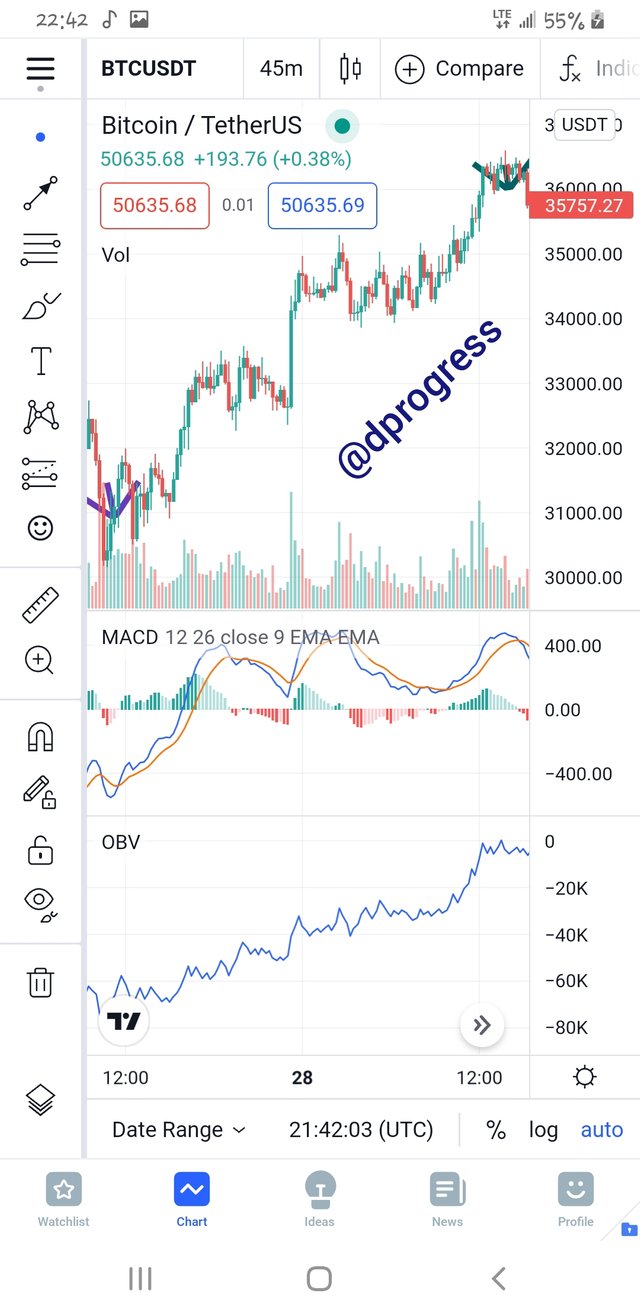
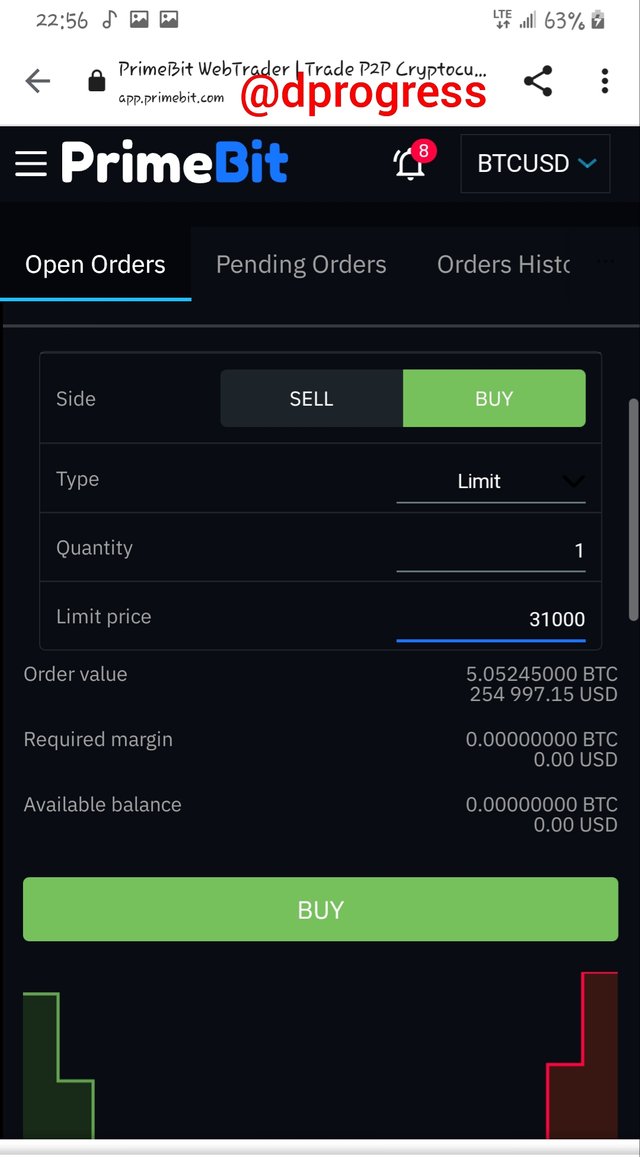
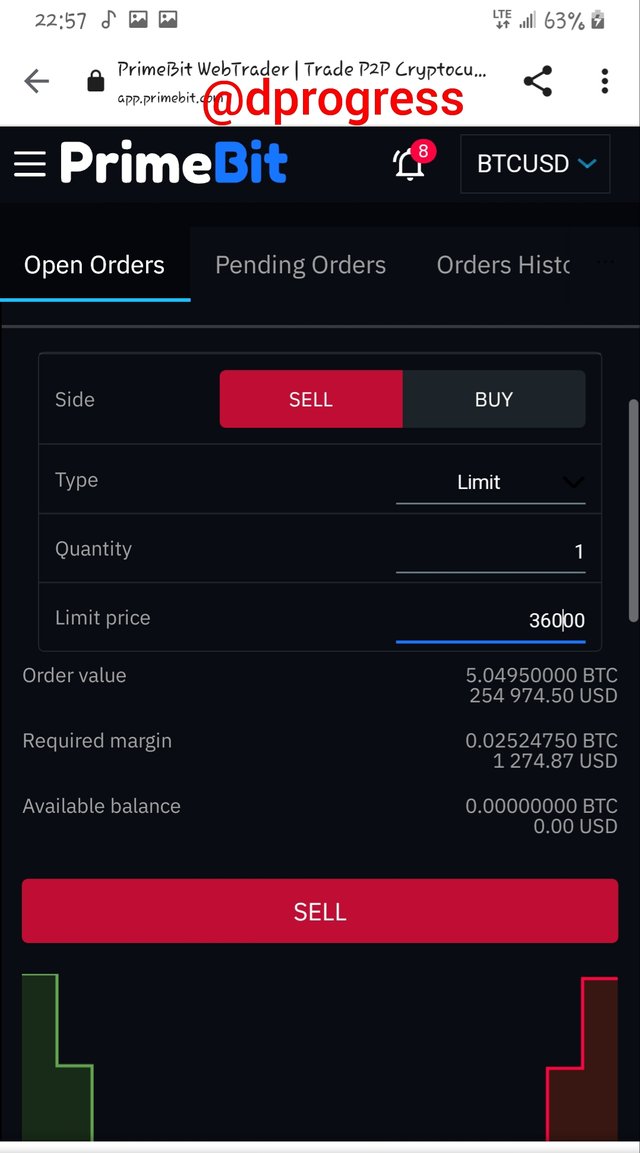
BTC/USDT is the crypto pair I'm using. The previous trend was bearish, but based on my study of the OBV indicator in conjunction with the moving average convergence divergence, I believe a trend reversal is likely to occur, which it did. I waited for the breakout to occur before placing my buy order on the third candle following the breakout (purple arrow). I placed my sell order(upper arrow) at $36000 based on previous price movement, which means I'll profit $5000 if everything goes well. To be careful, I set my stop loss at $29000 in case the breakout strength isn't as strong as I anticipated.
Question 9: What are the advantages and disadvantages of On-Balance Volume Indicator?
Advantages of On-Balance Volume Indicator
The following are some of the advantages of using an on-balance volume indicator:
- If you understand the formula, calculating OBV is fairly simple.
- The OBV indicator can be used to spot possible market breakouts.
- OBV can be used to confirm an asset's trend direction, whether it's uptrending or downtrending.
- Bullish and bearish divergences can be identified using OBV.
Disadvantages of On-Balance Volume Indicator
There are some drawbacks to using OBV, some of which are as follows:
- OBV, like other technical indicators, can produce erroneous signals, particularly when employed in shorter time frames.
- Because the on balance volume indicator does not contain all of the necessary data for market research, it must be used in conjunction with other indicators such as the MACD for the best results.
- When it comes to identifying trend reversals, OBV is a poor signal because it does not take into consideration the magnitude of price adjustment, simply the volume.
Conclusion
On Balance Volume (OBV) is a simple technical indicator that calculates buying and selling pressure using volume and price. When up volume is higher than the down volume and the OBV line rises, there is buying pressure. When the down volume exceeds up volume and the OBV line falls, selling pressure is there. OBV can be used by traders to confirm the overall trend or to seek for divergences that could indicate a shift in prices. It's crucial to combine OBV with other elements of technical analysis, as it is with all indicators. It's not a stand-alone metric. For a better result, OBV might be paired with MACD.