Trading Crypto with Aroon Indicator- Crypto Academy / S5W2 - Homework Post for @fredquantum
Technical analysis is essential in the financial market because it allows traders and other market players to comprehend what is going on.
Technical analysis is used by traders to determine whether assets are profitable to invest in and when to sell them. When attempting to analyze the market, there are tools known as indicators, and there are several sorts of indicators that serve different or comparable purposes.
Moving average convergence and divergence, relative strength index, automatic true range, bollinger bands, fibonacci retracement level, aroon indicators, and others are examples of popular indicators.
I'm going to write about the aroon indicator.
Aroon Indicator
The Aroon indicator is a common momentum indicator that counts the time between highs and lows over a length of time. It is a tool for detecting trend changes as well as the strength of a trend in the price of an asset.
Tushar Chande created this indicator in 1995, and the word AROON means "Dawn's early light" in sanskrit.
The Aroon indicator is a single indicator that has the functionality of two indicators. It can be used to spot developing market trends and predict trend reversals, making it a price action early warning system.
Other momentum oscillators, such as the stochastic, relative strength index, and others, do not provide a clearer picture of market direction than the aroon indicator.
The Aroon indicator uses triangular waves to display a visual picture of market action, making it simple to identify signals.
The Aroon indicator is made up of two parts: Aroon up and Aroon down.
Aroon Up and Aroon Down
The Aroon Up measures how long it has been since a new high was set within the chosen time frame. The Aroon Up value is 100 if the current candle's peak is the highest within the set number of periods.
It's essentially a new high for the time period. If it doesn't, it returns a percentage number showing how long it's been since a new high for the chosen time period.
The Aroon Down line shows the time it's been since prices hit a new low within the given timeframe. The Aroon Down value is 100 if the current candle's low is the lowest within the set number of periods before it. To put it another way, it's a new low for that time frame. Otherwise, it provides a percentage value showing how long it has been since the new low for the stated period.
How to calculate Aroon Up/Aroon Down
It's not as difficult as you may imagine to calculate the Aroon up and down. It only involves the application of the high and low prices from a number of different periods in the formula. The most common number of periods used by traders is 25, although you can use whatever number of periods you choose as long as it suits your approach.
((number of periods) – (number of periods since maximum high)) (number of periods) x 100) is the formula for calculating Aroon up.
For example, if we have a 25-period Aroon up line and the greatest price in the previous 25 periods was 20 periods ago, the aroon up will be ((25-20) 25) 100 = 20.
This formula calculates the amount of time it has taken for asset price to reach its most recent peak and converts the results to a percentage.
((number of periods) – (number of periods since lowest low)) (number of periods) x 100) is the formula for calculating aroon down.
This formula calculates the amount of time since the last low was hit and provides the results as a percentage.
When Aroon up and Aroon down are heading down in close range, it indicates that the market is in a consolidation period with no clear trend. When Aroon up falls below 50, it signals that the present upward trend has slowed. Similarly, if Aroon falls below 50, the present downturn will lose steam. A strong trend in the same direction as the Aroon up or down is beginning when the value exceeds 70.
Steps involved in Setting Up Aroon indicator
Aroon Indicator is simple to set up on a chart; most chart sites include built-in indicators, so all you have to do is click on the one you want on your chart.
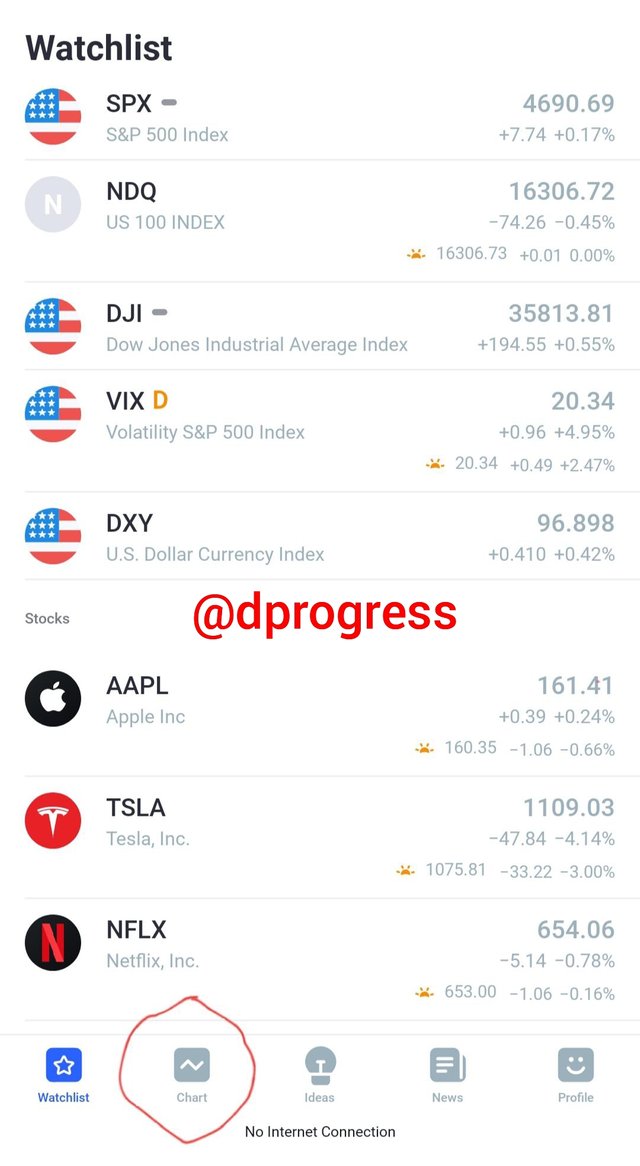
To demonstrate how to set the indicator, I'll use trading view.
To begin, open the trading view app and select the chart. Choose the asset you wish to analyze; I'll be looking at ETHUSDT.

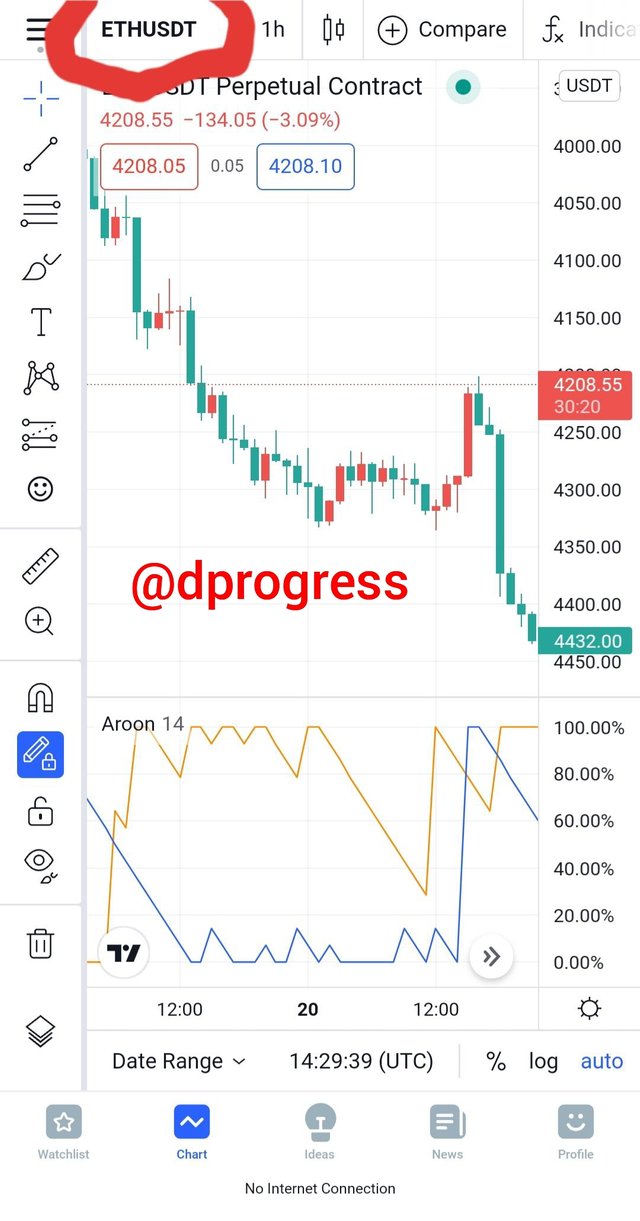
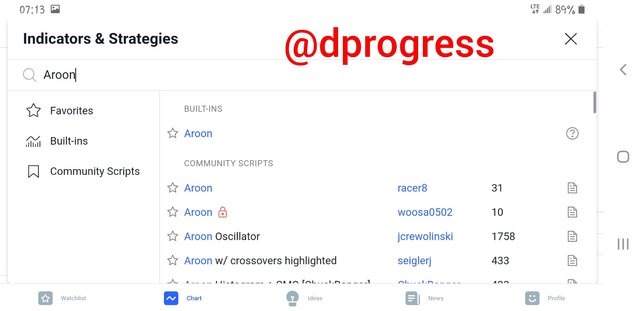
The different types of aroon indicators accessible on the applications will be listed when you click on the indicator and search for the Aroon indicator; I'm using the first one. The aroon lines will be automatically plotted below.
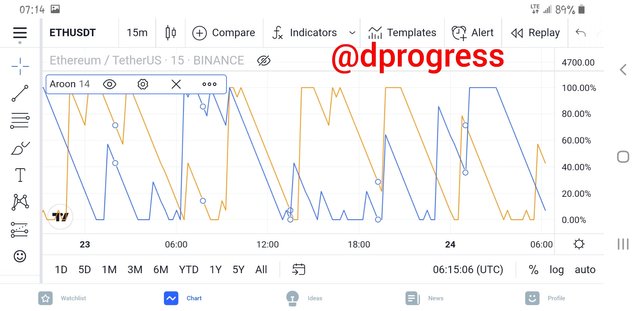
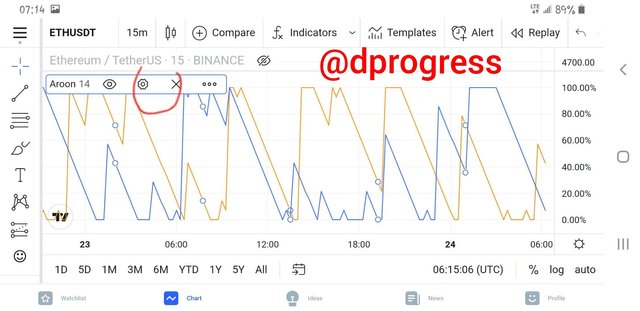
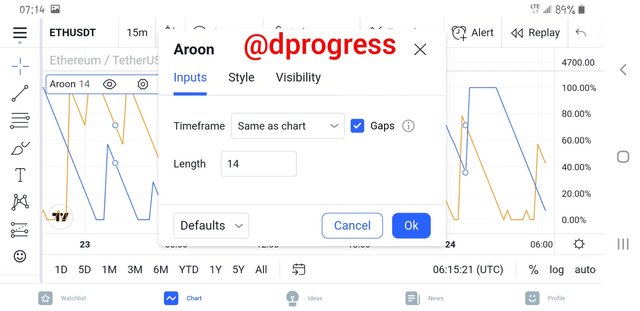
To change the period, click on the line and one small bar will appear. Click on the settings icon in the small bar to change the period.
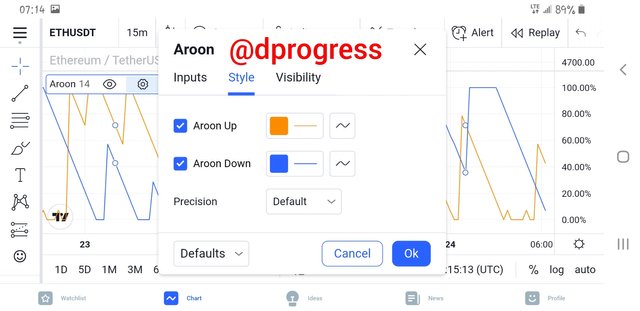
Click on the inputs to change the period.The app replaced the word period with the word length. Change the 14 period to any number of periods you want to use, let's try 25 and I'll be changing my aroon up and down colors to green and black.
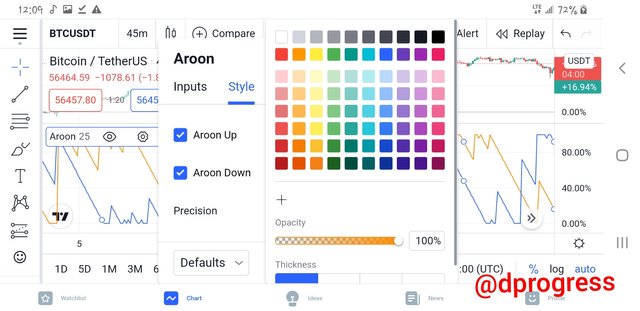
Your aroon's color can be changed to any colour you like. Simply click on the color icon and choose from the list of available colors to change the color.
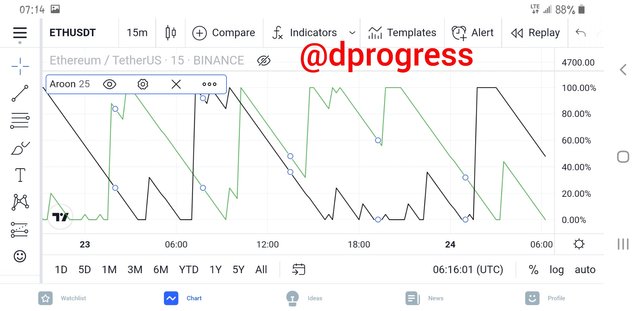
The waves are noticeably different from those of the 14 period. Let's also test the 50- period.
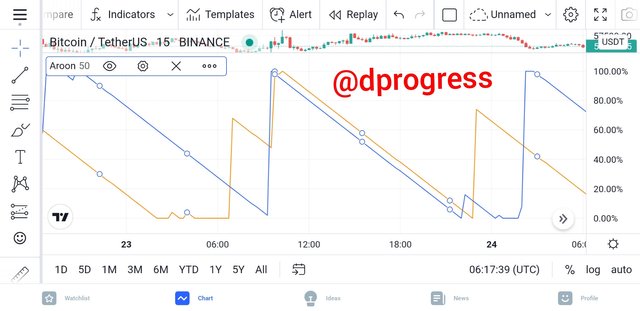
That's all there is to do when it comes to putting an aroon indicator on a chart.
Aroon Oscillator
The Aroon Oscillator is basically the difference between Aroon-Up and Aroon-Down. The Aroon up and down are normally shown together for convenient assessment and review, however you can quickly see the difference between the two indications using the aroon oscillator. With 0 as the middle line, the Aroon oscillator oscillates between -100 and +100. There is a bullish trend when the oscillator is positive, that is, when it is between +100 and +1. There is a bearish trend when the oscillator line is negative, which is between -1 and -100.
The formula to calculate aroon oscillator is : Aroon Up - Aroon Down
The Aroon oscillator is part of Tushar Chande's Aroon indicator system, which he invented to indicate short-term trend fluctuations.
Before calculating the Aroon Oscillator, the other Aroon indicators (Aroon Up and Aroon Down) must be calculated first. The calculations of Aroon up highs and Aroon down lows provide an opposing connection between the two lines.
When the Aroon Up value goes up, the Aroon Down value usually goes down, and when the Aroon Down value goes up, the Aroon Up value almost always goes down. The oscillator value will be high, following the uptrend, if the Aroon Up value continues high from consecutive new highs.
The Aroon Down value will be larger when the market is in a downtrend with frequent new lows, leading to a lower oscillator value.
Readings over 0 on the Aroon oscillator indicate the presence of an uptrend, while readings below 0 indicate the presence of a downturn. Traders keep an eye out for 0 line crosses, which might indicate a probable trend change. They also keep an eye out for significant fluctuations, such as those above or below 50, which indicate strong price movements.
Measurement of the Trend at +50 and -50
Values more than +50 indicate a strong bullish trend, while values less than -50 suggest a strong negative trend for the Aroon oscillator.
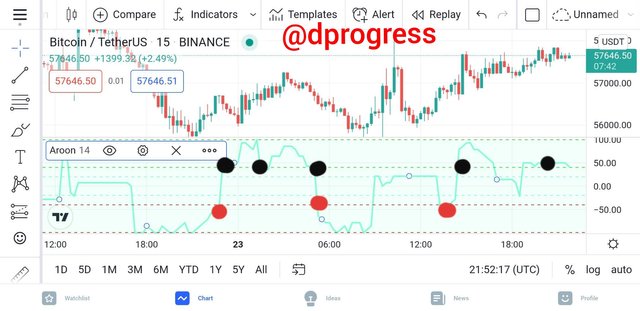
The Aroon's single line is displayed in the graph above. The black dots represent price levels of +50 and the red dots represent price levels of -50.
Aroon Indicator Movement in Range Markets
A ranging market is one in which the price of an asset fluctuates between higher and lower price levels. The market is also known as range bound, sideways.
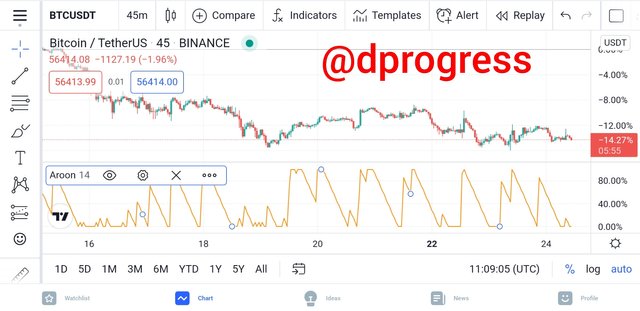
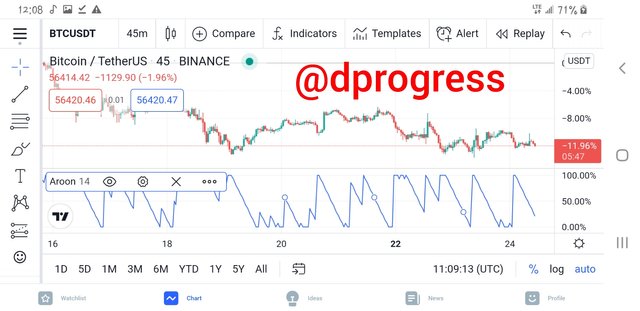
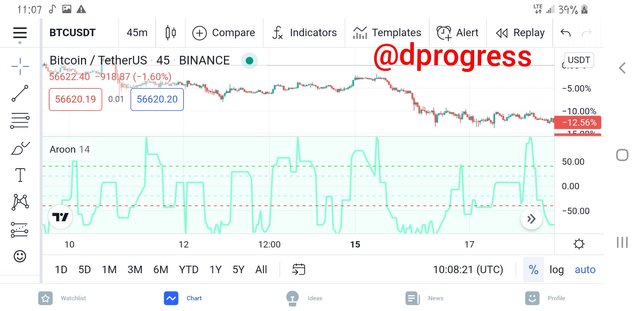
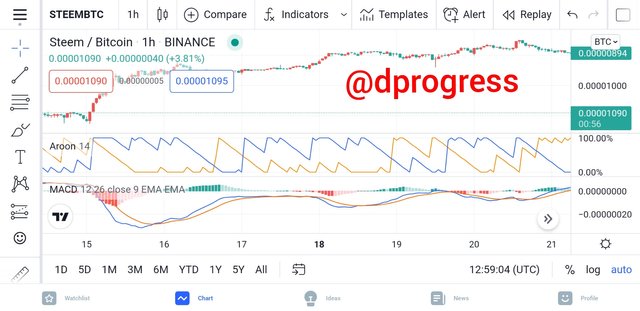
The Aroon indicator can be used to spot a market that is ranging. The Aroon Up and Aroon Down would move in lockstep in range markets, with no crossing between the lines. When a crossover happens, the range comes to an end, and the new trend might be either bearish or bullish. Let's look at the BTCUSDT crypto currency pair for a better understanding.
The aroon up has been going down and the aroon down has been going up, but they keep returning to their former position, signifying that the market is consolidating. The market is ranging when the aroon up and down moves in lockstep.
False and Late signals
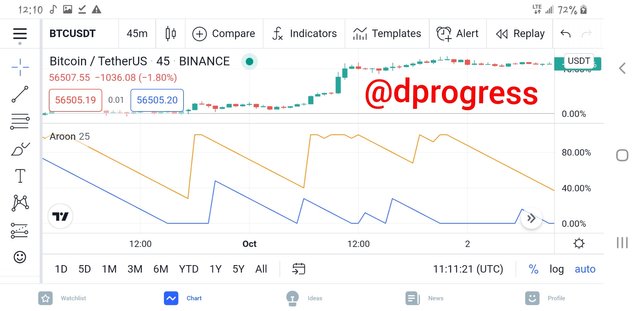
The Aroon indicator is a good technical tool in deciding entry and exit points but like every other technical indicator, it is not fully perfect as it gives late or false signals sometimes. It can give a false buy or sell signal or indicate buy or sell signal when a substantial price move has already occured making it too late to make trading decisions. The Indicator only takes into account past price movement and can't predict the future market movement on it own so it is prone to give false signal
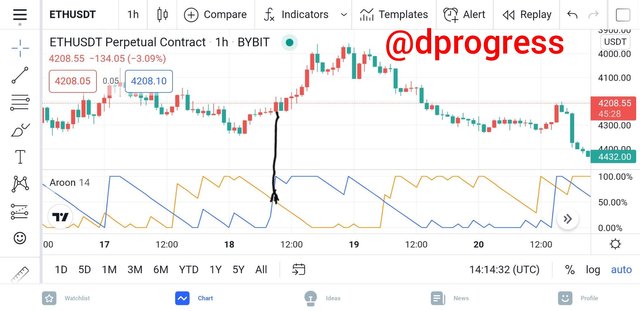
In the image above, the Aroon indicator signalled the bearish trend late as the downtrend has started from previous candlesticks.
The moving average Convergence divergence is one of the best indicators to combine with the Aroon indicator.
It is easy to filter false signals using these two indicators together because when Aroon lines and MACD histogram moves in a similar direction, it is convincing enough to know that the trend direction is strong.
In the image above we can see our both MACD and aroon indicator signalled bearish trend which later reversed to bullish trend which wasn't so strong and later on the market entered consolidation before changing to bullish again.
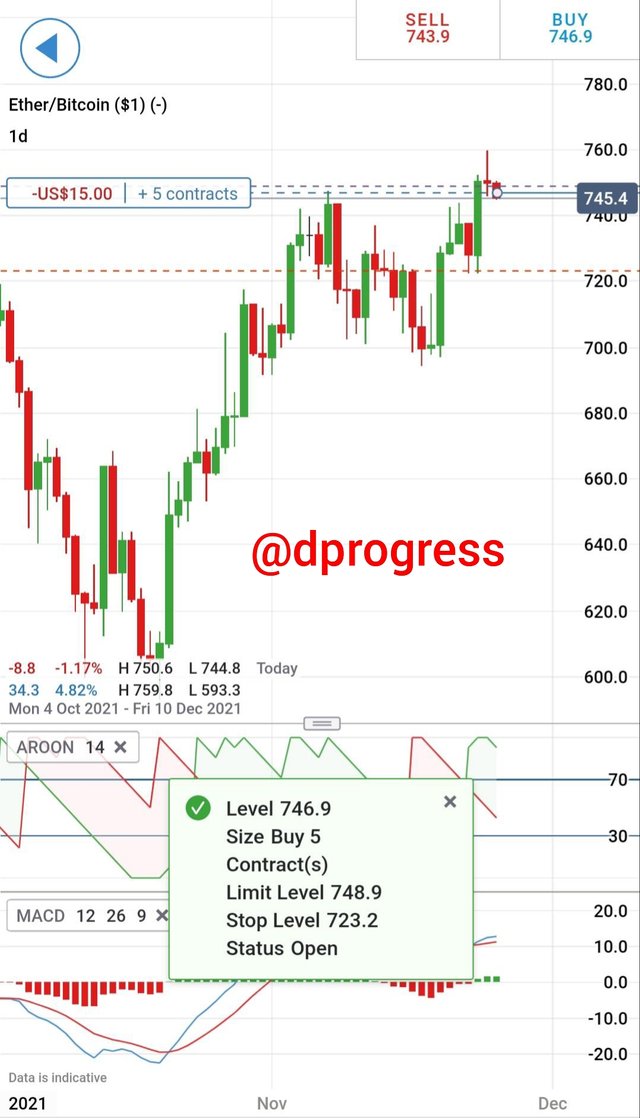
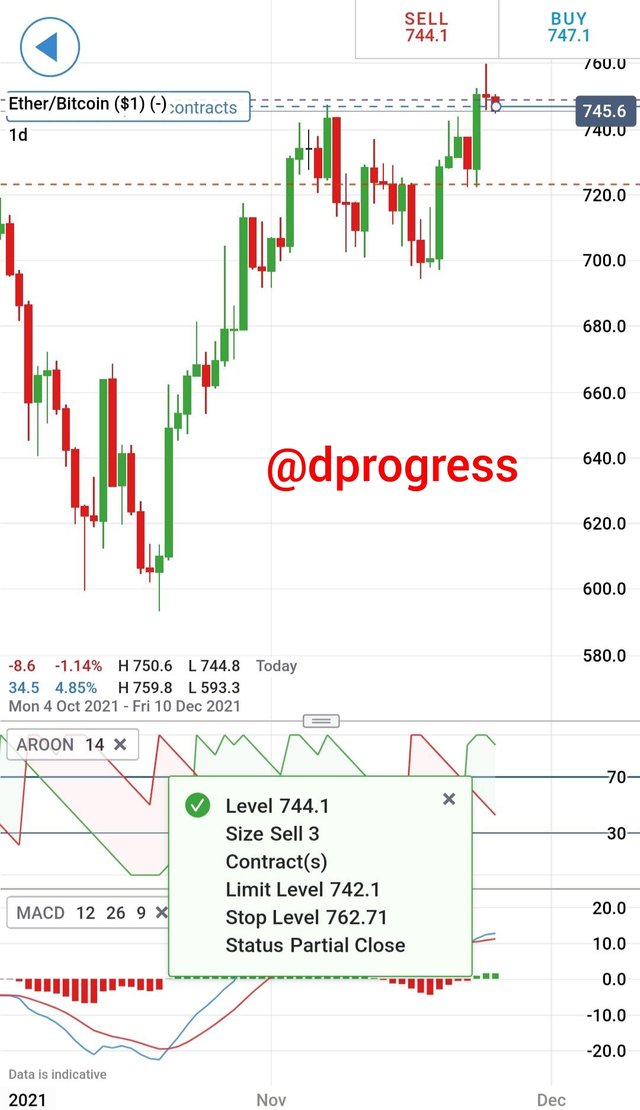
Buying and Selling trade using the Aroon Indicator
I keep an eye on the aroon indicator's 80 and 20 scales because when Aroon up moves above 80 and Aroon down falls below 20, it signals a strong bullish trend, therefore I place a buy order. Also, when the aroon up has remained at 100 for a long time, the market has a strong tendency to decline, therefore I conduct additional research to choose where to put my sell order.
For practice, I'll use an IG demo trading account.
To study the market trend and set my buy and sell orders, I use the aroon indicator and the MACD.
Merits and Demerits of Aroon Indicator
There are numerous advantages to using an aroon indicator, including the following:
- For first off, this indicator can be used to spot new trends and determine whether the market is bullish or bearish.
Second, it can be used to analyze trend strength; when the trend is above +50 or -50, it indicates a strong bullish or bearish trend. - Furthermore, because the line moves parallel during this time, it can be utilized to detect ranging market and consolidation levels.
- The Aroon indicator is effective at predicting market reversals. When there is crossover, market reversals are common.
There are some disadvantages to using the Aroon indicator.
- To begin with, the indicator offers false trading signals in range markets since the oscillator whipsaws up and down due to the quick swings in price, and there are also occasions when the indicator gives real signals but they're too late to be used.
- Second, analysts and traders cannot make trading decisions just on the basis of these indicators; they must combine it with other indicators in order to make the best trading decisions.
Thanks for reading