How to Trade Cryptocurrencies Profitably Using TD Sequential]-Steemit Crypto Academy | S4W8 | Homework Post for @reddileep
Cryptocurrency has transformed the world, improving the financial system while also opening up new opportunities. People now make a career off of cryptocurrencies; we have traders, holders, and developers that profit from the development and use of cryptocurrency.
Traders and holders profit by forecasting when the ideal timing is to enter or exit the market. To do so, they use technical analysis indicators, which are essential tools that may identify and predict market direction.
We have Fibonnacci retracement level, relative strength index, moving average convergence divergence, bollinger bands, TD Sequential, and other indicators that serve different purposes.
Thank you very much Professor @reddileep for your teaching on the TD sequential indicator, I will answer the homework task given to us after your class on this post
Question 1: Define TD Sequential Indicator in your own words.
TD (Tom Demark) Sequential
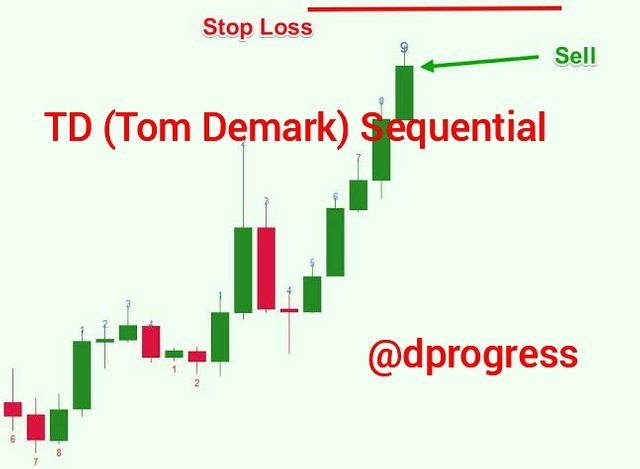
The TD (Tom Demark) Sequential, also known as the Demark indicator or DeM, is a sophisticated technical analysis tool that aids in determining the precise timing of trend exhaustion and asset price reversal. DeM evaluates the market's directional trend by comparing the most recent maximum and minimum prices to the corresponding price from the prior period.
This indicator was developed by Thomas Demark, a well-known technical analyst, as a counter-trend tool to address the issue with other technical analysis indicators that perform well in trending markets but badly in range markets. Traders use market trends to identify when to enter the market or when to purchase or sell an asset in order to profit from market trends since they indicate impending market changes.
TD Sequential indicator, based on my study, can be used on any timeframe and in any market circumstance. However, it is best to apply it on longer timeframes and in conjunction with other indicators to forecast price exhaustion points, market peaks and bottoms, and overall risk assessments.
Question 2: Explain the Psychology behind TD Sequential. (Screenshots required)
I'll discuss Tom DeMark's Sequential Indicator's psychology. The indicator essentially highlights the end of local trends, assisting in the identification of when the trend is fading and beginning to reverse, and it works best on bars and Japanese candlesticks.
Price flip, TD setup, and TD countdown are the three components of this technical indicator.
Price flip: Price flip is an indication of a potential market trend reversal that happens before TD setup or shortly after TD countdown and is made up of six candlesticks, making it easy to spot on charts. Price flipping has two components: sell price flip and buy price flip.
When the market records a close higher than the close four bars earlier, followed by a close lower than the close four bars earlier, this is known as a sell price flip. The majority of the time, a buy setup comes soon following a sell price flip. This is often referred to as a bearish price flip.
On the other side, buy price flip is the contrary of sell price flip; it occurs when the market closes higher than the close four bars earlier, followed by a close lower than the close four bars prior. Bullish price flip is another name for it. As soon as these patterns are established, the next elements begin to take shape.
Td setup: Td setup, also known as the momentum phase, is primarily used to filter out signals in order to confirm if the market has fully changed direction or is only changing direction for a brief period of time. The current close is compared to the previous close four candles prior in the TD Setup. At least nine successive closes higher or lower than the close four candles earlier are required. There are two kinds of TD setups: TD buy setup and TD sell setup.
Td buy setup happens when there is a bearish price flip, which shows that the market's momentum has shifted from positive to negative. When 9 consecutive closes are lower than that of the close 4 candles earlier, a Buy Setup is formed. The low of candle 8 or candle 9 should be lower than the lows of candle 6 and candle 7 for an ideal buy setup. If a candle closes higher than the close of the four candles before it, the setup is canceled.
Td sell setup happens after a bullish price flip, indicating a change in market momentum, indicating a shift from a negative to a positive trend. There must be nine successive closes, each one higher than the four-candle previous close. The high of candle 8 or candle 9 should be higher than the highs of candle 6 and candle 7. This is the ideal sell setup. If a candle closes lower than the close four candles prior, the setup is gone, and the only option is to wait for the next price flip.
TD Countdown: Also known as the exhaustion phase, the TD countdown occurs after a TD setup has been formed and serves in estimating how long a trend will last, when it will fade, and when the next price flip will occur.TD Countdown counts 13 bars by comparing the current close to the low or high of two candles prior. It is not neccessary for the 13 candles to be in consecutive sequence, you can count further even when interrupted. There are two types of TD countdowns: TD buy and TD sell.
The td buy countdown begins after the completion of a td buy setup and continues as market prices decline. Candle 9 of the td setup will become candle 1 of the td countdown if the close of bar 9 is lower than the low two candles earlier.
If the requirement is not met, candle 1 of the td countdown is delayed until the requirement is met, and you count till there are thirteen closes, each one lower than or equivalent to the low two candles prior.
When the market price moves higher, the TD Sell Countdown is started after the completion of a td sell setup. Candle 9's close should be higher than the high of the two candles before it, indicating that candle 9 of the td setup will become candle 1 of the countdown. If the requirement is not met, candle 1 of the countdown is delayed until the requirement is fulfilled, and you count till there's a total of thirteen closes, each one higher than or equal to the high two candles before.
Question 3: Explain the TD Setup during a bullish and a bearish market. (Screenshots required)
Now that we've covered what a td setup is, let's look at how it can be used in both bullish and bearish markets.
Bullish Market
If a candle manages to close higher than the close of four candles earlier, an initial starting number of '1' is plotted. Because the TD Sequential repeats itself, the four-period rule is essential for its calculations. As a result, the number '2' is plotted only if the second candle closes higher than the closing of the previous four candles.
When the TD Sequential plots the number '9' on top of a candle, it marks the start of the reversal. To put it another way, when 9 successive candles close higher than candles from the previous 4 periods.
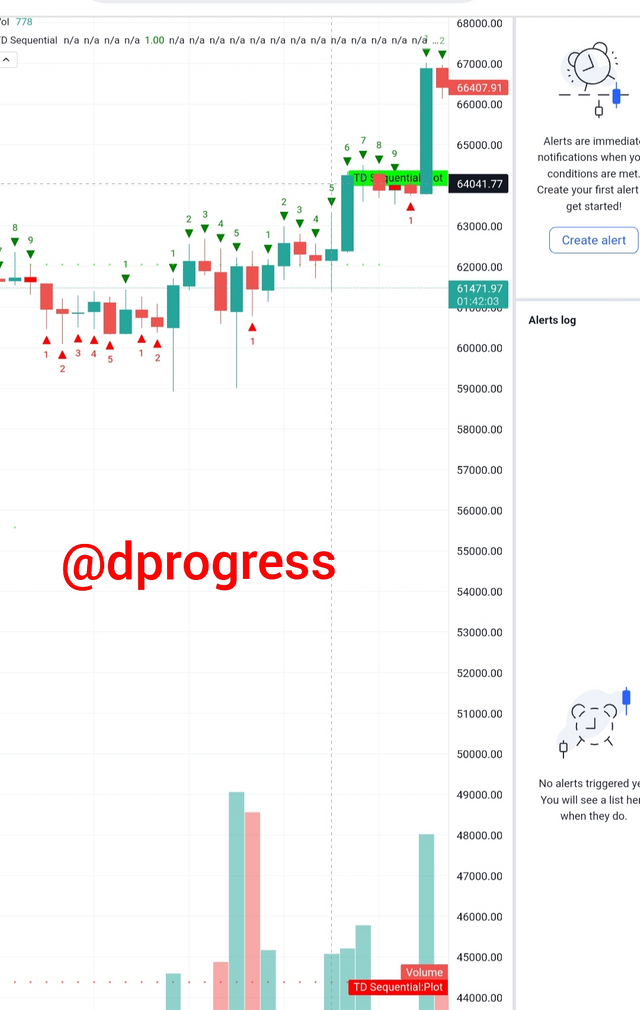
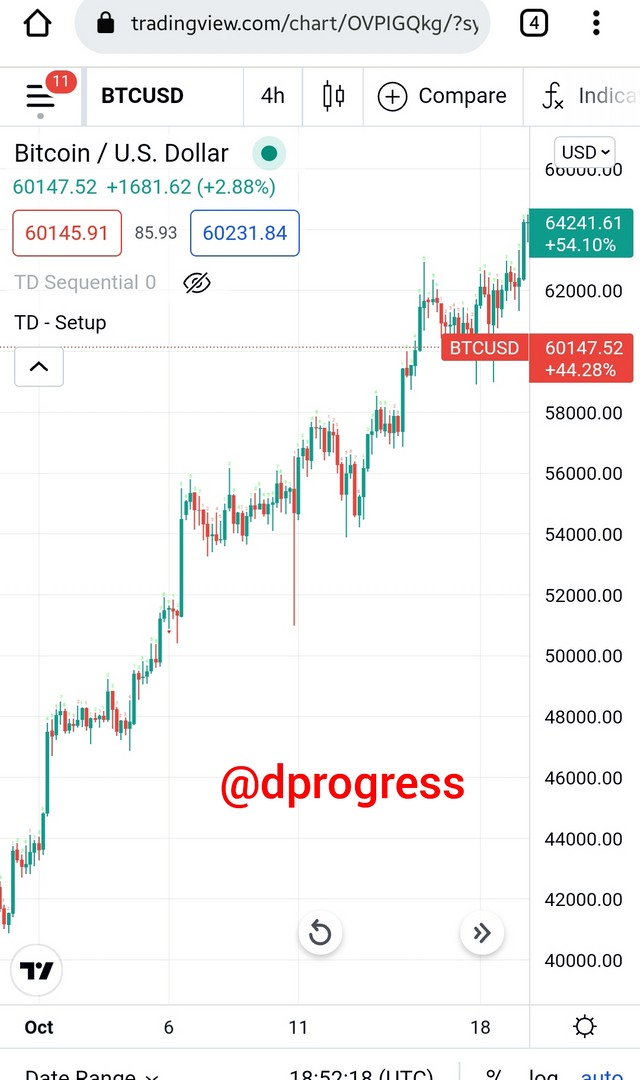
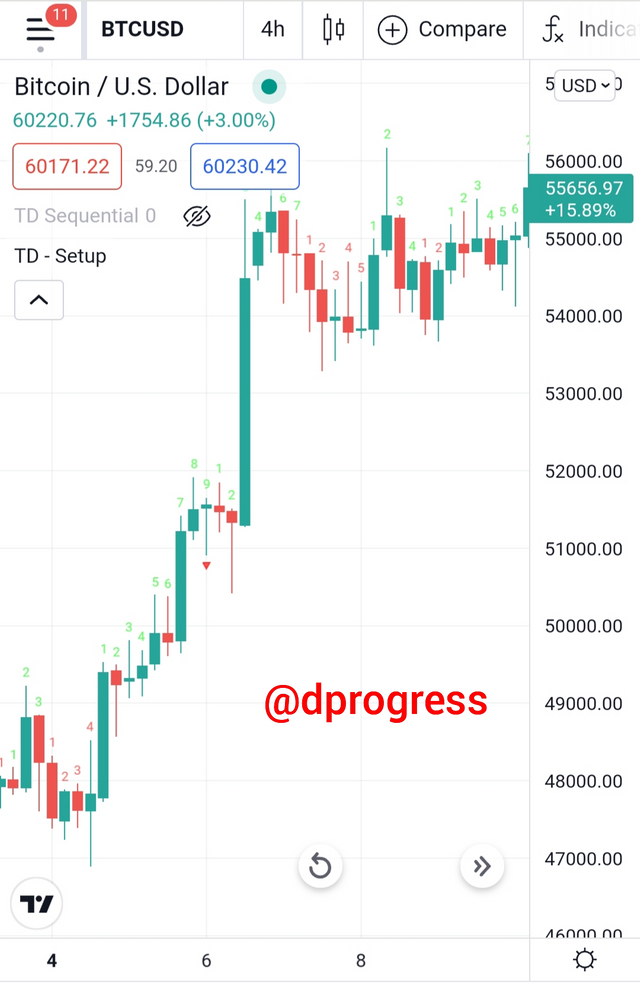
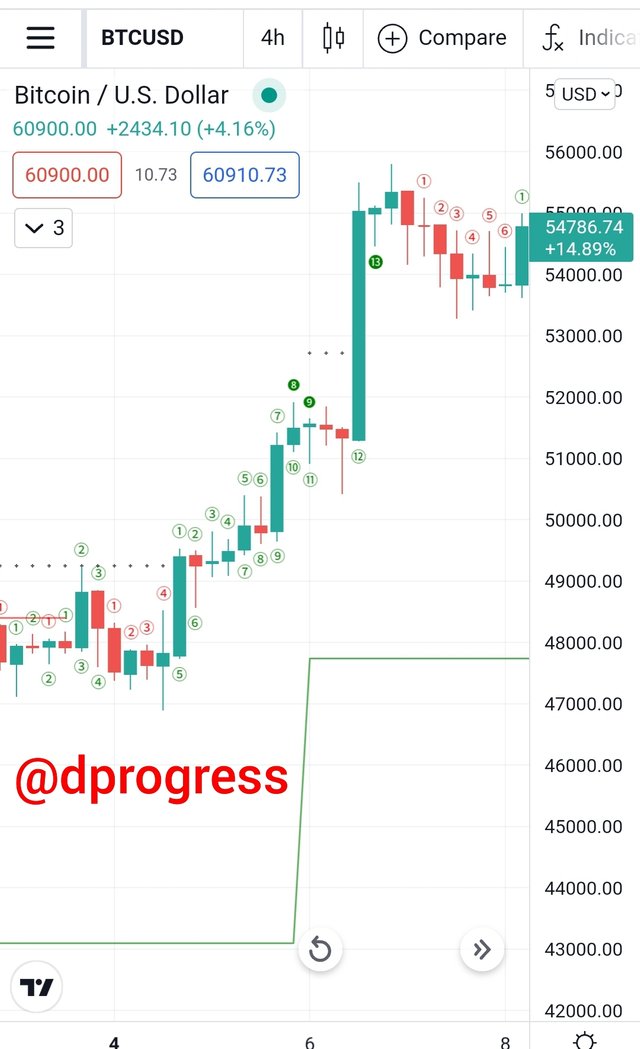
In a bullish market, the highs of the 8th and 9th candles must be higher than the highs of the 6th and 7th candles for the perfect td setup. The TD setup is automatically disrupted if a candle closes lower than the candle four periods earlier at any point. An example is the image of BTCUSD chart with TD setup indicator in a bullish market.
Bearish market
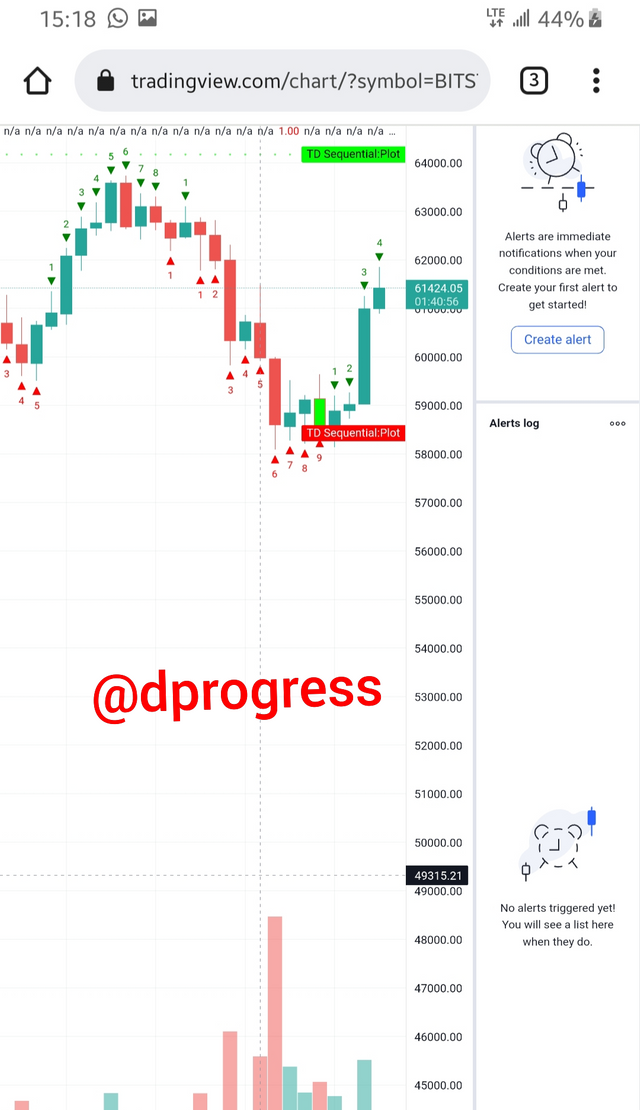
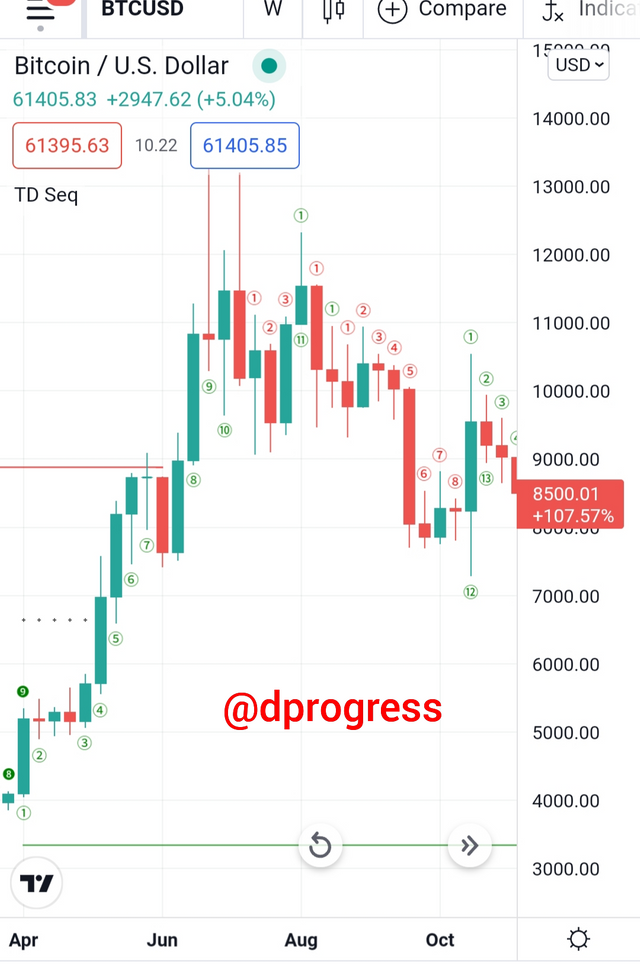
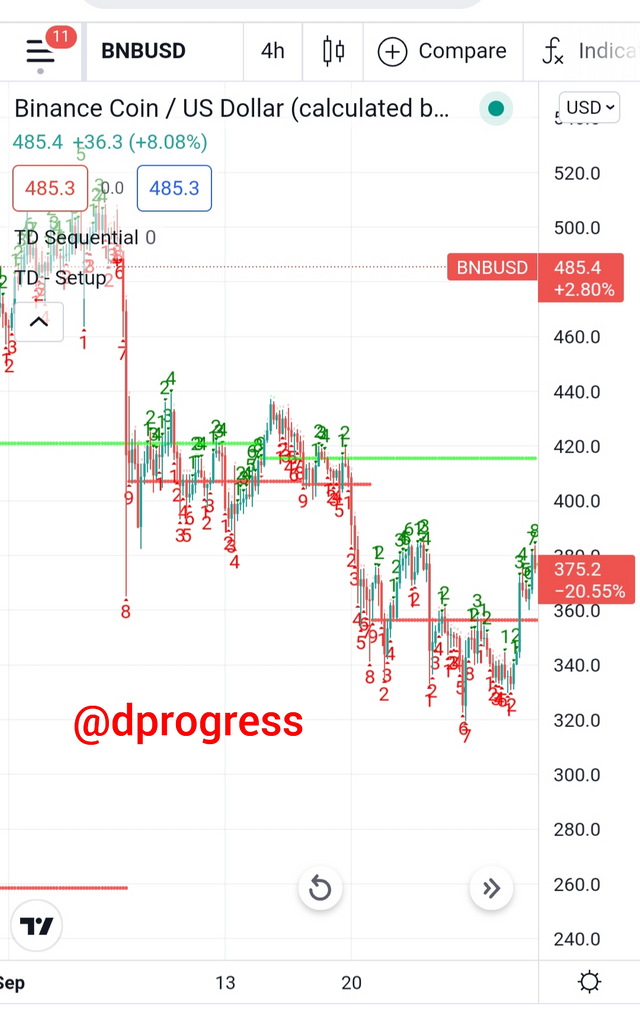
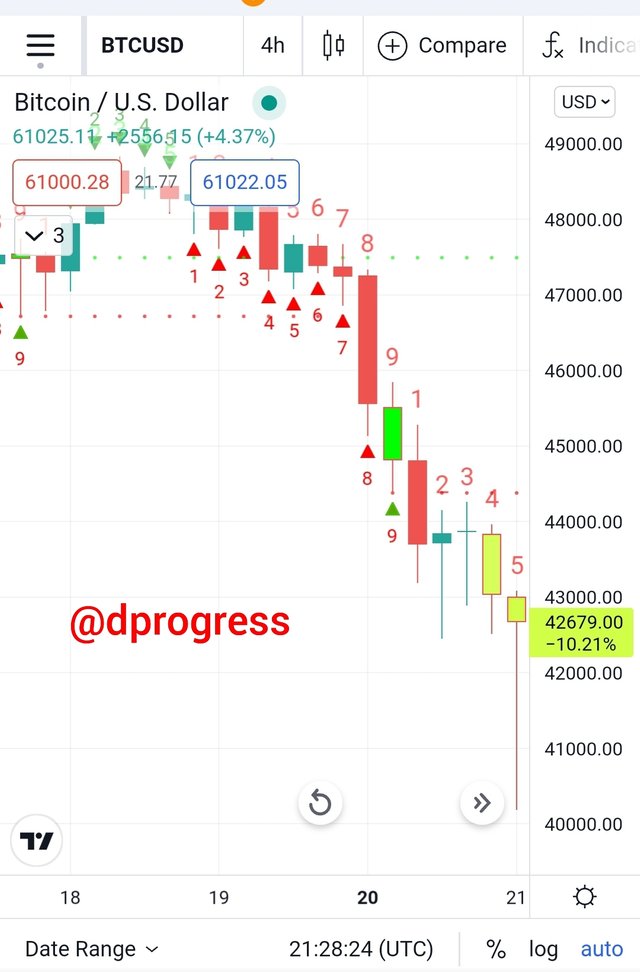
If a candle closes lower than the close of the previous four candles in a bearish trend, the initial starting number '1' is plotted. This procedure is followed for all subsequent candles. When the TD Sequential shows the number '9' on the bottom of a candle, it signals a reversal. To put it another way, when 9 successive candles close lower than the 4 candles before them. The lows of the eighth and ninth candles must be lower than the lows of the sixth and seventh candles in order for the arrangement to be perfect. The TD setup is automatically terminated if a candle closes higher than the candle four periods earlier at any point. The bnbusd image below is an example.
Question 4: Graphically explain how to identify a trend reversal using TD Sequential Indicator in a chart. (Screenshots required)
A change in the market direction of an asset, such as a stock or cryptocurrency, is referred to as a trend reversal.
It occurs when a bullish trend turns into a bearish trend or vice versa.
The Td Sequential indicator can be used to predict when a trend will revert.
When a market is in a bullish trend, the price of an asset continues to rise, the simplest way to tell when the market is about to turn bearish is when the high of candle 8 or 9 is higher than the highs of candle 6 and candle 7. This is the ideal time to place a sell order in order to profit before the price turns bearish.
For example, there was a TD sell setup on the ETHUSD picture chart below, and the trend began to shift to negative.
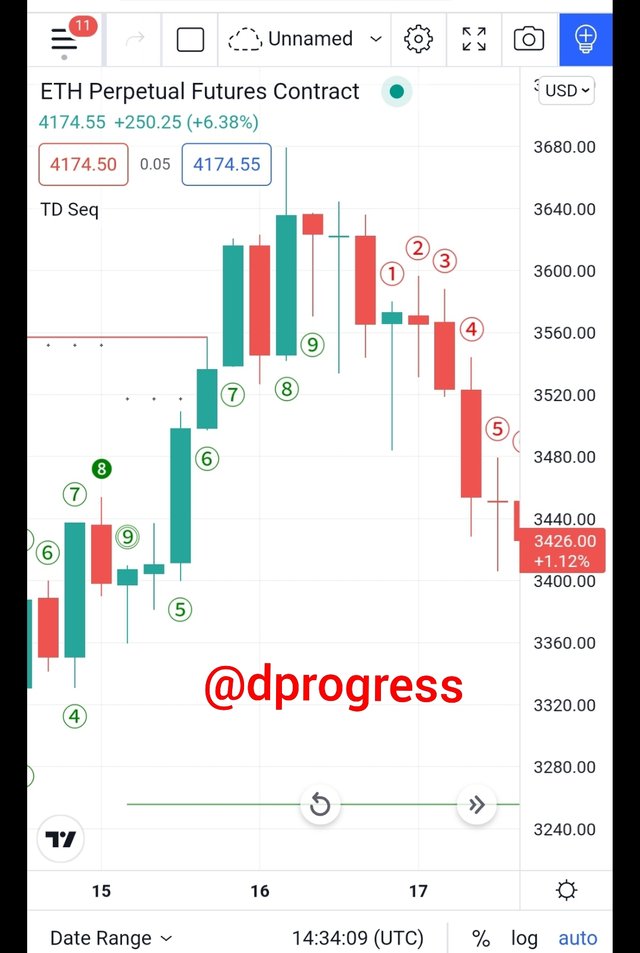
When the bullish trend also reaches 13 and the candle is higher than candle 8, the market changes to bearish again.
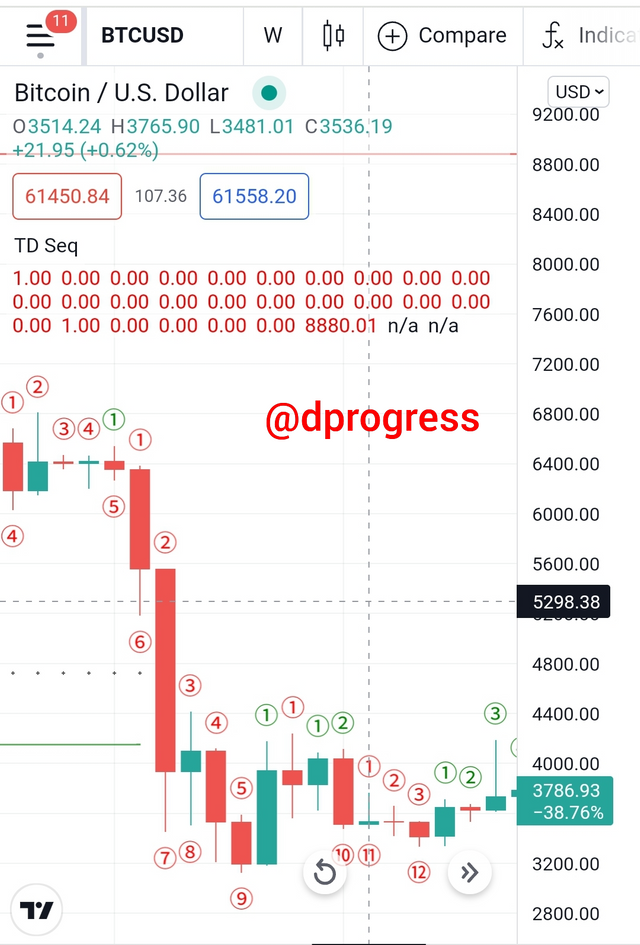
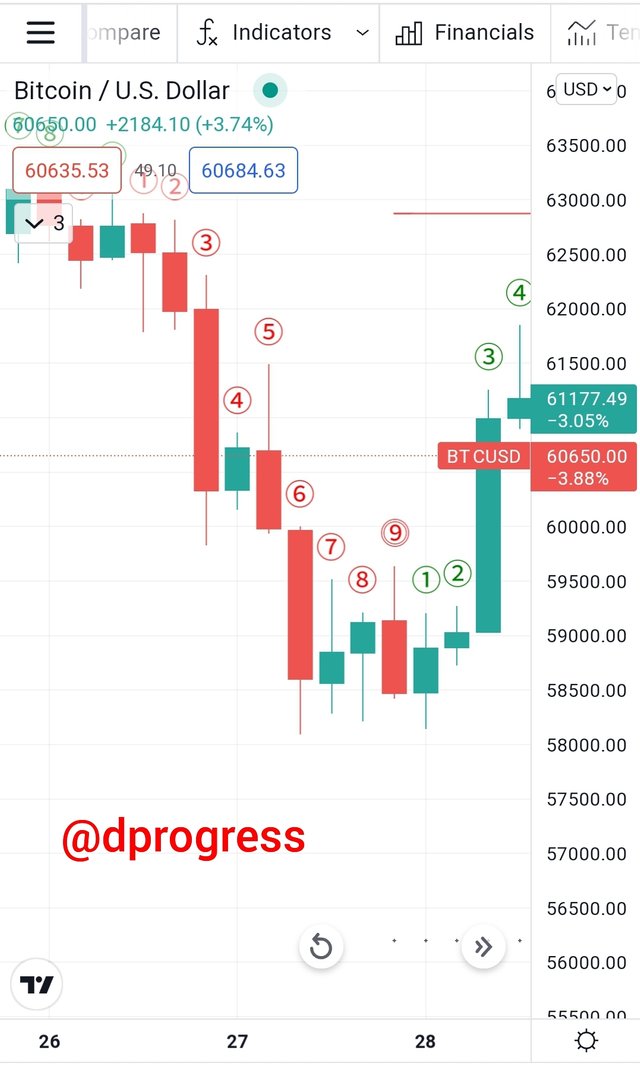
When a market is also in a bearish trend, the strongest indicator of a trend reversal is when the low of candle 8 or 9 is lower than the low of candle 6 or 7. This is the best time to invest because the asset is at its lowest point before resuming its upward trend.
An example is the image below.
Question 5: Using the knowledge gained from previous lessons, do a better Technical Analysis combining TD Sequential Indicator and make a real purchase of a coin at a point in which TD 9 or 8 count occurs. Then sell it before the next resistance line. (You should demonstrate all the relevant details including entry point, exit point, resistance lines, support lines or any other trading pattern such as Double bottom, Falling wedge and Inverse Head and Shoulders patterns.)
In this question I will make use of my Binance exchange to buy Litentry Coin using the TD Sequential Indicator.
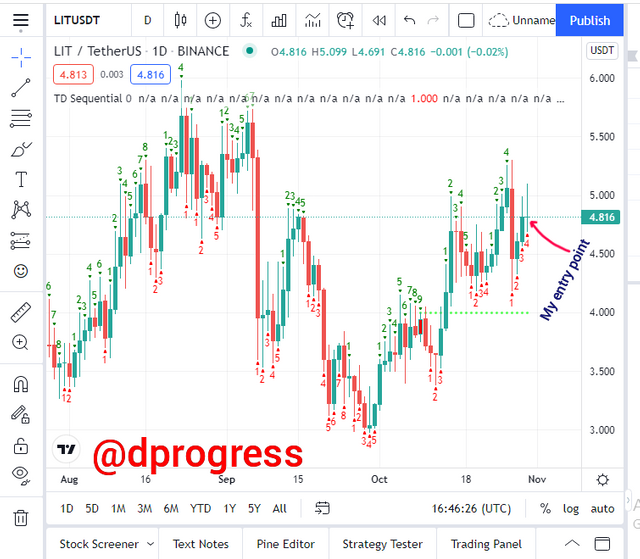
I enter the buying of the coin when my TD sequential indicator is 4 from my Trade view.
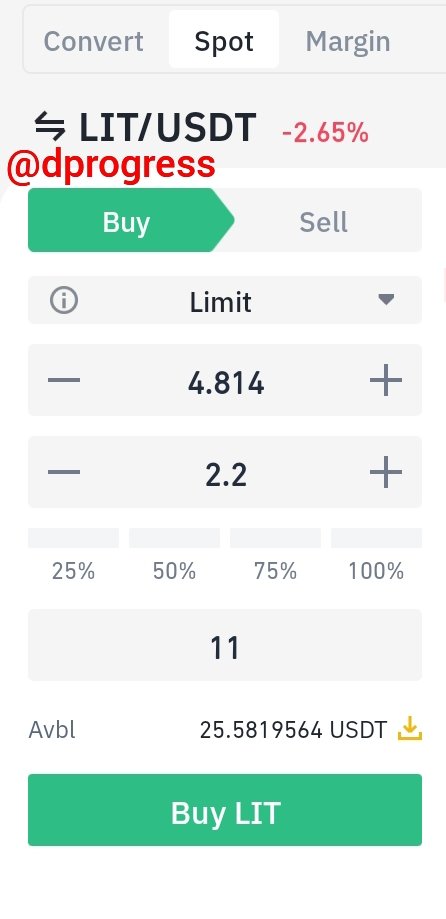
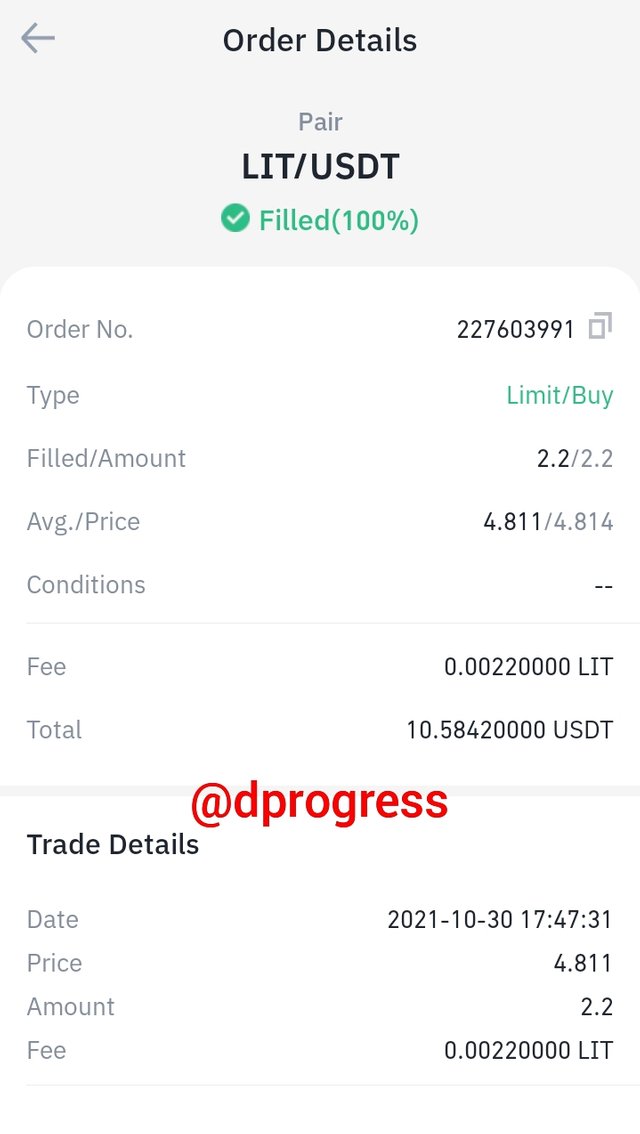
I placed a buy order of 11USDT for 2.2 lit coin and at the end of the order, 10.58USDT worth of 2.197 LIT coin at the price rate of 4.814 was allocated to me from Binance exchange.
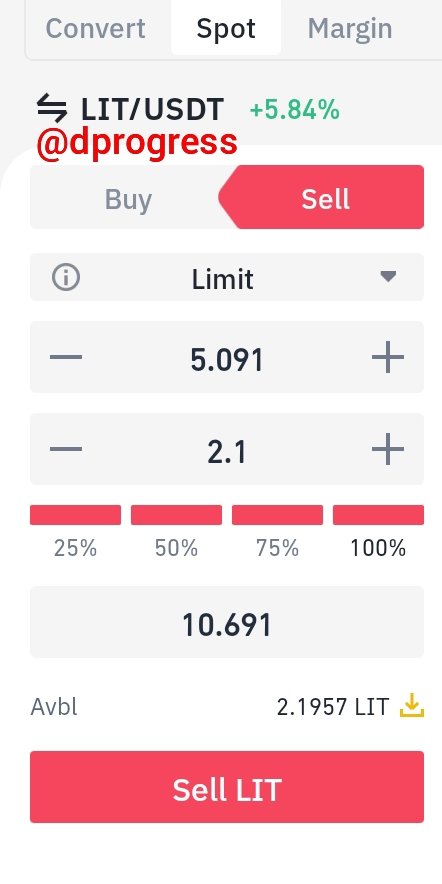
I waited for some hours then i took my exit when the TD sequential indicator is 2 and at that time the price of LIT coin is 5.091 and i sold my coin at the rate of 10.691USDT.
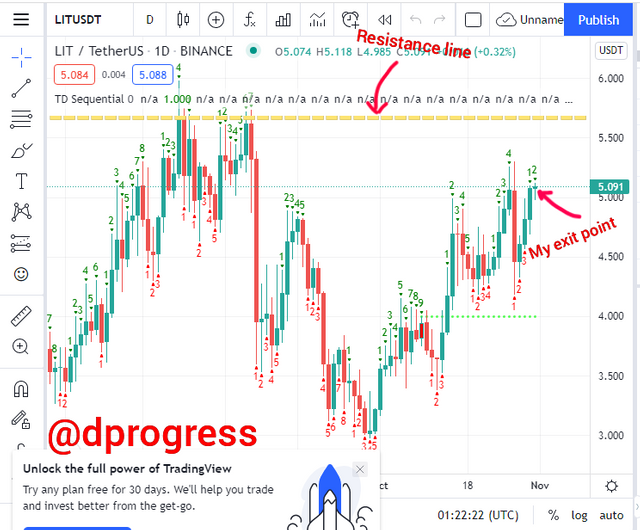
This is the trade view when I was exiting the market.
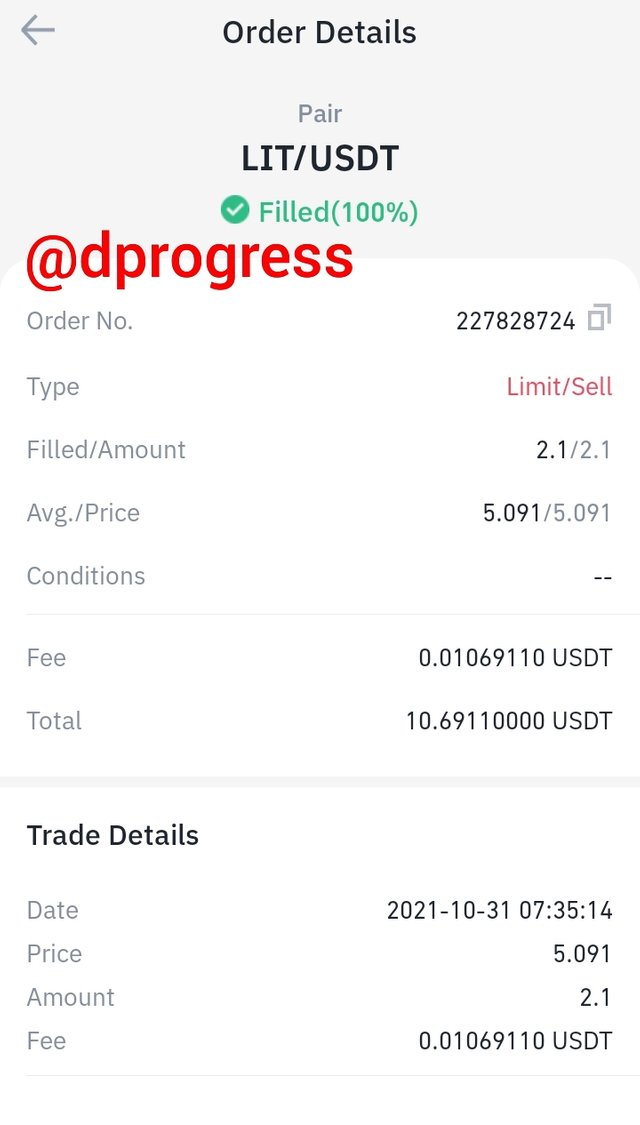
The interest I made from this trade is 10.691USDT - 10.58USDT = 0.111USDT.
This is the end of my homework post.
Thanks.
@reddileep
#club5050 😀