Crypto Academy /S4W8-Homework Post for kouba01
Equipment is critical to doing any activity properly; you can have extensive knowledge of a task but be unable to complete it without the necessary equipment. A farmer requires tools to farm, a tailor requires tools to sew nice clothes, and teachers require resources to share their knowledge with students. The cryptocurrency ecosystem is not exempted; holders and traders alike want tools to make intelligent investing and trading decisions.
Technical analysis indicators are one of the tools used by crypto users.
Technical indicators are chart analysis tools or pattern-based indicators generated by an asset's price and trade volume that help traders better understand the market and decide what to do next.
RSI, MACD, TD Sequential, fibonacci retracement level, bollinger bands, pivot points, ROC, and other technical indicators are examples. These are essential indicators that serve various or comparable purposes. This article will concentrate on ROC.
Question 1: In your own words, give an explanation of the ROC indicator with an example of how to calculate its value?And comment on the result obtained.
Rate of Change (ROC)
The rate of change is a momentum technical indicator that measures the percentage rate of change in an asset's price between its current price and its previous price over a given period. It helps traders in determining trend direction, overbought and oversold conditions, and asset movement. When the rate of change is above the 0 line and continues to rise, or when it falls slightly but quickly rises over the prior resistance, it indicates that the market is in a rapidly increasing and ongoing bullish trend. When the Rate of Change approaches 0, however, it indicates that the bullish trend is slowing and that the trend may turn bearish.
When the Rate of Change is below 0 and still declining, the asset is in a rapid bearish trend. However, if the Rate of Change is below 0 but begins to rise upward towards the line, it indicates that the negative trend is slowing and may change to bullish.
Steps to Calculate the Rate of Change
When you know the formula and the range of periods you want to use, calculating ROC is simple. Analysts can use a variety of period durations, which are indicated by the letter "N." They have 2 to 200 period lengths available to them.
We have 250 trading days in a year, 165 trading days in six months, and 21 trading days in a month; a long-term trader can use 200 days, but it reacts slowly to price movements; short-term traders can use small numbers such as 2 to 50, although the default number on most trading charts is 12 or 14. Smaller "N" ROC values react fast to price fluctuations, which can lead to false signals and mislead traders, which is why traders prefer 12 or 14.
The formula to calculate Is ; ROC = [(Current Close price – Close price of N periods ago) / (Close price of n periods ago)] X 100.
The steps are as follows: Choose the length of time you want to use. It may be nine, twelve, twenty-five, or two hundred. Find the closing price of the most recent period and the close price of n periods, then remove the current close price from N close price, divide by N close price, and multiply by 100. Simply follow the formula I've provided above for a clear understanding.
For example, if a bitcoin today's close price is #1000, and the closing price 9 days ago was #700 then the 9 day ROC would be; ROC = [(1000 – 700) / (700)] X 100 = 42.85714286 ===== 42.86%
The asset is bullish, and the market is bullish because the price is well above the crossover line.
Question 2: Demonstrate how to add the indicator to the chart on a platform other than the tradingview, highlighting how to modify the settings of the period(best setting).(screenshot required).
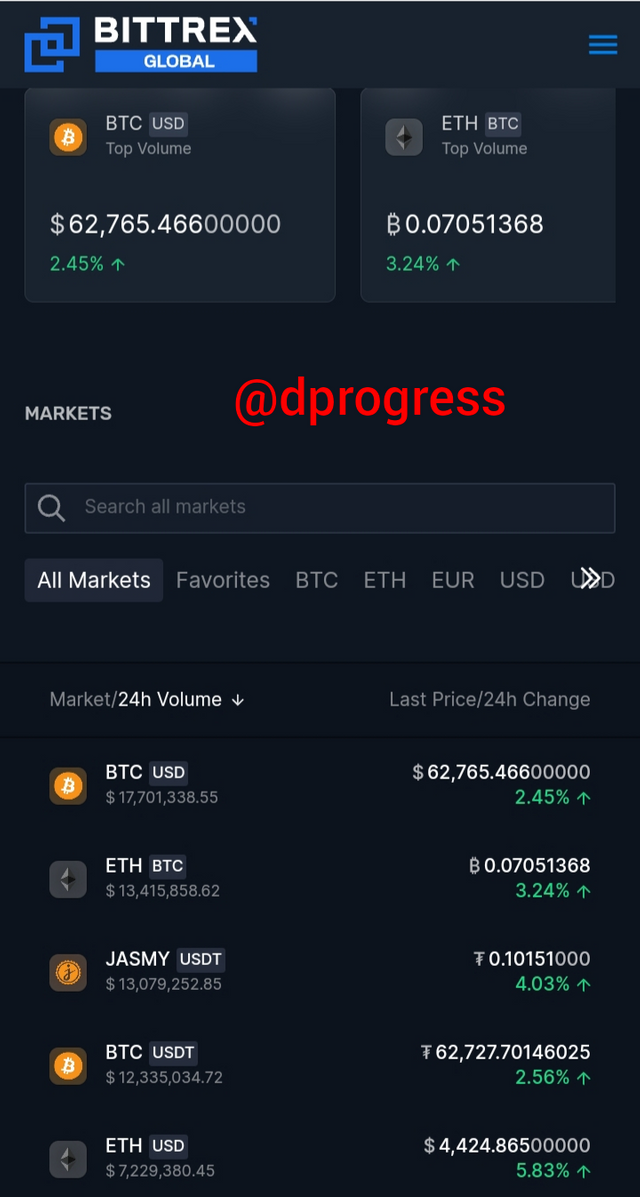
I'm demonstrating with bittrex exchange trading chart.
The site address is https://bittrex.com
Step 1: I'm using BTCUSD pair so I'm clicking on it
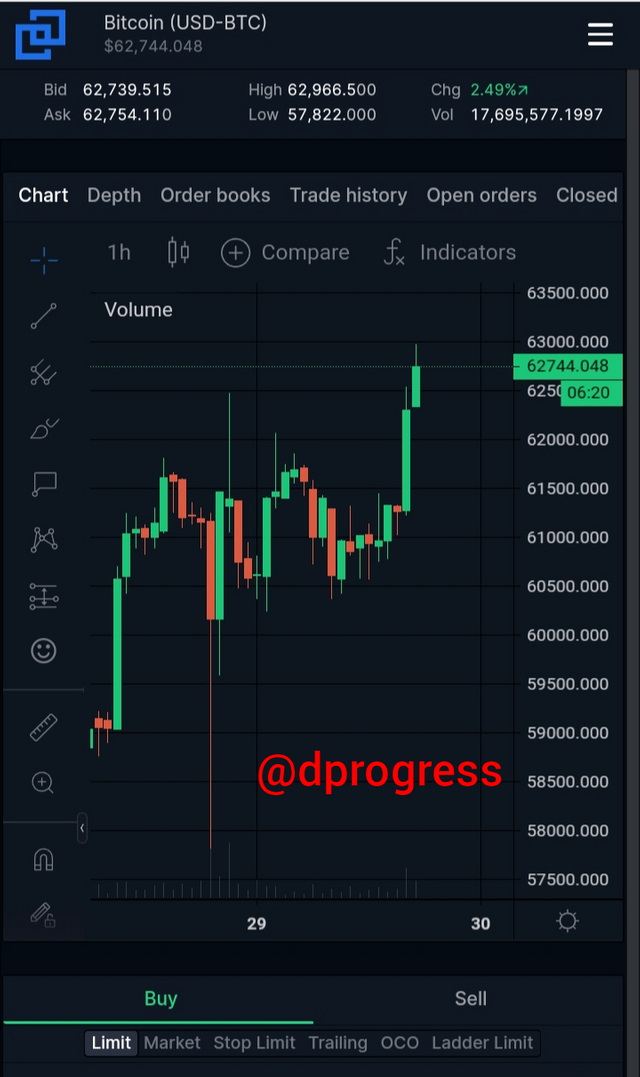
Step 2: There is the chart bar, the trade dept bar, the order book bar, and so on.My main focus is the chart and I have clicked on it. That's why the site is showing the BTC candlestick chart.
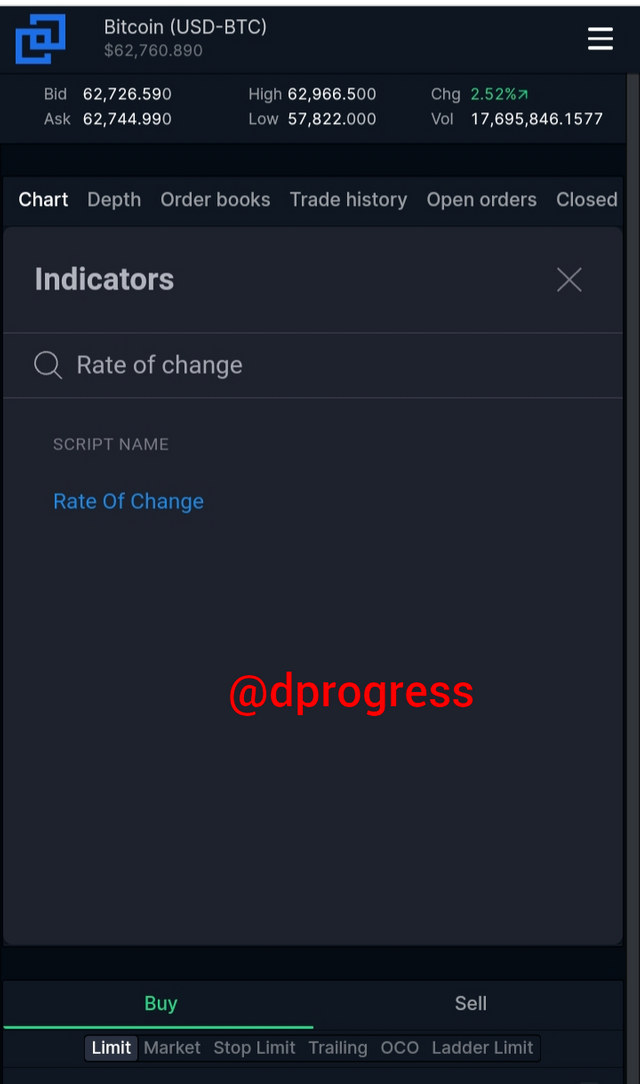
Step 3: The lower part of the open book bar has indicators written on it. Click on the indicator.
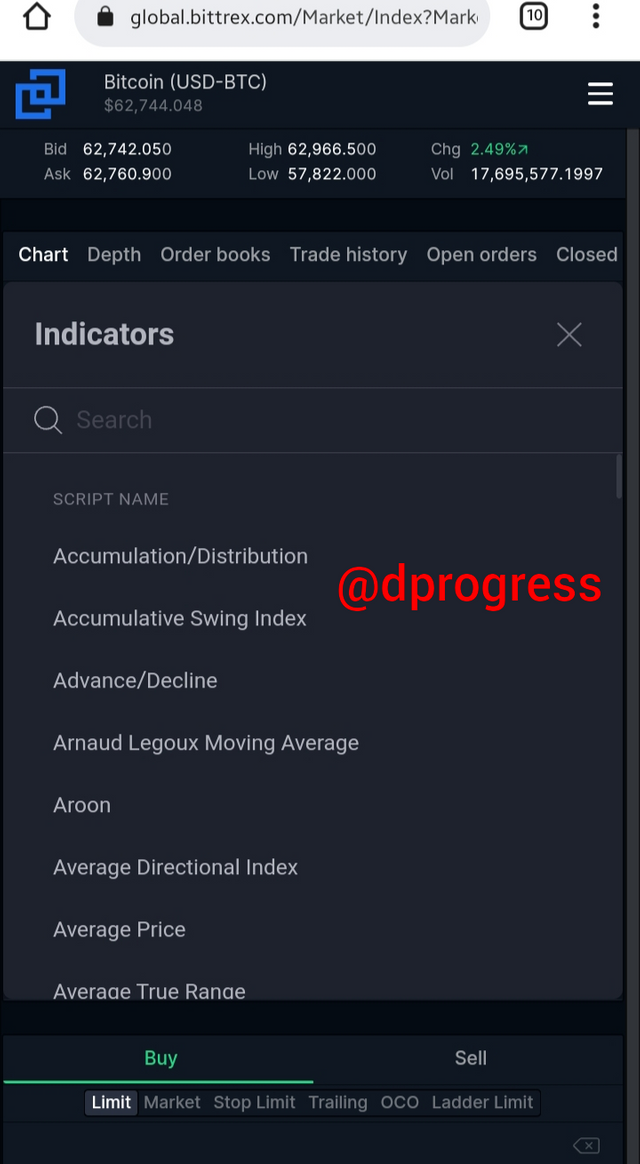
Step 4: Search for the rate of change and click on it. The indicator will be displayed in your chart immediately after you click on it.
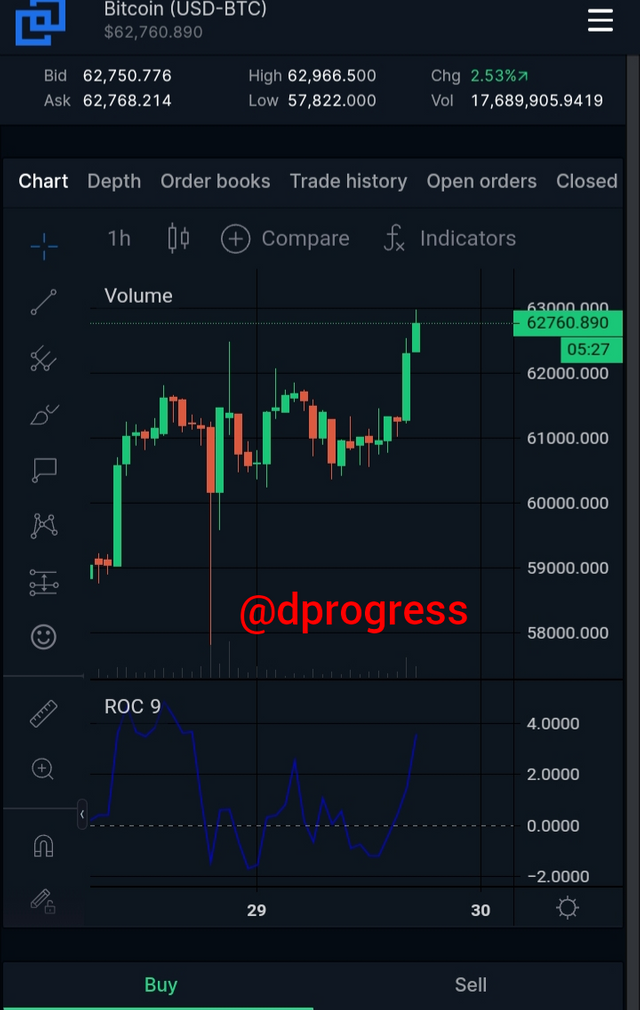
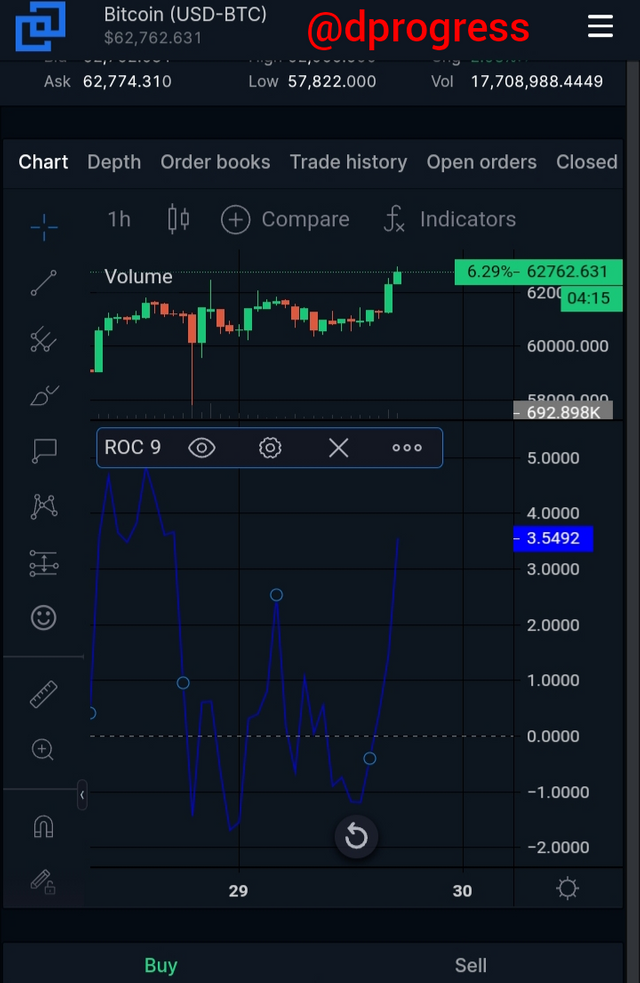
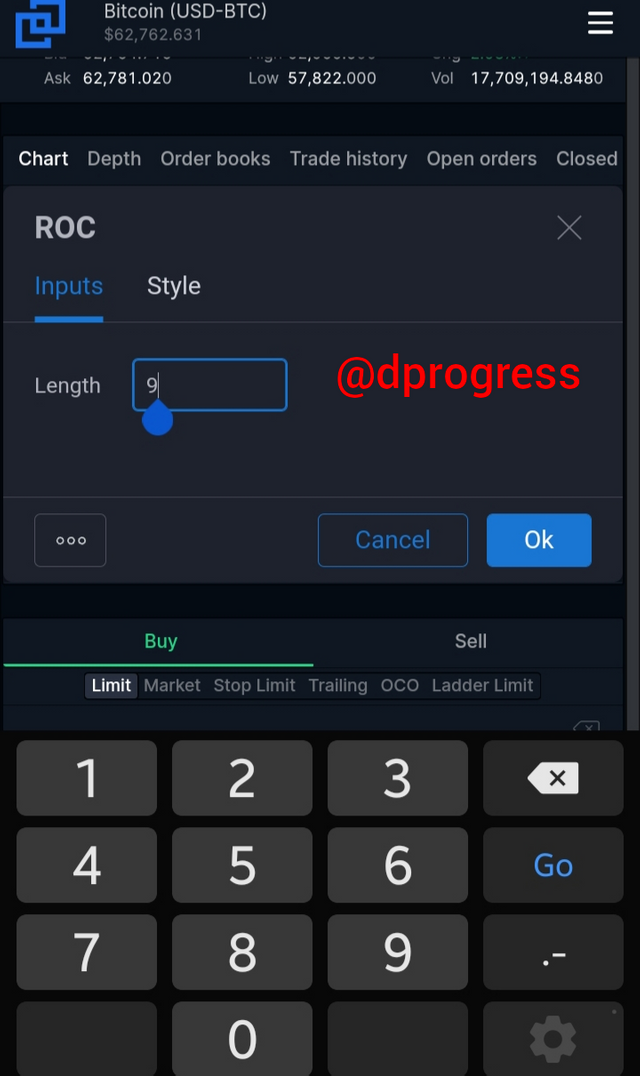
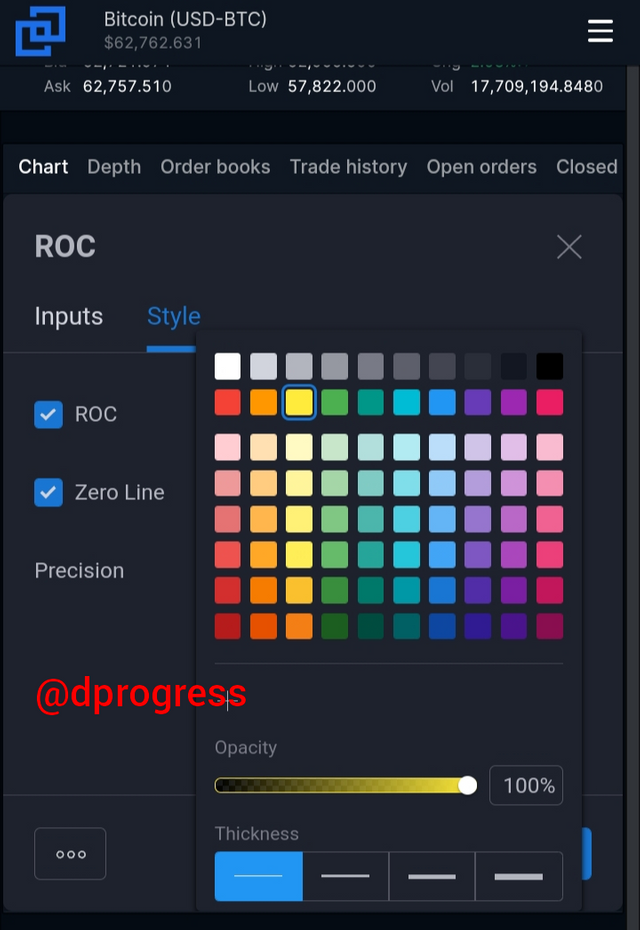
Step 5: The indicator is on 9 number of periods. That's why you have ROC9 written there. If you want to change it, click on the ROC9 and you'll see a small extension with a settings image. Click on the setting image and you'll be able to change the number or N.
Step 6: I'm changing mine to 12 and I'm also changing the color of my crossover line to yellow.
Question 3: What is the ROC trend confirmation strategy? And what are the signals that detect a trend reversal? (Screenshot required).
If you've been paying attention, I noted that ROC is plotted on line zero before. This line is so significant that it is referred to as a "crossover line" because it is used to confirm all trends.
To distinguish it from other similar momentum oscillators like RSI or Adx, the ROC chart is always in a separate portion of the cryptocurrency chart, usually below the price chart. The ROC is displayed on a crossover line to distinguish between positive values that are increasing and negative values that are falling.
Positive values above the crossing line show upward buying momentum, i.e., more people are buying the asset, causing the price to rise, whereas negative values below the crossover line indicate downward selling momentum, i.e., more people are selling the asset, causing the price to fall. When the price continues to rise in a positive direction, the asset is clearly in an upward trend. We may calculate the asset's continuous percentage increase using ROC. The trend is shown to be negative or downtrend when the asset price is below the crossing line and continues to move away from the line. The price hovers around the crossing line when there is a substantial tug between the bulls and the bears.
The crossover line is clearly a signal for a trend reversal. When the price of an asset is above the crossover line and has been steadily increasing, but there is a fall in price and price continues to move towards the crossover line, this is a signal that a bearish is likely to occur. Although the market may make unnecessary noise at times, when it gets close to the crossover line, it means the market is likely to turn bearish for some time.
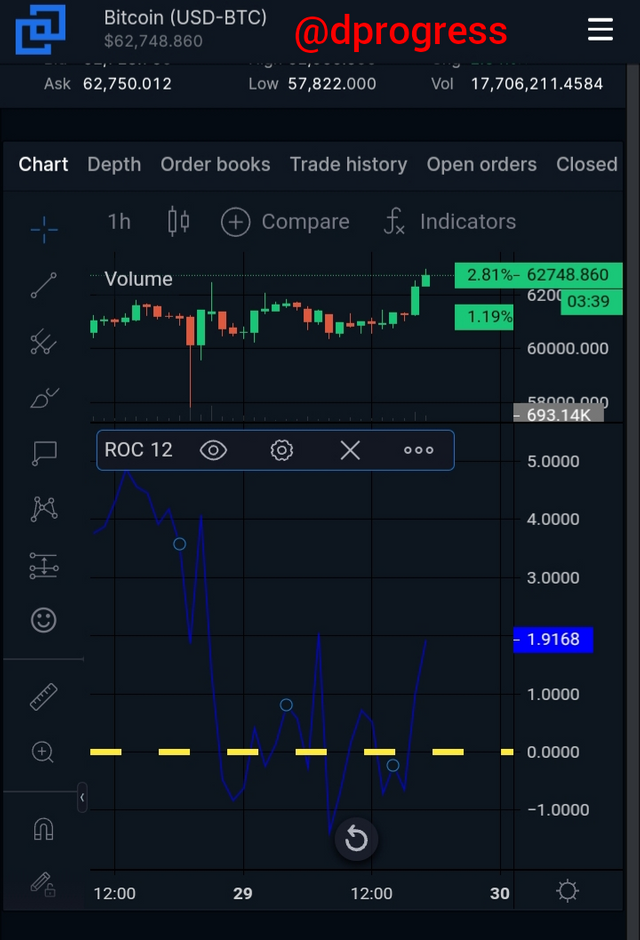
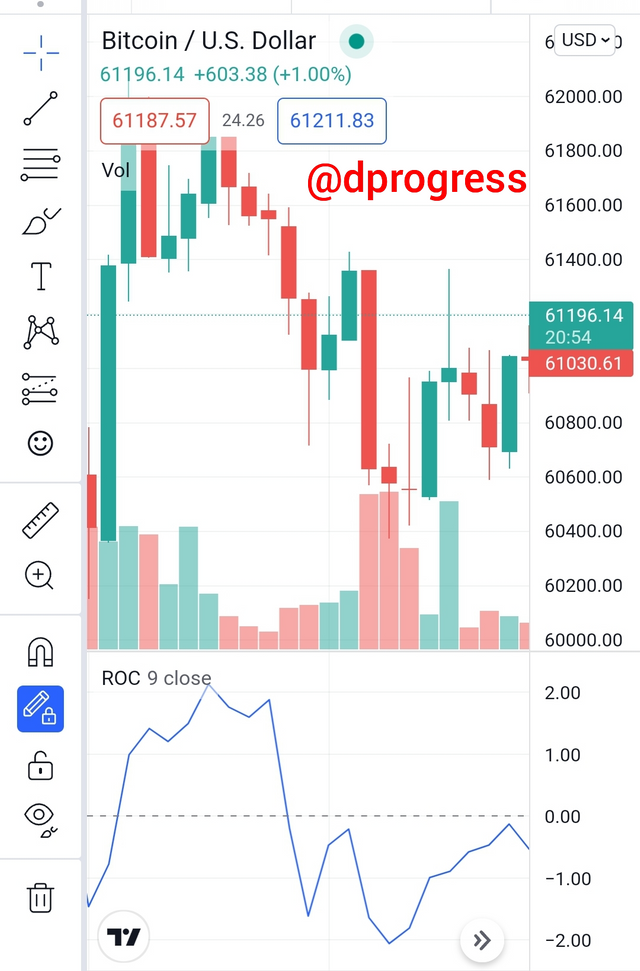
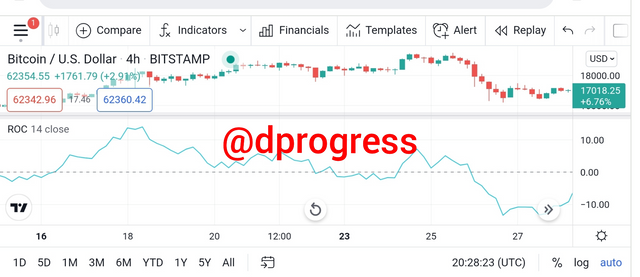
This is the ROC of BTCUSD; the market was in an uptrend, but when the price value rose above 1.0 of the ROC positive value, the price dipped somewhat, but the rise continued immediately until it reached 2.0 of the ROC, at which point the line began to gently decline towards the crossover line. There was a price turnaround, but the price is now in a consolidation phase, hanging around the zero line.
Question 4: What is the indicator’s role in determining buy and sell decicions and identifying signals of overbought and oversold؟(screenshot required).
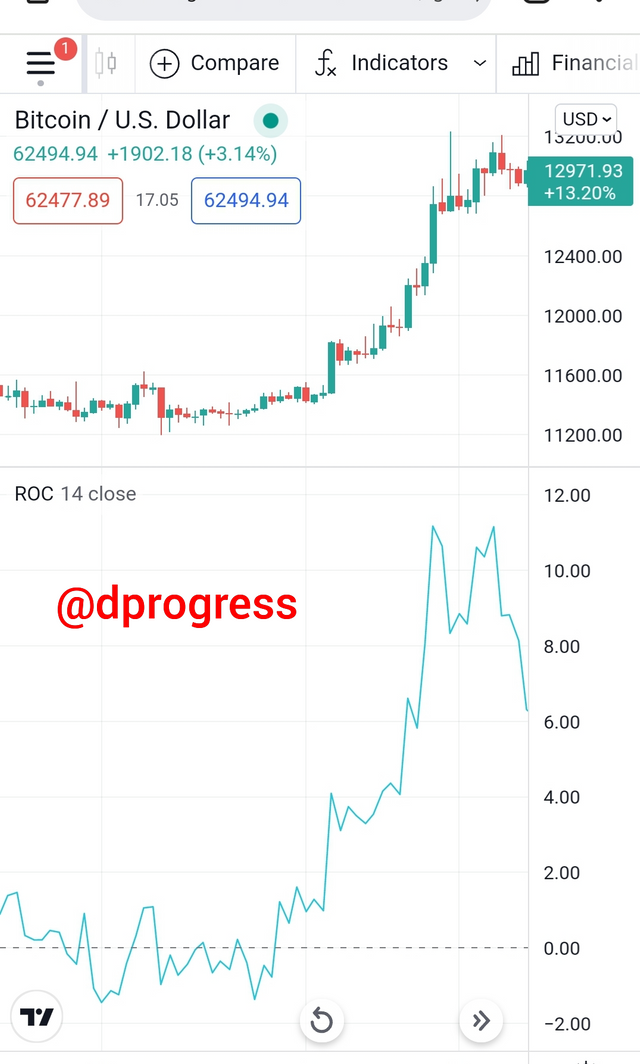
When deciding whether to buy or sell, the rate of change is significant. Every trader wants to profit, so they buy an asset when it is cheap and sell when it is expensive. One of the technical instruments for determining the entry and exit points is the rate of change. To better illustrate, I'll use the image below.
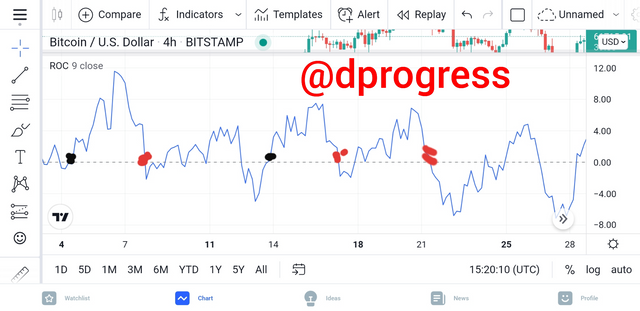
The black dots indicate a buy signal, while the red dots indicate a sell signal.
You buy the asset when it crosses or comes near to crossing the crossover line, allowing you to profit from the bullish trend. The market saw a strong increase in the first black dot, and you may sell the asset whenever you want because the price is still above the zero line. It is necessary to sell at the red dot or you will lose money.
The rate of change oscillator is often used by traders to determine overbought and oversold positions. When the rate of change drops below a level, into the oversold area, and then crosses back above that level, it is a buy signal. When the rate of change climbs beyond a threshold, into the overbought area, and subsequently crosses below that level, it is a sell signal.
Question 5: How to trade with divergence between the ROC and the price line? Does this trading strategy produce false signals?(screenshot required).
ROC divergence occurs when the price action differs from the ROC oscillator's price actions as a result of movement not being represented in the price. Divergence is usually an indicator of a price reversal.
The market is in a bullish divergence when the ROC is signaling a higher low and the price is indicating a lower bottom. When the market is in a downtrend, the bears are in charge, therefore when they start to lose control and the ROC starts to rise and establish higher highs, it implies the market is going to turn bullish. It is called bullish divergence.
We also say the market is in a bearish divergence when the ROC indicator is showing lower highs and the price is forming higher highs. When the market is in an uptrend, the bulls are in charge, but when they lose control and the roc starts falling and hitting higher lows, the market becomes bearish since the positive trend lacks impetus.
Yes, ROC indicators can generate erroneous signals, causing a trader to make poor trading choices. Because small N values are more vulnerable to market noise, this is the most prevalent case. When making trading decisions, it's best not to rely exclusively on this indicator; instead, integrate price action with the indicator to confirm patterns.
Question 6: How to Identify and Confirm Breakouts using ROC indicator?(screenshot required).
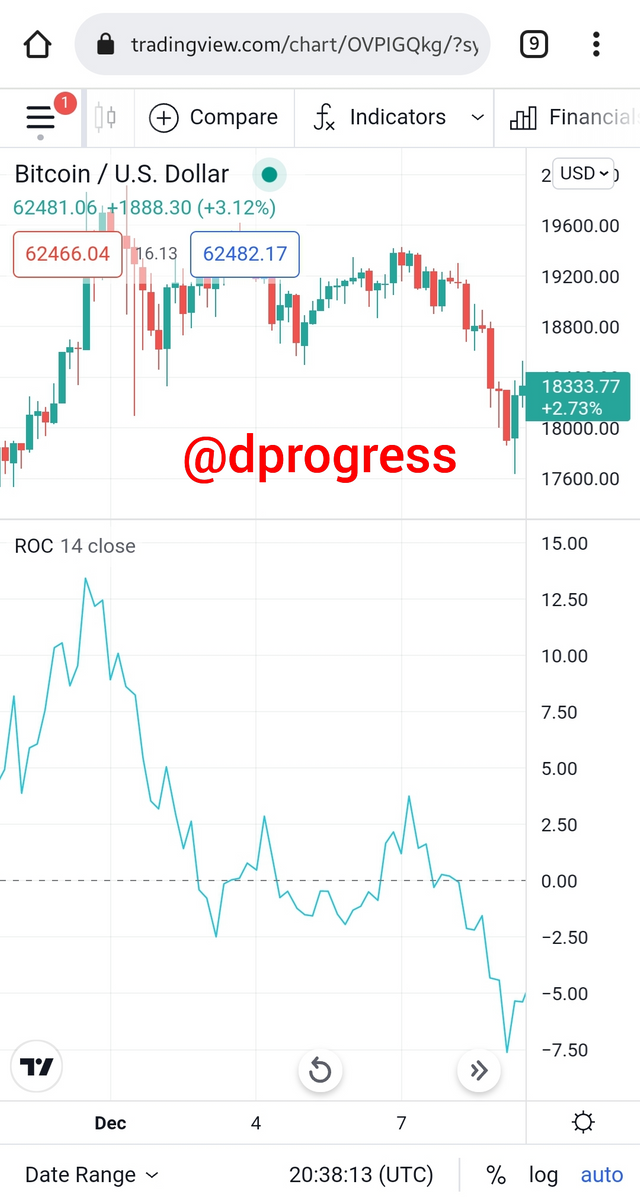
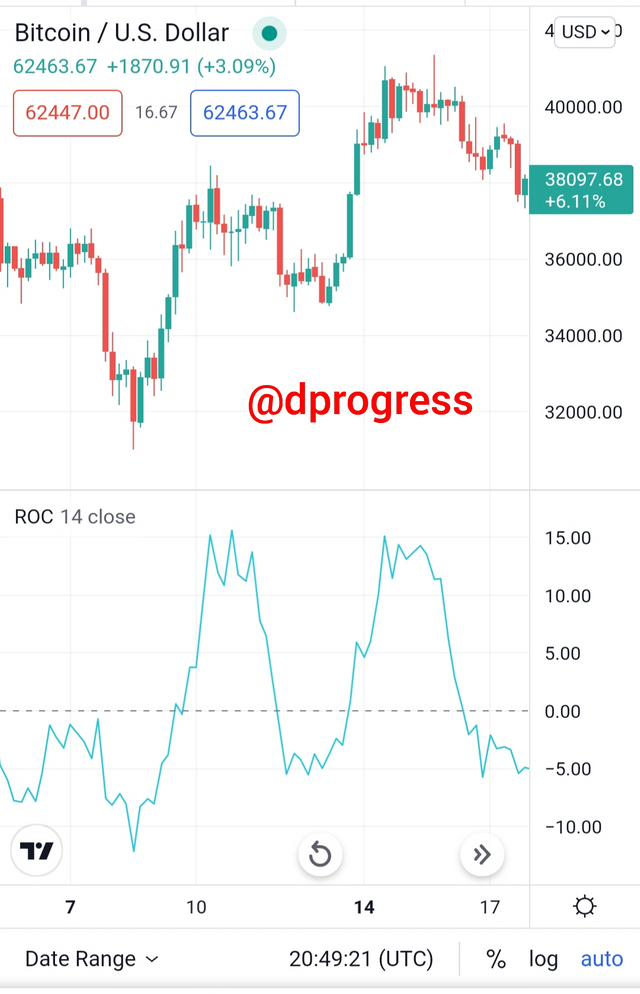
Breakouts can be identified using rate change. As I previously stated, when the price of an asset hovers around the crossing line, it indicates that the asset price is in a state of consolidation, with no bullish or bearish trend. However, a breakout occurs when the price breaks away from the consolidation to the positive or negative sides and continues to move further away. I'll be using the image below to explain further
You can see as the price was hovering around the crossover line before it finally broke out to be a downtrend.
Question 7: Review the chart of any crypto pair and present the various signals giving by ROC trading strategy. (Screenshot required).
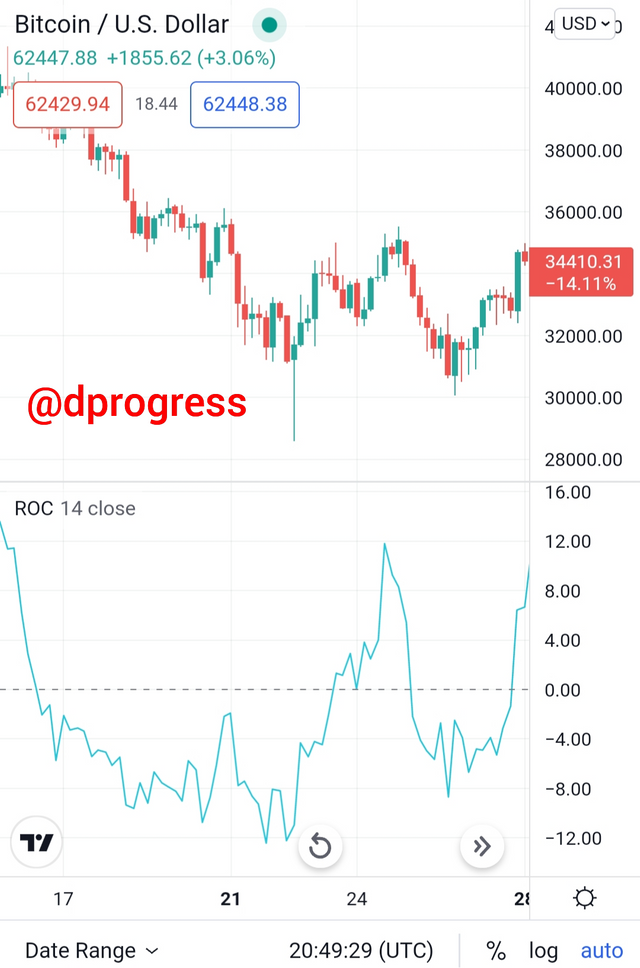
The cryptocurrency pair I'm looking at is ETH/USDT. For ROC, my N is 12.
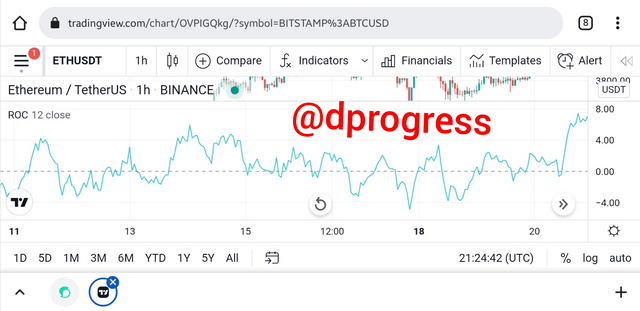
We watched how the price crossed from below the crossover line to the positive value of the chart at the start of the chart. Simply said, the chart began with an upward trend.
Along the line, the price began to decrease from a positive to a negative value, with bearish divergence traces.
Following that, the asset entered a consolidation period, as seen by the price staying around the crossover line, but after view time, the price broke out, going higher above the zero line and towards the positive value. Eventually, There is an oversold condition as well as divergence.
Conclusion
We've discussed the relevance of rate of change in technical analysis. The zero line is the most important component, and it can be used to indicate trend changes. Depending on the N value used, the signal may arrive too early in a small change if you use a small N value, and you may see the signal too late if you use a high N value. As a result, it is advisable to combine ROC with other indicators to achieve the best results.
Hello @dprogress,
Thank you for participating in the 8th Week Crypto Course in its 4th season and for your efforts to complete the suggested tasks, you deserve a Total|5/10 rating, according to the following scale:
My review :
An Average post in which your answers lack depth of analysis and variety in the examples used.
A brief definition of the ROC indicator followed by a calculation of its value, without providing an explanation of the result obtained.
You did not answer the second part of question 2 regarding the best parameters chosen for the indicator period.
Regarding trend reversal is not well explained.
A superficial answer to the fourth question, you did not deepen your analyzes. The same is true for identifying divergence and breakout.
Thanks again for your effort, and we look forward to reading your next work.
Sincerely,@kouba01
#club5050 😀