Crypto Academy Week 12 || Homework task for professor @Kouba01 on Cryptocurrency Trading with RSI
Hello friends, its indeed my pleasure participating in the lesson and completing the homework task by @kouba01 on the cryptocurrency trading with RSi,read down to see my answers;
What is the Relative Strength Index - RSI and How is it Calculated?
RSI which is relative strenght index is an indicator but a momentum indicator and indicators are tools that helps us forecast future price action,they also help us know which direction the trade would move towards to so as to correctly place our trade order,so the relative strength index( RSI) is actually a momentum indicator that can be said to be useful in the analysis of a financial market e.g forex trading or crypto world thereby helping to determine when a market or trade is going long(bullish) or short (bearish) so as to help or enable the trader make profit;
There are other indicators like the ichimoku,moving average, stochastic etc but today we are looking on relative strenght index(RSI),
 screenshot of my meta4 app
RSI equation ;
RSI = 100 – 100 / ( 1 + RS )
Where,
RS = Average loss /Average gain
Can we trust the RSI on cryptocurrency trading and why?
For me,i use different indicators which I will show us on a screenshot of my mt4 demo trading app, I do that so as to compare for a confidential information because i can't rely on one or the RSI so as an analyst i don't think it can be trusted because most times the result lags behind or gives a false signal
from here we can see i use moving average,RSI and stochastic for proper confirmation
How do you configure the RSI indicator on the chart and what does the length parameter mean? Why is it equal to 14 by default? Can we change it? (Screen capture required)
How to configure the RSI indicator:
Before configuration, an app must be downloaded from playstore and set up as i did, i am using metatrader 4 as demo and metatrader 5 as real account but i will be doing these task with my mt4 demo account app;
open the Metatrader 4 app depending on the app you use ,
open the chart and click on the f icon at the top of the page,it directs you to a page you get main chart , indicator window 1 and 2
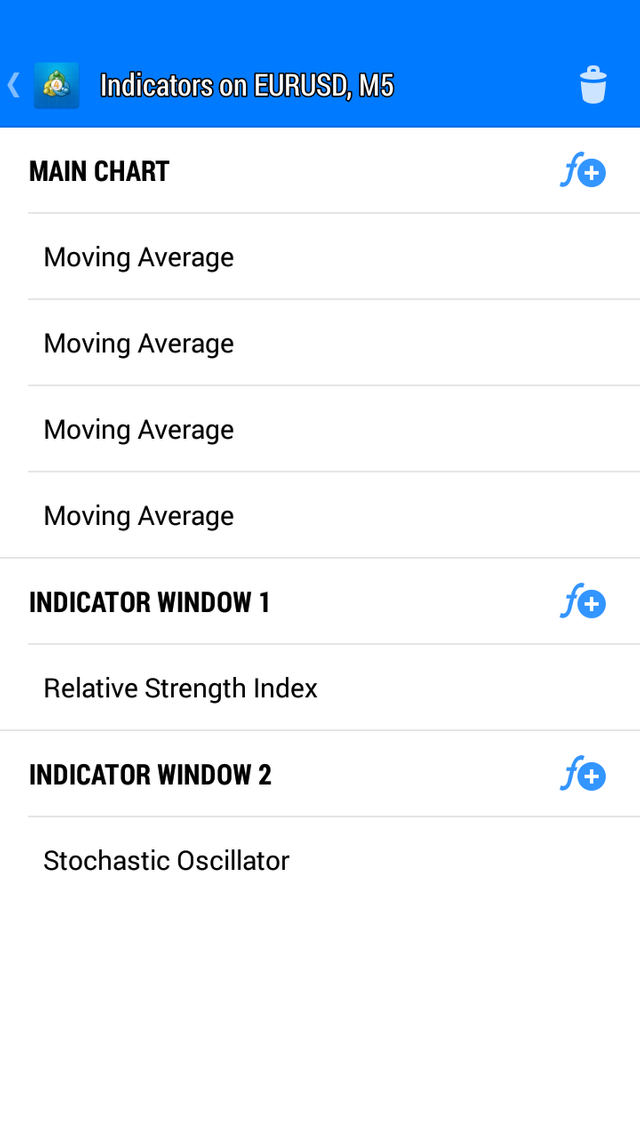
- click on the f plus icon beside the indicator 1
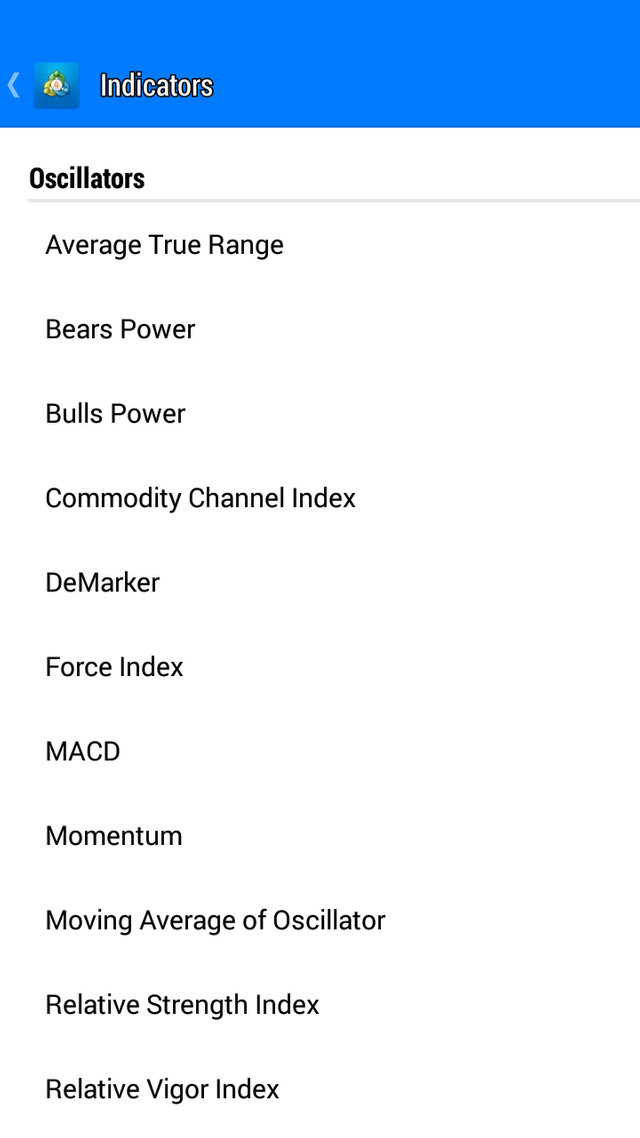
- select the required indicator which is the RSI
- move back and click on the relative strenght index to select or change parameters if need be
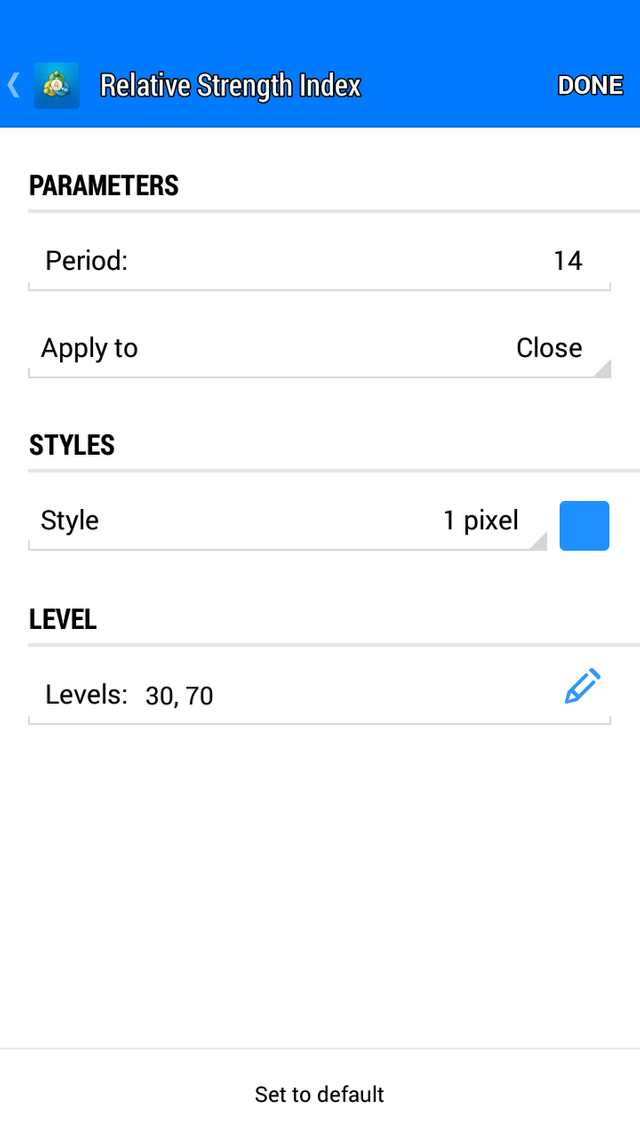
meaning of the lenght parameter and why it is equal to 14 by default
Length parameter is the number of bars that is considered by the RSI indicator in other to analyze the market price to give an average value of overbought or oversold over a particular period of time as required by the analyst and the lenght parameter is considered the most sensitive as it determines the volatility and stability of the RSI,
It is 14 by default because the RSI indicator analyses the price movement of an asset over the last 14days on a 1day time-frame chart, the last 14mins on a 1min time-frame chart, the last 14weeks on a 1week time-frame chart as the case maybe,
Yes it can be changed depending on the trader's trading style , for swing or medium style traders like me i prefer the default parameter on a 5minutes daily chart as it lowers the stability and volatility of the chart , from the above diagram i indicated how a parameter can be changed after choosing the indicator which is relative strenght index,
How do you interpret the overbought and oversold signals when trading cryptocurrencies? (Screen capture required)
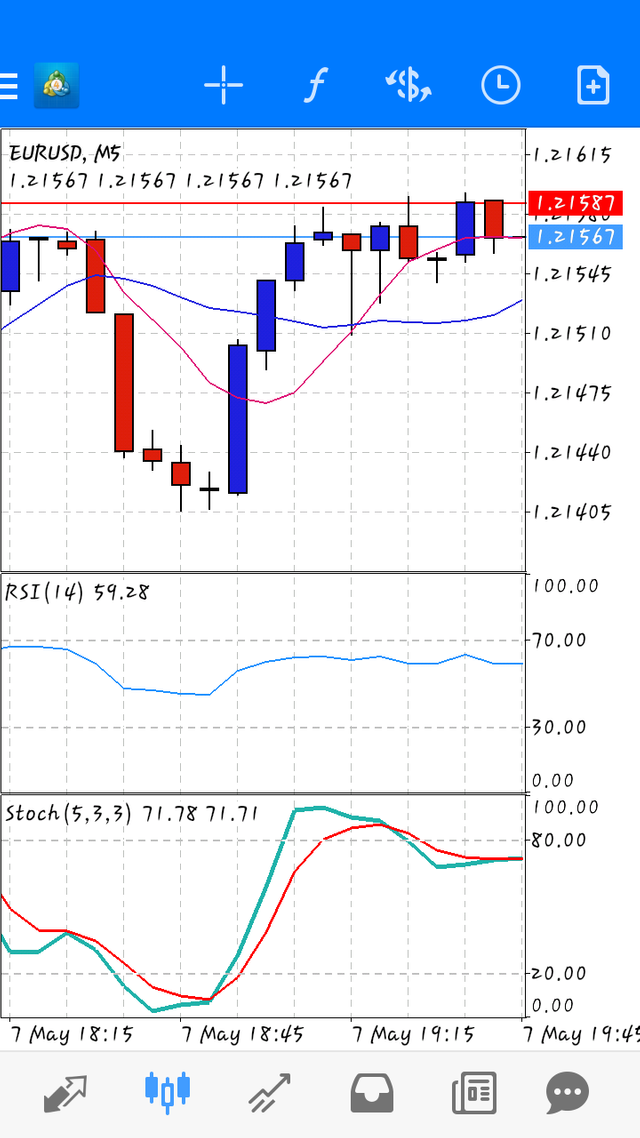
Overbought is experienced in a bullish market whereby the price of an asset is high and can be reversed while oversold is experienced in a bearish market or when there is a downtrend in the price of an asset over a period of time , overbought can be indicated in the chart when the RSI is above 70(buy) and oversold when the RSI is below 30(sell). This can be shown in the chart below.
from the RSI indicator above the graph is at 63 or so ,and it is not advisable to place a trade because the chart reading is indefinite as it can rise or fall back
How do we filter RSI signals to distinguish and recognize true signals from false signals. (Screen capture required)
Our main focus when trading is the price so its advisable to trade or get price information by the help of two indicators so filtration of the RSI can be done by the combination of two indicators for a more reliabe signal or result,from my chart above i used stochastic and RSI which we can see that both have a slight result,
Sometimes indicators can give false signals due to market conditions and as a good analyst you have to detect the signals,
Review the chart of any pair (eg TRX / USD) and present the various signals from the RSI. (Screen capture required)
I will be making a review from my mt4 forex app and the chart below will help in the review task
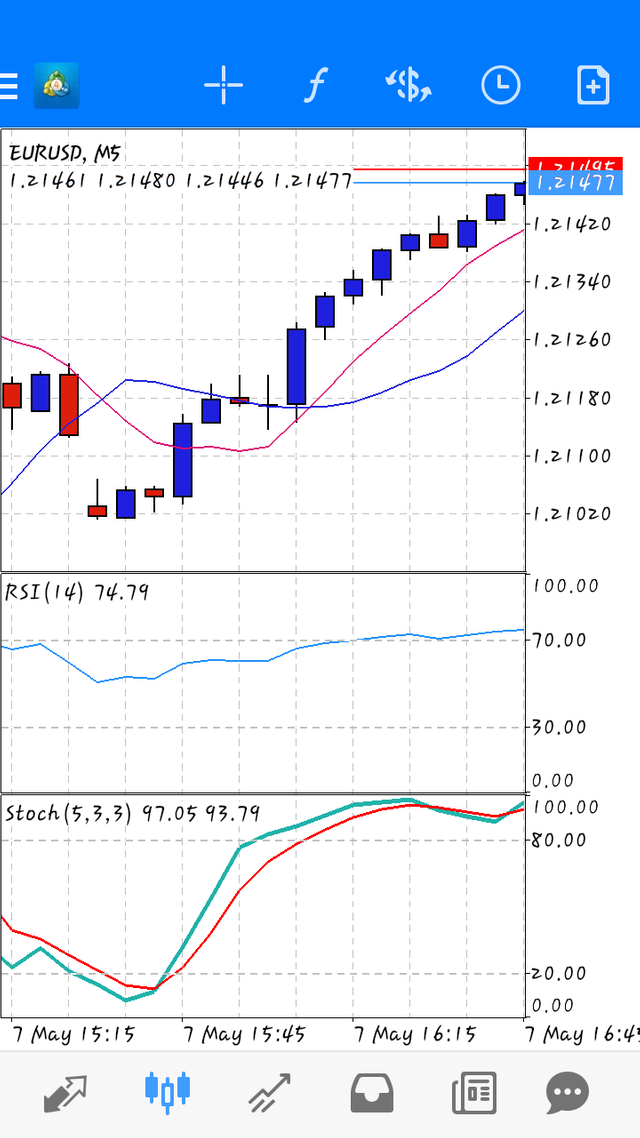
From the chart above, we can see my different signals which are the RSI and stochastic and we can see that the two signals varies slightly thereby encouraging a bullish trade,the RSI is getting to the overbrought region, here it is adviced to wait so that the other can give a clear confirmation depending on the RSI
Conclusion RSI is a good and sensitive indicator that helps a trader make a nice decision on trading though it can give a false signal depending on the market condition and the trader's trading style ,
It is advisable to use multiple indicators for a sure and reliable information.
Thanks to @kuoba01 for the wonderful class ,its indeed knowledge imparting
written by @dlioness
for @SteemitCryptoAcademy community
Hello @dlioness,
Thank you for participating in the 4th Week Crypto Course in its second season and for your efforts to complete the suggested tasks, you deserve a 6/10 rating, according to the following scale:
My review :
Generally acceptable work, your answers were short and lacked an analytical dimension. Try to delve deeper into the points raised with more research and criticism.
Thanks again for your effort, and we look forward to reading your next work.
Sincerely,@kouba01
@kouba01 Thanks for going through my blog and for your review ,its indeed my pleasure and i hope to gain a wider knowledge on the crypto space so as to participate in the next contest.
❤❤❤
Faith