[ Highly Profitable Trading Strategy with VuManChu Cipher B ]-Steemit Crypto Academy | S5W6 | Homework Post for @reddileep
.png)
1- Define VuManChu Cipher B Indicator in your own words.
2- How to customize the VuManChu Cipher B Indicator according to our requirements? (Screenshots required)
3- Explain the appearance of the VuManChu Cipher B Indicator through screenshots. (You should Highlight each important part of this indicator by explaining their purpose)
4- Demonstrate your preparation for the Trading Strategy combining other indicators. (Instead of showing the addition of indicators to the chart, you should explain the purpose of each indicator for this trading strategy.)
5- Graphically explain how to use VuManChu Cipher B Indicator for Successful Trading. (Screenshots required)
6- Using the knowledge gained from previous lessons, do a better Technical Analysis combining this trading Strategy and make a real buy or sell order in a verified exchange. (You should demonstrate all the relevant details including entry point, exit point, resistance lines, support lines or any other trading pattern)

1- Define VuManChu Cipher B Indicator in your own words.
The VuManchu Cipher B is an indicator that has many indicators included in its configuration, where traders seek to obtain bullish and bearish signals through what can identify us, since in VuManChu Cipher B we find the RSI indicator, also the flow of the money, the impulses that the market can have and all these indications can give us a very important reading to obtain purchase or sale in the crypto market.
We will be able to notice that this indicator is very colorful because having so many indicators together we can find a lot of information within the same indicator, but in this class, we are going to focus a little more on the Wave Trend, which are impulse waves and that Many traders often use it simply as a primary indicator to get their trading signals.
The waves of the Wave Trend indicator will be identified in blue color, we will see that one wave will have a light blue color and the other wave will be a darker blue color. Here is the interesting thing because these waves tend to intersect and when that happens it will be showing us certain points, which will be the red point and the green point that leaves us with a lot of commercial information.
We are simply going to identify these points or clouds as the money flow index, which is very important because in this way we are also going to detect if the buy signal is strong or the sell signal is strong. All this because when we find a redpoint it will be because the money or liquidity is leaving an asset and when we find a green point it will be because the money is entering an asset. We know that the more liquidity comes out of an asset, the weaker it tends to be, and sales increase. It also happens the other way around since the more money enters an asset, it becomes stronger and purchases increase.
2- How to customize the VuManChu Cipher B Indicator according to our requirements? (Screenshots required)
The first thing we are going to do is go to the Tradingview platform where we can perform technical analysis and place our indicators.
Once we are in the tradingview platform we must click on Charts where it will send us to a cryptographic pair and then look for the indicator.
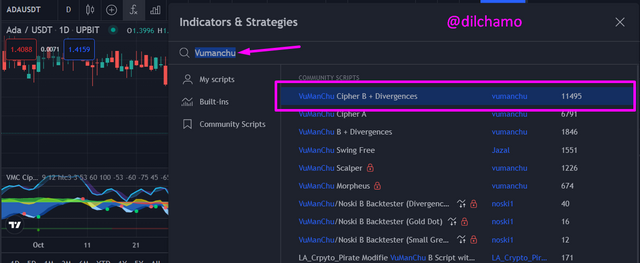
Then You can see how ADA/USDT chart is presented with the indicator.
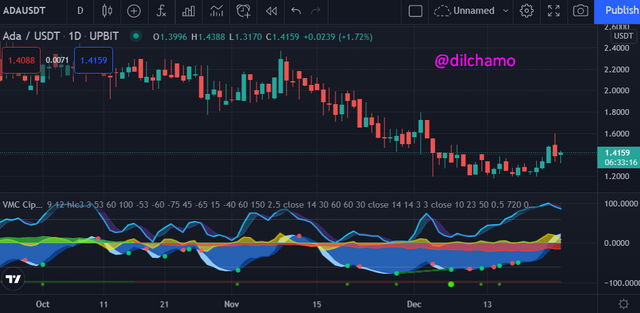
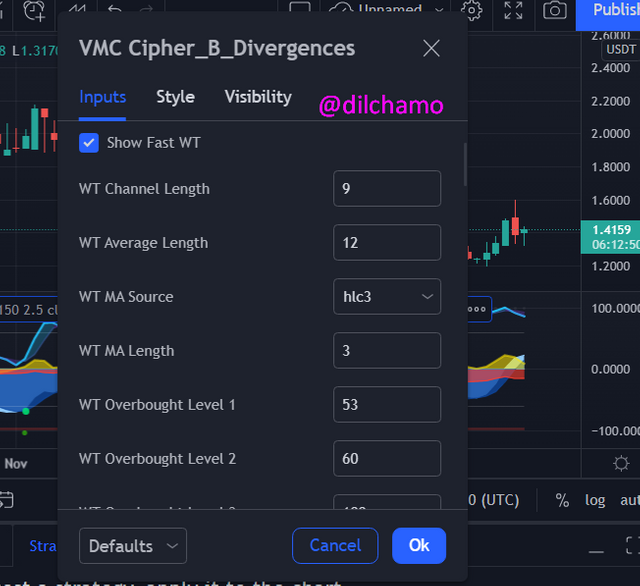
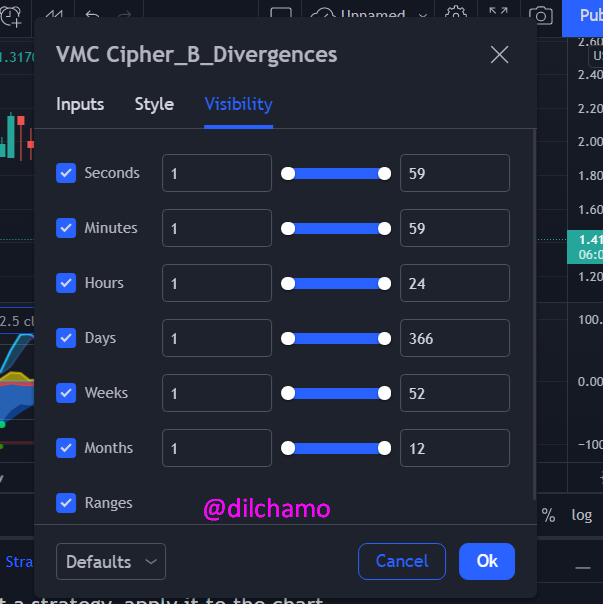
We also can change the settings of the indicator by clicking the settings icon in the indicator details.
3- Explain the appearance of the VuManChu Cipher B Indicator through screenshots. (You should Highlight each important part of this indicator by explaining their purpose)
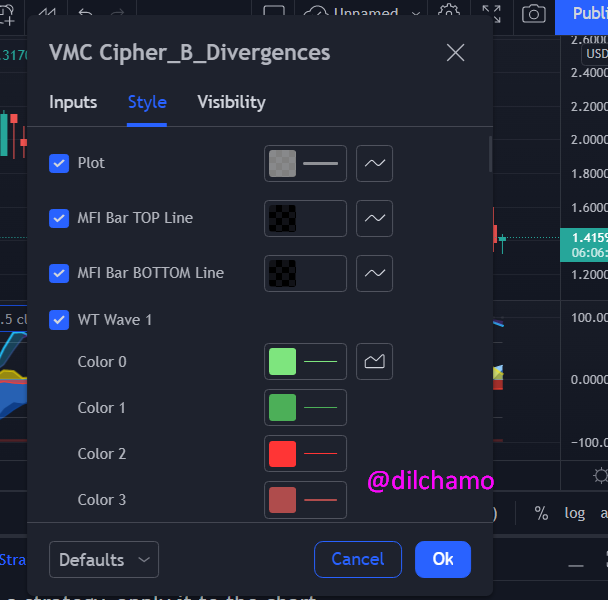
Previously I was talking about the VuManChu indicator, because what we will be able to notice the most in our configuration will be the VuManChu waves and we are going to identify that there are just two different wave trends, one of which has a light blue color. And another is the darker blue color that we are already going to see in the image that I will be providing of the indicator.
I was also talking previously about the red dots and green dots that we find in VuManChu waves. Well, precisely when these waves intersect, these two points tend to be identified, which I will be showing below in the image of the indicator.
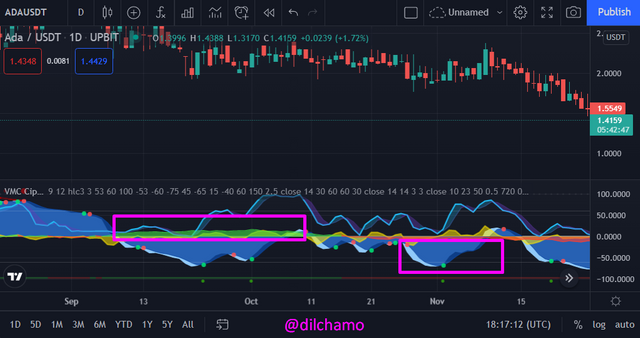
We are also going to notice in the indicator that there are clouds, which will be a green cloud and a red cloud. These clouds represent a lot of information since when we see the green cloud it indicates that money is flowing to the asset, that is, liquidity is entering which would be a good bullish signal. Then we have the red cloud that is indicating to us that money is flowing from the asset because here we note that the liquidity is leaving said asset that would be a bearish signal.
4- Demonstrate your preparation for the Trading Strategy combining other indicators. (Instead of showing the addition of indicators to the chart, you should explain the purpose of each indicator for this trading strategy.)
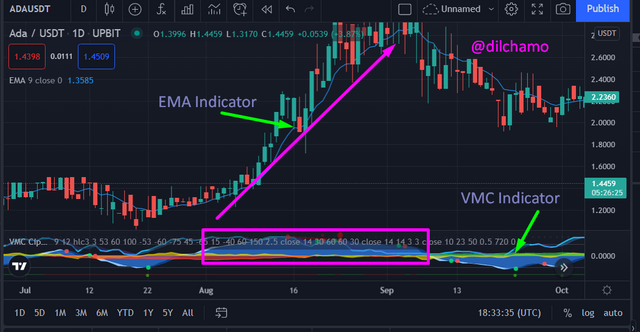
To prepare our commercial strategy, we will first seek to obtain greater confluences with the price, therefore we will place another indicator that will help us confirm signals and be able to have better buy or sell tickets. The indicator that we will be using will be the EMA, which are the exponential moving averages because I have always loved using this indicator.
The steps to place the EMA are similar to how we place the VuManChu Cipher B indicator, clicking on Fx where we look for our indicators and this time we will place EMA and click twice on the first option that appears since we will be using 2 exponential moving averages.
5- Graphically explain how to use VuManChu Cipher B Indicator for Successful Trading. (Screenshots required)
I have selected the ADA/USDT cryptocurrency pair to demonstrate the trade in this answer.
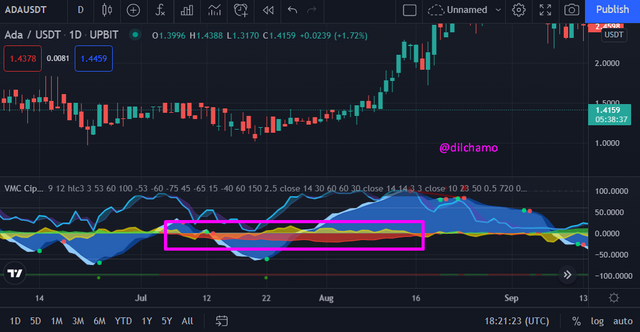
The entry criteria for this strategy with the VuManChu Cipher B indicator in a combination with RSI Indicator. I will demonstrate a sell short trade. This is just a demonstration. We have to wait for confirmation by the Wave Trend waves, where we will be able to identify that money is coming out of the asset when the clouds turn red, then we have to be able to visualize that there is the crossing of the waves forming a point of red color that would be our last confirmation to enter sales.
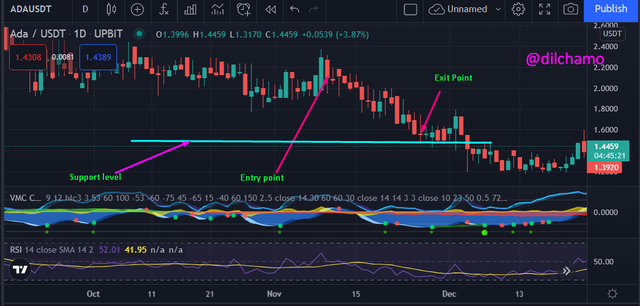
I have identified the trade entry position and I have planned to place the trade. Then I decide to exit the trade at an identified position. I have entered the trade at the place of 2.0 $ and exited the trade at 1.6 $.
6- Using the knowledge gained from previous lessons, do a better Technical Analysis combining this trading Strategy and make a real buy or sell order in a verified exchange. (You should demonstrate all the relevant details including entry point, exit point, resistance lines, support lines, or any other trading pattern)
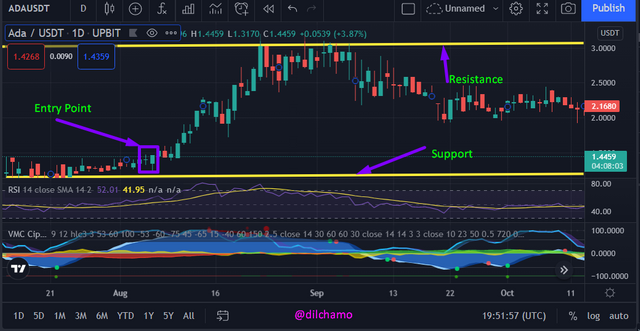
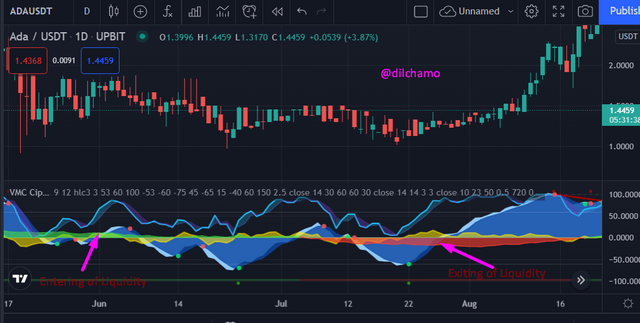
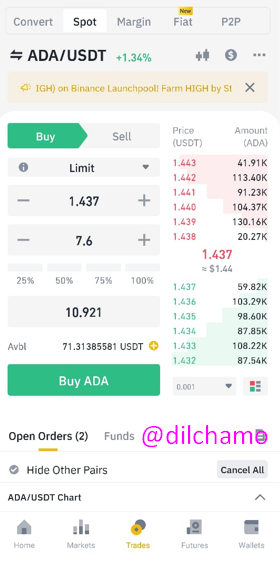
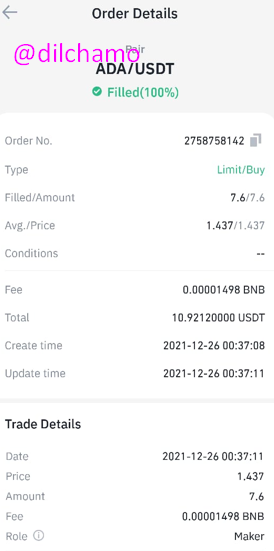
I have placed a buy long order in ADA/ USDT cryptocurrency pair. As you can see I have identified the trade entry at 1.43 and also I have identified the trendline as support and resistance lines.
CONCLUSION
We have been able to learn about a very interesting indicator such as the VuManChu Cipher B, which contains many indicators in one, but our trading strategy was based on Wave Trend waves, exponential moving averages where we have to confirm the trend of the asset. , but we also confirm if the flow of money is entering or if otherwise, the flow of money was left in an asset, which all these signals leave us a confirmation about taking an entry in purchases or sales.

https://steemit.com/hive-172186/@mehrbanjan/73atiw-achivement1-introduce-my-self-by-mehrbanjan.
Verify plzzz.
Thank you for the decent guide https://9blz.com/rsi-indicator-explained/