[ Effective Trading Strategy using Line Charts ]-Steemit Crypto Academy | S6W1 | Homework Post for @dilchamo
Overview
In trading generally, charts plays a great role in helping a trader identify and visualize the action or the activity going on as a result of buying and selling pressures exerted by buyers and sellers into the financial market at a particular point in time. In simple words, charts are simply the representation of price change or price movement within a particular period of time.

1. Line Chart
Amongst the several type of charts that exists, Line Chart is one of the most easy to understand. Line chart is simply a chart that displays price movement in a way that is very easy to understand. Line charts makes view of price change much more clearer than other charts. It gives price change a simpler view as it usually displays only the closing prices of a security and also smoothens the price movement by filtering the noise available in the market. New traders and Professional traders find the line chart very useful because of its simplicity in representing price movement.
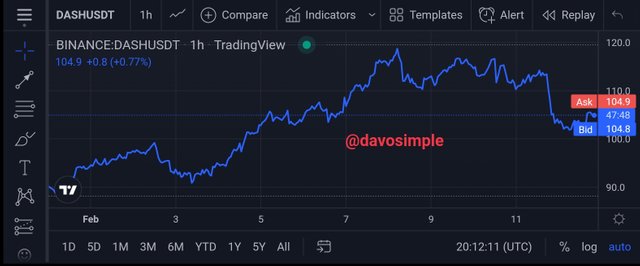
Also, during technical analysis, line charts displays strategic area of value which could give a trader an edge in seeing a bigger picture of the market.
Uses of Line Chart
Identification of key support and resistance level is one of the ideal usefulness of line chart.
It helps to easily identify key levels in the market. Key levels like the swing highs and the swing lows which helps in easy drawing of support and resistance level, and also ease of drawing of trend line.
For traders who love using chart patterns like triangle pattens, channel patterns and some other chart patterns, line charts make it more easier to be able to identify the above mentioned patterns.
Another important tip which pro traders use line chart for is to identify false breakout in the market and not get trapped by the false breakout.
All these usefulness of line charts are basically because it deals directly with closing price of an asset and because of that, traders are able to spot some key levels pretty much easier than they should with candle stick patterns.
2. Identification of Support and Resistance levels using Line Charts
Because line charts deals with the closing price, it makes it easier to draw support and resistance levels. This is because when price makes some swing highs and forms some higher highs and higher lows, or lower lows and lower highs, an horizontal line which could serve as support or resistance can be drawn to touch the previous swing highs and swing lows.
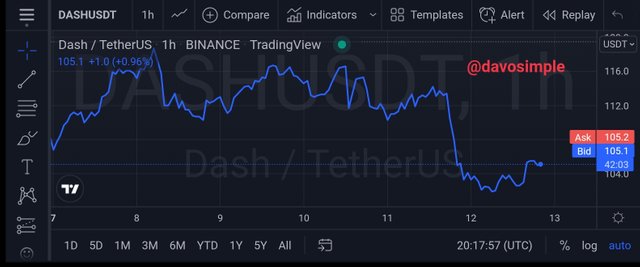
When buying pressure becomes very high and price breaks above the resistance level which serve as the key point of high supply, traders can utilize that breakout to make profit but it is important to have better confirmation before taking breakout trades.
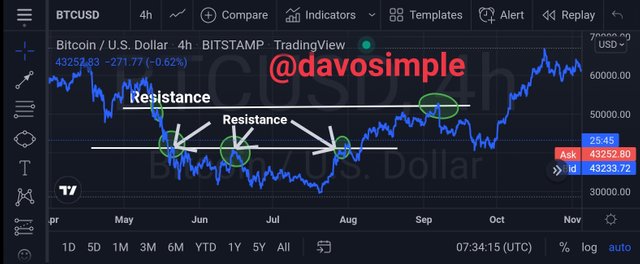
From the screenshotshot above, we can see how price made some swing highs and couldn't break above the point of supply. But as the buyers exerted more pressure, price broke above the resistance and the resistance turned to support.
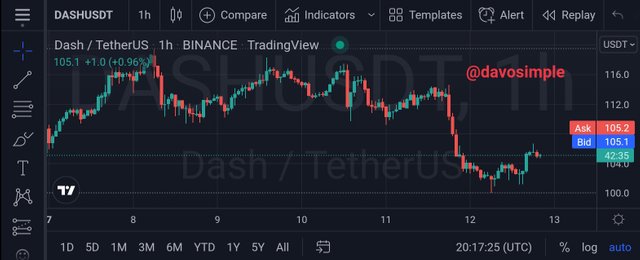
Support levels acts also as key levels of identifying strong area of demand. Traders can utilize the break below the support level to make some profit but should have some other tools for confirmation.
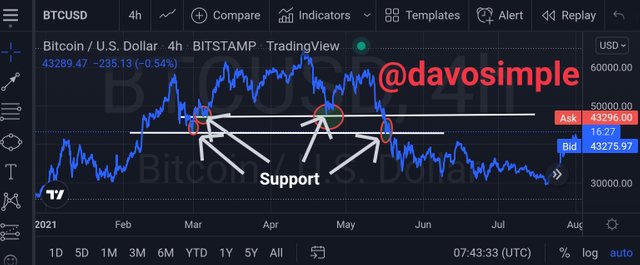
From the screenshotshot above, we can see how the line chart helped me to draw my support at key levels which breakouts below the support level could increase the probability of having a winning sell trade.
Line charts therefore helps in identifying key area of support and resistance by showing key points of value which breakouts above or below those key values could help a trader ride some trends.
3. Difference Between Line Charts and Candlestick Charts
Both the line chart and the candlestick charts are effective analysis tools but there are some key difference that exists between them.
The first difference that exist between them is that the line charts minimizes the noise in the market and makes the chart easy to understand when the market is in an Uptrend, Downtrend and when the market is in a range. Even a beginner trader can easily identify these trends using line charts. But when it has to do with Candlestick Charts, the charts appear in a manner that could get a beginner trader confused because of how the wicks and the candle bodies appears.
Another key difference between line chart and candlestick chart is that line chart focuses more on the closing price and because of that, there are less noise in the market, whereas candlestick chart focusses on the opening price, high and and the low of the market.
There are some patterns that candlestick chart give that can help a trader in predicting trend reversals but line charts do not have such patterns
4. Suitable Indicator That Could Be Used With Line Chart
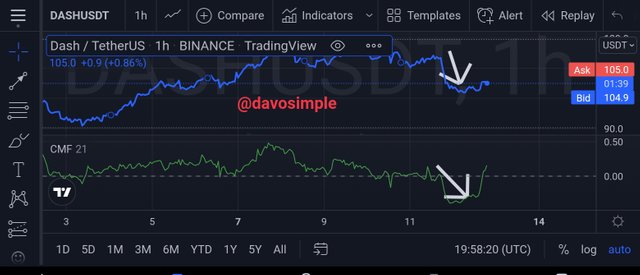
For this question, I would be adding an indicator I found very useful for technical analysis. It is the Chaikin Money Flow Indicator. The Indicator is very easy to understand and it works pretty with the line chart. The Chaikin Money Flow Indicator takes into consideration selling and buying pressures in the market. The indicator is calibrated on a scale of -1 to 1. Traders always look out for the crosses of the Indicator line above or below the zero mark.
When the Indicator line crosses above the 0 mark and approaches 1 it is a possibility than an Uptrend might happen. Also, when the Indicator line crosses below the 0 mark and approaches -1, it is an indication that a Downtrend might likely happen.
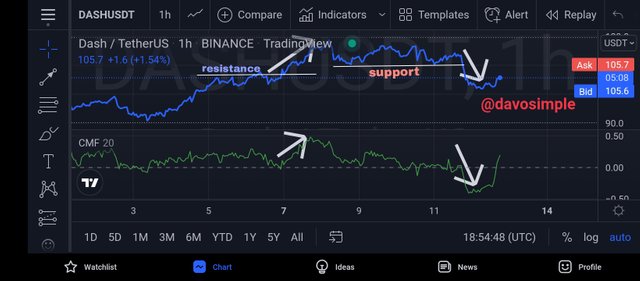
From the screenshot above, I have marked out two points where the Indicator line made some crossovers. First we can see that when the indicator line crossed above the 0 mark, the line chart also made a notable breakout above the resistance which led to a bullish trend. And other crossover I indicated is when the indicator line crossed below the 0 mark, the lines chart also made a notable breakout below support and resulted in a bearish trend.
This therefore means that Chaikin Money Flow Indicator can help traders to better time their enteries while using the line chart
5. Identifying bullish and bearish trend using line chart can be done using the Chaikin Money Flow Indicator.
Bullish Trend Identification Using Line Chart
Traders look out for when the Chaikin Money Flow Indicator line crosses 0 so they can get a confirmation that buying pressure is getting high in the market and get prepared for a bullish trend.
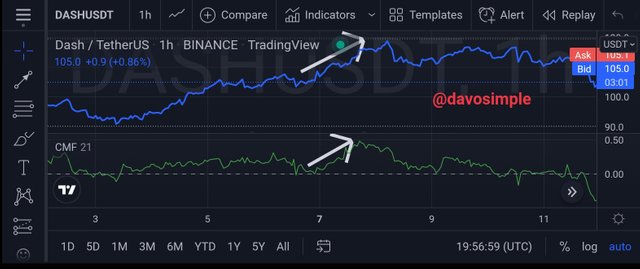
From the screenshot above, I identified the point where Chaikin Money Flow Indicator line crossed above 0. The line chart also made some swing highs resulting in an uptrend.
Bearish Trend Identification Using Line Chart
When the Indicator is seen crossing below 0, it means selling pressure has begin to increase in the market and traders could prepare for a downtrend.
From the screenshot above, I identified the point where the Indicator line crossed below 0. The line chart also made some swing lows and a downtrend occured.
6. Advantages And Disadvantages of Line Chart
Advantages of Line Chart
One of the best advantage of line chart is that it aids in the ease of understanding of market movement of an asset.
It helps traders to figure out strategic points where they can place resistance and support levels.
It helps to minimize some noise in the market since it focusses on the closing price of an asset.
Disadvantages of Line Chart
Depending only on line charts could make a trader miss some profitable trades.
It is not suitable for all traders, especially scalp traders because it doesn't give better results in short time frames.
Line charts doesn't reveal some important reversal patterns like the candlestick. With the candlestick chart, traders can predict possible trend reversal as a result of formation of candles like doji, hanging man, evening star and many other reversal patterns.
The manner in which price opens, the high and the lows are also important properties of a good technical analysis, but they are absent in the line chart.
Conclusion
Line chart is one of the easiest to understand chart. If allows traders make their trading decisions based on the closing price of an asset and also helps novice traders understand better how charts look like. The line chart, even with it's simplicity has some downturns which doesn't suit many trades. For example very short term traders also known as scalpers will find it difficult to make some good profits using line charts.
Since the line chart by default uses the closing price of an asset, it doesn't allow swing traders to see the opening, high and lows of price, and that isn't really good for making trading decisions.
But overall, line charts are good because it helps to spot out key points in the market.
Thanks for having me.
***All images and except otherwise mentioned are screenshoted from Tradingview
cc: @dilchamo
