[Crypto Trading With Linear Regression Indicator] - Crypto Academy / S5W5 - Homework Post for kouba01
Hello everyone, it is my outmost joy to participate in this week's academy lecture given by Prof @kouba. Below is my home post.
1. Discuss your understanding of the linear regression principle and its use as a business indicator and show how it is calculated.
The concept in understanding the principles of Linear Regression is by considering the relationship that exists between two distinct variables, which could be a dependent variable and an independent variable. This relationship is concerned with measuring the movements of these two variables in order to predict future expectations of these variables.
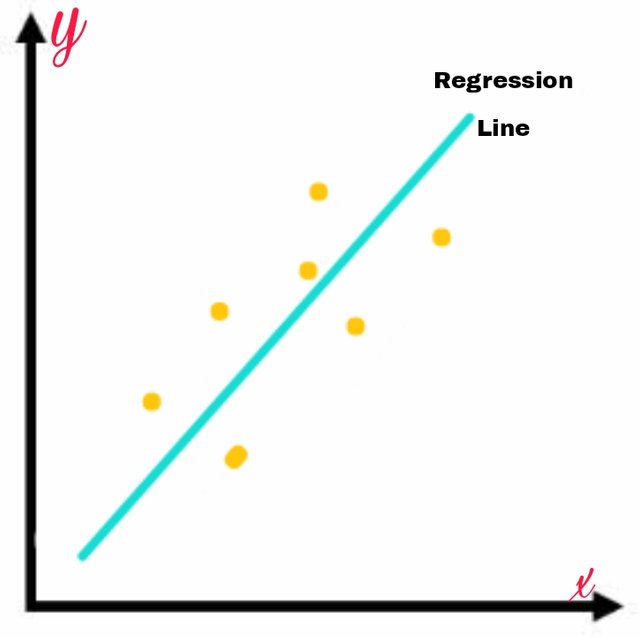
Considering two variables, say, x and y where x is the independent variable and y is the dependent variable. Now what we are considering is, as the independent variable is making a forward or backward movement, does the dependent variable also go upward or downward or does it also change its position?
Now this concept can simply be understood this way; If the independent variable moves simultaneously with the dependent variable, that is as x being the independent variable goes forward, y being the dependent variable also goes up, then we can say that the relationship that exists between them is a positive relationship. But if the independent variable increases while the independent variable decreases, then we can say that the relationship that exists between them is a negative relationship.
In trying to observe the relationship between these variables, we will try to minimize some errors by plotting a line that will fit in the points of our observation and call the line regression line. The aim of plotting this line is to be able to predict the future movement of the relationship that exists between these variables, if it will be a positive or a negative relationship.
Having explained the principle behind linear regression, I will further explain it's usefulness in business.
The linear regression indicator has found a great function in business in that it helps in the identification of trends and the preceding trend by using a pattern that is similar to moving averages. This linear regression indicator tries to plot the end points of the linear regression line so as to be more sensitive to changes in trend direction and because of that sensitivity, it exhibits lesser lag than the normal moving average and that has made the indicator to be of more advantage than the normal moving average.
The linear regression indicator as earlier mentioned that it is sensitive to changes in the market, it goes further to help a trader identify if the current trend is a downtrend or an uptrend and also help a trader to know the points of dynamic resistance and support.
How to Calculate Linear Regression Indicator
The main idea of understanding how the Indicator is calculated is to be able to minimize some errors using the sum of the least squares while predicting future price actions. The formula for calculating it is;
y = a + bx
Where
y represents the price
x represents the date
a represents the constant (the value when x equals zero)
b represents the slope of the line
In order to calculate the line of best fit, we use the formula below;
b = ( nΣxy - ΣxΣy ) / ( nΣx² - (Σx)² )
a = ( Σy - bΣx ) / n
Where
- n represents the number of periods selected
Above are the formula of calculating the linear regression Indicator. It looks complex theoretically but practically, it is more comprehendable.

2. Show how to add the indicator to the chart, how to configure the linear regression indicator, and is it advisable to change its default settings? (Screenshot required)
I will be showing how to add the indicator to the chart using the Tradingview site.
On the chart of preferred crypto pair, I hit the indicator button.
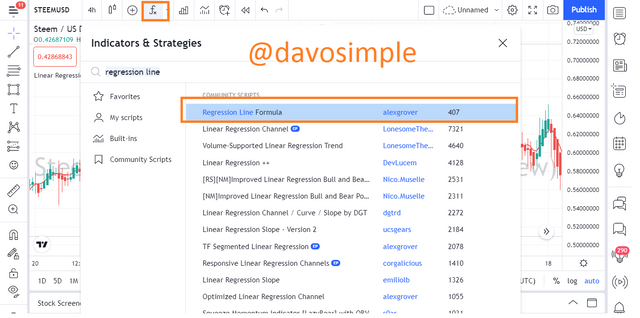
Then I search for Regression Line Formula and then it popped up and I clicked on it.
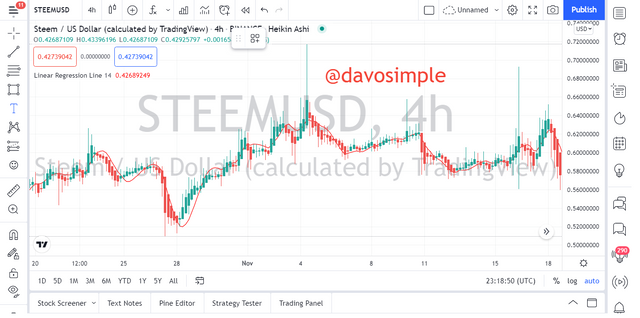
The indicator is successfully added
Now to configure the settings, I clicked on the Settings icon of the Indicator
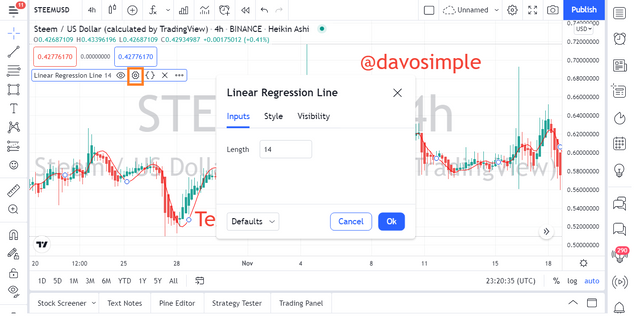
The Indicator by default is configured to a period of 14
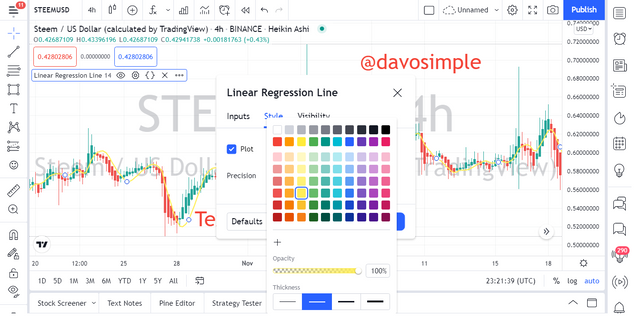
Next, we have the style which would allow me change the color of the Indicator on the chart. By default, it is red but I will change it to yellow so it have a different color from the red candles for clarity purpose.
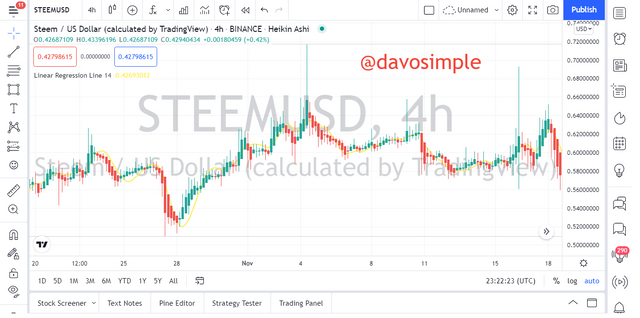
Here, I have successfully configured the Indicator temporarily.
A trader can change the default configuration of the Indicator in order to suit his trade, depending if he his a long-term trader, medium-term trader or a short-term trader.
Using a longer period or length will cover a longer period of days and as such, will smoothen and filter the efficacy of the Indicator to give a better result.
Professional traders like Coby and Meyers were of the opinion that using a period of 66 will really smoothen the Indicator on the chart and give better results while trading. Therefore, it is better to change the default settings of the Indicator which is 14 period to higher period of not lesser than 30 so that better results can be achieved.
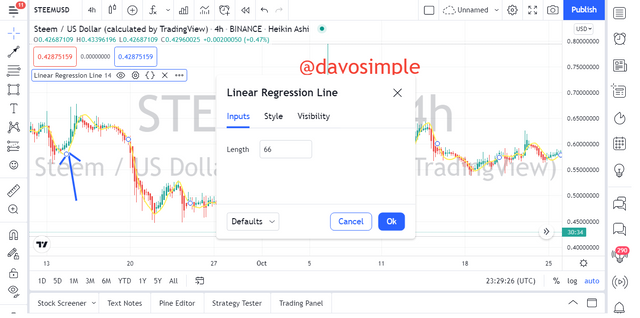
I will try changing the default settings of the Indicator to show how smooth it will look on the chart. I would prefer changing it to 66 as recommended by Coby and Meyers.
From the screenshot below, we can see how the indicator appears on both the period of 14 and the period of 66.
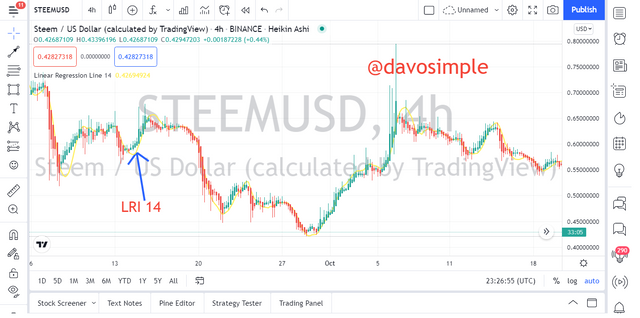
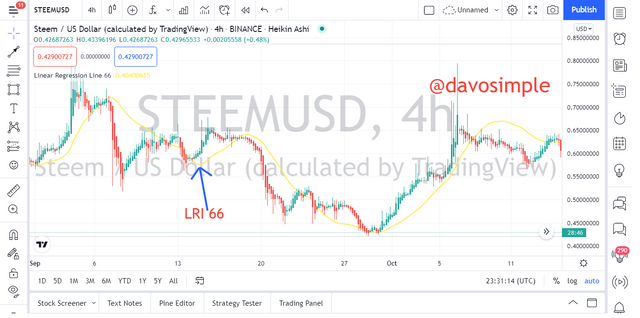
Therefore in conclusion to this, I am of the opinion that the indicator being set at a period of 14 will be tangling on the price action but a higher period will help a trader have a clearer view of the prediction offered by the Indicator for a better result.

3. How does this indicator allow us to highlight the direction of a trend and identify any signs of change in the trend itself? (Screenshot required)
One of the upside of the linear regression indicator is it's ability to help the trader identify trends. But the effectiveness of the Indicator is dependent on the period which the Indicator is configured. As mentioned in earlier question, the Indicator gives better results when used on a higher period.
If price action is seen above the Linear Regression Indicator, it therefore means that the market is in an uptrend and if price is seen below the Linear Regression Indicator, it means that the market is in a downtrend.
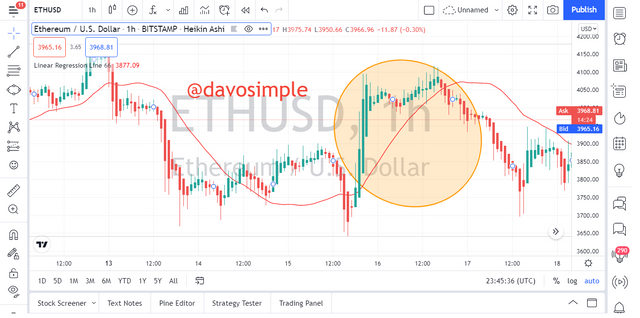
From the chart of ETHUSD above, I configured the Indicator to a period of 66. We can see price action above the line of the regression indicator, this simply means that the market is in an uptrend.
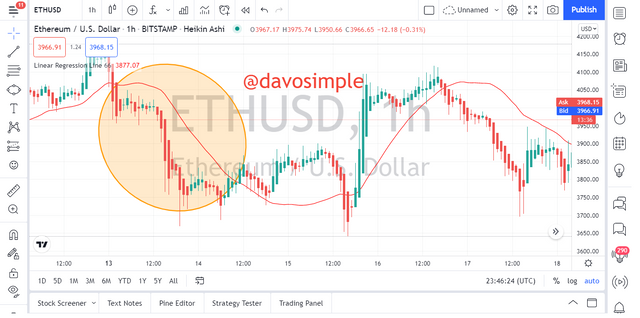
Here is another chart where we can see price action below the line of the 66 period regression indicator. This simply means that the market is in a downtrend.
Since the market is most times manipulated by the financial institutions, it is always better use this Indicator on a higher period and also a higher time frame for a more profitable opportunities and better results.
Identifying Signs of Change in Trend
Now, to identify when there will be a change in trend, we have to watch out for crossover of the regression indicator on the candles. Since the market is made up of buyers and sellers, buyers sometimes dominate the market while sellers at other times dominate the market. Therefore if the market was in an uptrend and we notice the regression Indicator begin to cross through the candlesticks, then a trader should get ready for a change in trend or trend reversal.

Looking at the screenshot above, we can see how the regression indicator line gave an early sign of trend change by crossing over the price action. This was an early signal to let a trader know that sellers are beginning to take over the market dominance and as such, a trader should prepare for a trend.

Here is another screenshot showing the cross over of the regression indicator line on the price action, giving a trader sign of trend change. As we can see, the market was in a downtrend and then the indicator line crosses over the price action, and after the cross over, the trend changed from downtrend to uptrend.

4. Based on using the price crossover strategy with the indicator, how can you predict whether the trend will be bullish or bearish (screenshot required)
To be able to predict the direction of a trend, I must be on the look out for some conditions to be met before making my prediction.
The first condition is to look out for when price action crosses and closes above the Linear Regression Indicator line, then we can say that the market will go bullish, and also the bullish trend will be a strong one. We can then open a buy trade.
The second condition is to look out for when price action crosses and closes below Linear Regression Indicator line, then it is an indication that the market will go bearish and we can then take to open a sell trade.
Lets have a better understanding of the aforementioned conditions on the chart below.

On the chart of STEEMUSDT above, we can see how the candle that crossed the Regression Indicator line closed above the Regression Indicator line, confirming a strong bullish signal.
We can also see how the candle that crossed below the Regression Indicator line closed below the Indicator line, confirming a bearish signal.
What is required of a trader here is discipline and patience. The candle that crossed the Regression Indicator line has to first close above or below the regression line before a trader should open a trade to minimize whipsaw.

5. Explain how the moving average indicator helps to strengthen the signals determined by the linear regression indicator. (screenshot required)
Throughout my study and my research about trading, I have always learnt that no Indicator can stand alone and perform very well, instead it's best performance is unleashed when attached with another good indicator.
The linear regression indicator shares some similarities with the exponential moving average which when combined together could increase the winning rate of the trader, because so many false signals will be minimized and filtered.
Infact, combining this two Indicator on the chart is like looking out for a double confirmation before entering a trade.
From the screenshot of STEEMBTC below, we can see how I combined the Linear Regression Indicator with Exponential Moving Average of a period of 14 for a better entry confirmation.

I highlighted two profitable entry signals of both buy and sell trade. The first signal which I highlighted with red shows how the candle crossed below the Linear Regression Indicator line and closed below it. That was the first entry signal but to get a double confirmation, a trader should have to wait for another candle crossover above the Moving Average before taking a buy trade. We can see how the candle made an downward move and popped through the Regression Indicator line and below above it. Then the candle further went down and also popped below the Moving Average to confirm the sell entry.
There is another sell confirmation where the candle that was first hovering below the Regression Indicator line and then crossed above the Regression Indicator line and closed above it. Then after a while, the candle further continued with the upward movement and crossed above the Moving Average, giving a double confirmation of a sell trade.
Therefore combining the Linear Regression Indicator with the Moving Average is like having a double layer for price action to break through for a better entry confirmation.

6. Do you see the effectiveness of using the CFD-style linear regression indicator? Show the main differences between this indicator and the TSF indicator (screenshot required)
Before I talk about the effectiveness of Linear Regression Indicator in CFD trading, I would love to talk a bit about what CFD trading is.
CFD trading is simply a short-term trading where a trader gets into a trade within a short period of time with the aim of making profit. One of the best Indicators that is often used in this type of trading is the Time Series Forecast Indicator. This indicator is very sensitive to price movement and as such it foretells the direction which a trend will go.
The Time Series Forecast Indicator is much similar to the Linear Regression Indicator when it has to do with how it look. They both look alike when added to the chart and also they display the same numbers or closely the same numbers on their panel.


From the screenshots above, we can see two different indicators which are TSF with a length of 14 and LRI with a length of 14 looking exactly the same on the same chart of STEEMUSD, with them same time frame too.

Infact, the figures of both indicators on the aforementioned chart are also the same.
Another major difference between the two indicators is that TSF outperforms LRI in terms of sensitivity to price change. This means that TSF always respond to price change first before LRI does, even though it doesn't seem to last for a long time.

Also, TSF gives a view of what direction trend will go first before LRI does.

7. List the advantages and disadvantages of the linear regression indicator
Advantages of LRI
LRI gives an early picture of when a particular trend is about to end.
It helps in the identification of early trend reversals
The Indicator is very sensitive to early price change and there give early trade entry signal.
Understanding how the Indicator works is much easier.
Both long-term and medium-term traders find this indicator very useful and profitable.
Disadvantages of LRI
The Indicator cannot perfectly work alone to give profitable trading signals unless combined with other good Indicator.
It is not very suitable for short-term trading as it is prone to giving false signals
It is not very suitable for all time frames. Shorter time frames will result in so many false signals.
The indicator sometimes do whipsaw

Conclusion
Linear Regression Indicator is an indicator that is very sensitive to price changes. It has over the years been a profitable indicator to traders because of the so many early trade entry signals it gives and the early trend exhaustion signal.
This Indicator is very suitable for both medium-term and long-term trading. Using it on a higher period and a higher time frame will always increase the winning rate of the trader especially when combined with the Moving Average.
Learning about this indicator is one the best thing that has happened to me this week and I want to thank Prof @kouba01 for this great and profitable lecture.
Thank you for having me
Please note that all unsourced images are screenshots taken from Tradingview site.