REPOST: Trading Using Wedges Pattern - Steemit Crypto Academy - S5W5 - Home Work Post for Prof @sachino8

Here is a repost of my assignment for Prof @sachino8 that was marked but wasn't curated. This is the link to the former
Hello Prof, having read your lecture note for this week, I'm delighted to be a part of this task.
Below is my home work.

EXPLAIN WEDGE PATTERN IN YOUR OWN WORDS.
A wedge can be defined as a price pattern that can be identified by converging trend lines on a chart. Converging in the sense that the asset's price and the indicator moves toward each other(their respective price asset and indicator). Also, convergence usually happens because an efficient market won't accept the trading of a thing for two prices at the same time.
These two trend lines are usually drawn on the price chart and they have a large opening at the beginning which converge. One of the lines is drawn above the price which acts as the resistance level and the second beneath the price which in turn acts as the support level.
Below are the three common features of the wedge patterns
The converging trend lines
A decreasing volume of pattern as the price continues movement through the pattern.
Breaking out or a break out from one of the trend lines.
Also, wedges occur in a market trend.These wedges can either be seen in the movement of a bullish trend or a bearish trend. Therefore with these, there are two types of wedges, the rising and the falling wedges. The rising wedge can otherwise be known as the bearish trend and the falling wedge, bullish trend. These wedges will be extensively looked into in the next question as they have their reasons for being referred to as such.

EXPLAIN BOTH TYPES OF WEDGES AND HOW TO IDENTIFY THEM IN DETAIL.(SCREENSHOT REQUIRED)
As said earlier, there are two types of wedges which are;
- The Rising Wedge
- The Falling Wedge
The rising wedge can be referred as the bearish kind of a wedge, reason being that the end result of it is usually a bearish outcome in the assets price. It's like a trade setup expecting a bullish trend. Therefore, when the price of an asset rises for or goes in an upward direction or bullish direction and then it experience a breakout, the movement will change it's direction to the opposite side which is the down trend or become bearish and this is known as the rising wedge.
The two trend lines which act as resistance and support above and beneath the price respectively are used by the rising wedge. These lines move until they converge at the end of the movement and when convergence is about to take place, there will be a price break out which will lead to the decrease in the volume of the assets and a down trend movement.
This is a screenshot of a price chart made up of a rising wedge and a down trend.
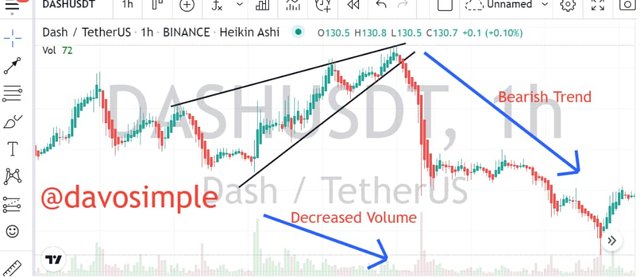
To Identify a Rising Wedge pattern, the following must be taken into consideration:
Two trend lines must be drawn on the chart. One of it above the price and the other beneath the price.
To make a valid wedge identification, make sure to draw the trend lines to touch at least five points on the chart.
The volume should be taken into consideration when trying to identify a wedge.
The falling wedge can be referred to as the bullish kind of a wedge, reason being that the end result of it is usually a bullish outcome in the assets price. It's like a trade setup expecting a bearish trend. Therefore, when the price of an asset falls or goes in a downward direction or bearish direction and then experience a price breakout, the movement will change it's direction to the opposite side which is the up trend or it will become bullish and this is known as the falling wedge.
The two trend lines which act as resistance and support above and beneath the price respectively are used by the falling wedge. These lines move until they converge at the end of the movement and when convergence is about to take place, there will be a price break out which will lead to the increase in the volume of the assets and an up trend movement.
This is a screenshot of a price chart made up of a faling wedge and an up trend.
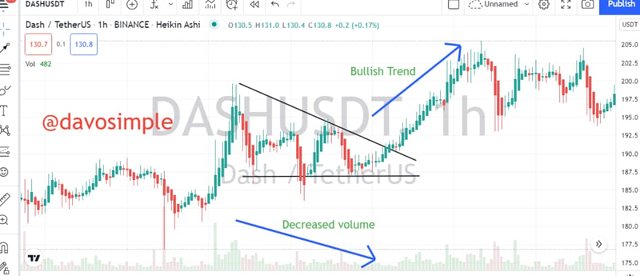
To Identify a Falling Wedge pattern, the following must be taken into consideration:
Two trend lines must be drawn on the chart. One of it above the price and the other beneath the price.
To make a valid wedge identification, make sure to draw the trend lines to touch at least five points on the chart.
The volume should be taken into consideration when trying to identify a wedge.
DO THE BREAKOUT OF THIS WEDGE PATTERN PRODUCE FALSE SIGNAL SOMETIMES? IF YES, EXPLAIN HOW TO FILTER OUT THESE FALSE SIGNAL.
Yes, the breakout of this wedge sometimes produce false signal and this false signal produced, can make a trader go into trade or stop trade at a wrong or bad time. False signal therefore refers to that signal given by a wedge pattern (either rising or falling wedge) that is or might be disastrous to traders. The wedge pattern can not be used at times to correctly spot trend movements. Therefore, there are other devices that can be used to filter out these false signals.
Indicators such as, Relative Strength Index(RSI), Moving Average Convergence Divergence (MACD), etc, can actually be used to filter out these false signals.
SHOW FULL TRADE SETUP USING THIS PATTERN FOR BOTH TYPES OF WEDGES.(ENTRY POINT, TAKE PROFIT, STOP LOSS, BREAKOUT).
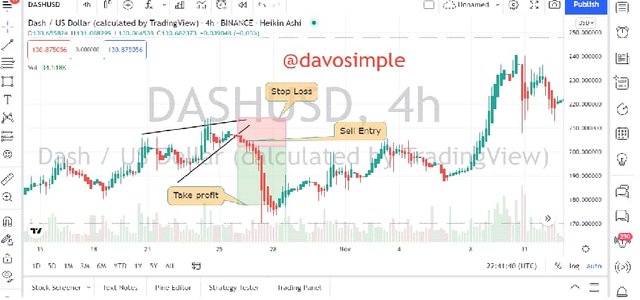
Below is a screenshot of a DASHUSD pair chart with a rising wedge which I used to setup my selling order. A sell entry or setup is normally the case for a rising wedge because the price movement of an asset will go bearish after the price breakout.
As can be seen in the chart, we have the two trend lines, the sell entry position has been marked too, the stop loss and the take profit hasn't been left out.
Below again is a screenshot of a DASHUSD chart with a falling wedge which I used to setup my buying order. Buying entry is a case for a falling wedge because it is always set when the trend moves in an upward or bullish direction.
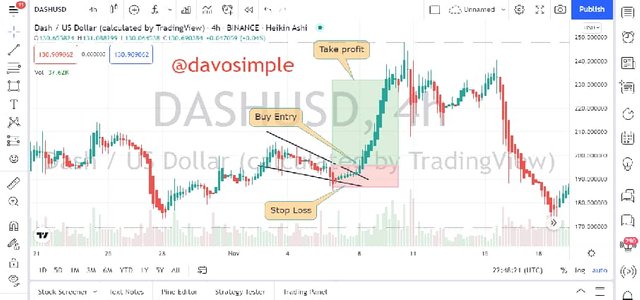
As can also be seen in the chart above, the trend lines, buy entry, breakout, the stop loss and take profit are not left out, there are all indicated/marked.
CONCLUSION
The knowledge of wedge patterns is a necessity in the life of every trader who wants to be successful. Also, the knowledge of other signal prediction devices is important because none of the technical analysis devices can give a complete accurate prediction or signal of trade.
A million thanks to Prof @sachino8 for such a wounderful lecture. I have learnt a great deal.
Hello @steemcurator02, please this is a REPOST of my uncurated homework post.