Steemit Crypto Academy | Season 5: Week: 6 | Homework post of @fredquantam || Crypto Trading Keltner Channel Indicator by @dabeerahmed
Yesterday I go through the lecture taught by our respected professor @fredquantam which is all aboutTrading Crypto with Keltner Channels and here is my homework post in this regard, so let's begin with it without wasting much time;
.jpg)

1. Creatively discuss Keltner Channels in your own words.
Keltner Channels
The Keltner Channel indicator is a volatility-based indicator composed of three oscillating lines that reflect the volatility and momentum of a trend via its lines (Upper band, lower band, and EMA), with the EMA located in the midst of the upper and lower bands.
Chester W. Keltner developed and presented the Keltner Channel indicator in the mid 1960s, but Linda Raschke revised and modified it to meet modern trading standards in the early 1980s.
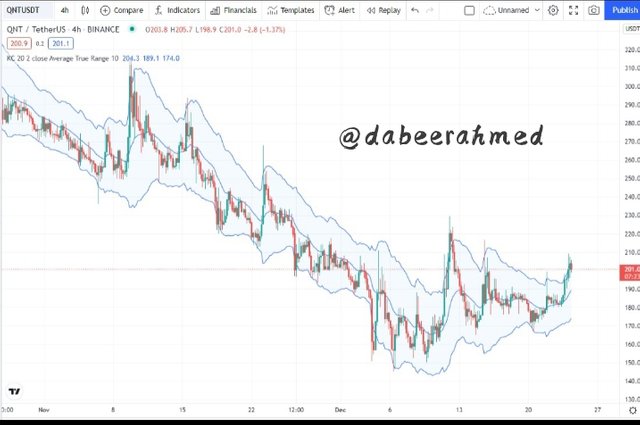
The Keltner Channel indicator represents a traded market's volatility with upper and lower bands that are set to two (2) times the average true range (ATR) above and below the EMA (This can be adjusted depending on the trading system and strategy). Ideally, the Keltner Channel indicator detects the trend based on the indicator's angle and price movement, dynamic resistance, support areas, and breakouts.
In an up-trend market, for example, the Keltner Channel indicator will identify the trend since the indicator angle will be facing and rising upwards, with price creating consistent higher highs and higher lows. The Keltner Channel indicator angle will be facing and moving downward in a downtrend market, with price producing continuous lower highs and lower lows.
Following the principles outlined above, the Keltner channel indicator can confirm price direction by forming upward angles for an uptrend and downward angles for a downtrend. A break above the upper band implies a strong upward movement, while a break below the lower band suggests a strong downward movement. Below is the screenshot of Keltner channel indicator in the chart.
2. Setup Keltner Channels on a Crypto chart using any preferred charting platform. Explain its settings. (Screenshots required).
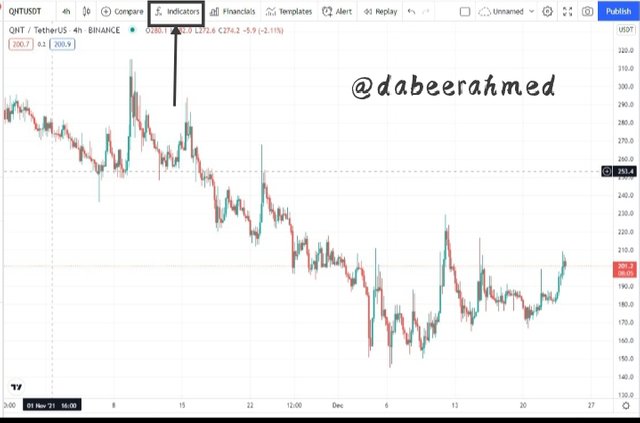
To add the Keltner channel indication to a price chart, go to any platform that allows the use of indicators. I used Tradingview for this example.
Adding Keltner Channels To The Chart
- First, go to Tradingview's official website and navigate to the platform's chart area.
- Then, in the top center menu, select indicators or Fx.
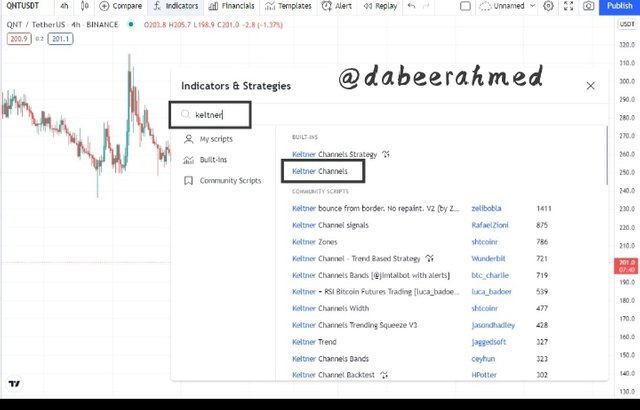
- Then, look for the Keltner channel indicator using any relevant phrase, such as Keltner, Keltner channel, and so on.
- Then, to add the Keltner channel indication to the price chart, click on the indicator search result.
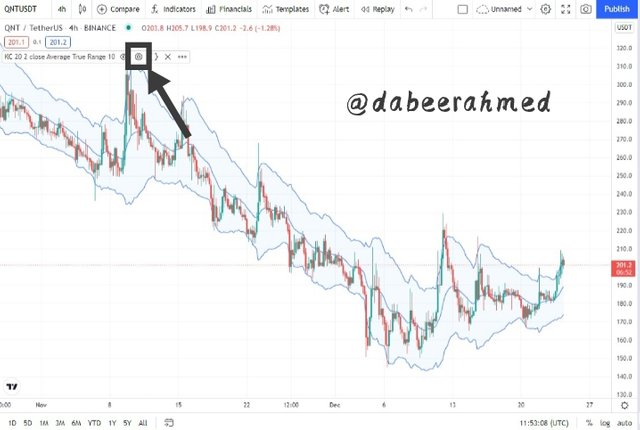
- The Keltner channel indicator has been added to the price chart, reflecting the asset traded's trend volatility.
The screenshot of all above points are given below;
.jpeg)
Keltner Channels Indicator Configuration
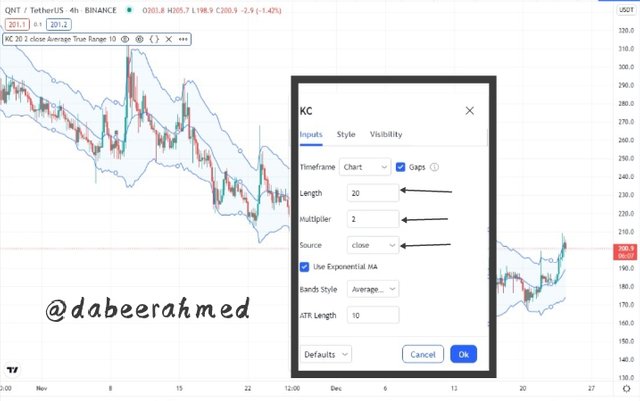
- To configure the Keltner channel indicator, hover your mouse over the indicator's name in the top left corner and select settings.
- Input Tab: The Keltner channel indicator has a default period of 20, a multiplier of 2, and an ATR length of 10 which is displayed on the inputs tab. The indicator period parameters can be adjusted to suit the trader's trading system and approach.
- Style Tab: The Keltner channel indicator curve color, thickness, and precision for the upper bounds, lower bounds, and the EMA can be adjusted under the Style tab to meet the trader's needs.
The screenshots of configuration of Keltner channel indicator are provided below
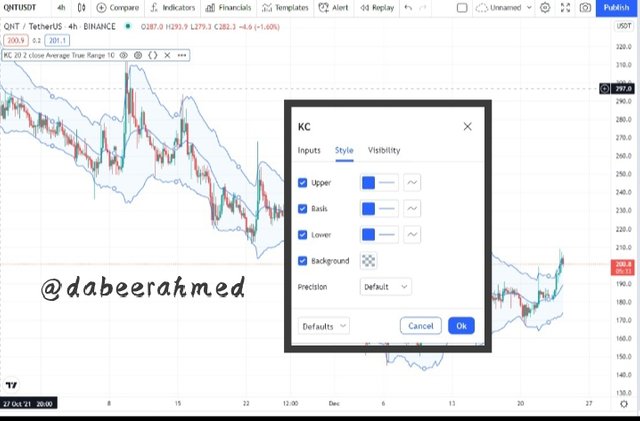
Default Settings Of Keltner Channel Indicator
The Keltner channel indicator has a default period observation of 20, a multiplier of 2, and an ATR value of 10, although the ideal setting depends on the trading system and asset traded. A shorter indicator period is used by a short-term trader, whereas a higher indicator period is used by a long-term trader.
Backtesting the indicator strategy and determining the Keltner channel indicator behavior when combined with other technical indicators such as moving average might help to establish the ideal setting.
3. How are Keltner Channels calculated? Give an illustrative example.
In this section of the assignment, I will demonstrate how Keltner channels are calculated. As previously stated, the indicator is made up of three lines: the lower, middle, and upper band lines. Also, keep in mind that the center Line is the exponential moving average (EMA), while the upper and lower bands are the average true range (ATR) with the multiplier of 2. So, let's have a look at how these are calculated.
As a result, the following are required for the computation of Keltner channels:
- EMA
- Average True Range (ATR)
- Multiplier
The mathematical representation for the Keltner channel indicator is as follows;
The upper band = EMA + 2 × ATR
The lower band = EMA - 2 × ATR
Middle line = EMA (based on the chosen observation period)
Where the multiplier is 2.
Consider the following example to see how the Keltner Channel indicator value is calculated:
EMA period =40
ATR length = 20
Multiplier = 2
The Keltner channel indicator will be computed as follows:
Middle line or band= 40 because the EMA value is also 20.
Upper band = 40 + (2 × 20)
Upper band = 40 + 40
Upper band = 80
Lower band = 40 - (2 × 20)
Lower band = 40 - 40
Lower band = 0
The upper band will go upward as a result of the above computation, indicating a highly bullish trend.
4. What's your understanding of Trend confirmation with Keltner Channels in either trend? What does sideways market movement looks like on the Keltner Channels? What should one look out for when combining 200MA with Keltner Channel? Combine a 200MA or any other indicator of choice to validate the trend. (Separate screenshots required)
Trend Confirmation using Keltner Channel Indicator
Keltner channel is an excellent indicator for confirming a trend. We are all aware that identifying the direction of the trend is one of the most crucial aspects of trading. Once a trader understands the trend, he may easily place himself in the market. However, he may become frustrated if he does not have a thorough understanding of the trends. As a result, Keltner is one of the indicators that traders use to determine which trend a specific asset is in. With this indicator, we can determine whether the trend is bullish or bearish.
Confirmation Of UpTrend Using Keltner Channel
In an uptrend, the Keltner channel indicator lines (upper band, lower band, middle line) move at an upward angle as the price makes higher highs and lows on a consistent basis. Price formations should ideally remain between the upper band and the center line, with the upper band acting as a resistance and the middle line acting as support. Take a look at the image below to see what I mean:
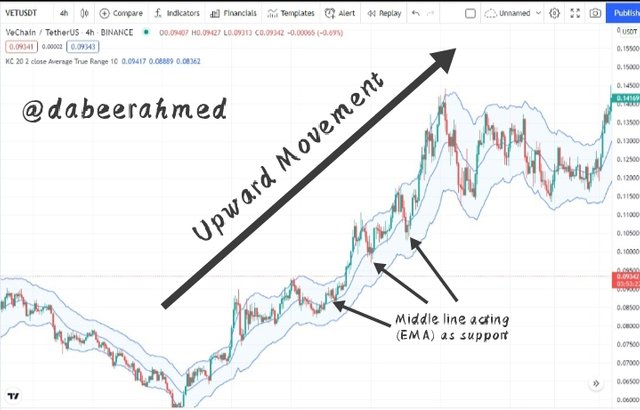
Analyzing the above provided chart, the Keltner channel indicator confirmed the trend with its upward angle movement and the formation of price staying mostly between the upper band and the middle line, since the upper band serves as a resistance level and the middle line as a support level.
Confirmation Of DownTrend Using Keltner Channel
During a downtrend, the Keltner channel indicator lines (upper band, lower band, middle line) move at a downward angle as the price makes lower highs and lows on a consistent basis. Price formations should ideally occur between the centre line and the lower band, with the middle line acting as a resistance and the lower band acting as support. Take a look at the image below to see what I mean:
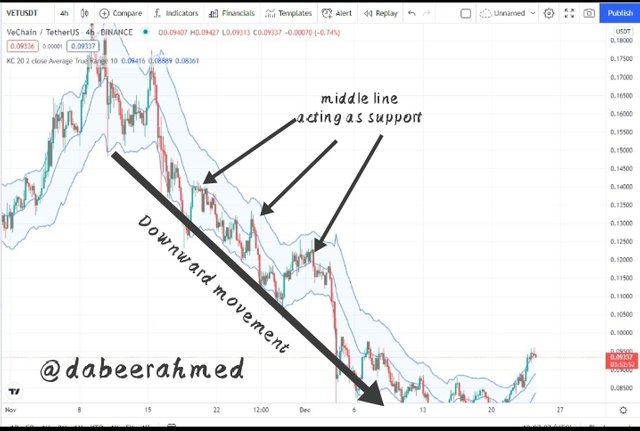
According to the following chart, the Keltner channel indicator confirmed the trend with its downward angle movement and the formation of price staying mostly between the middle line and the lower band, as the middle line serves as a resistance level and the lower band as a support level.
Sideways Market Movement and Keltner Channel
In a consolidating (sideways) market, price moves inside a resistance and support level until a breakthrough occurs above or below the resistance or support level. The Keltner channel indication depicts a sideways market with a sideways angle movement, with the upper band acting as resistance and the bottom band acting as support. Take a look at the image below to see what I mean:
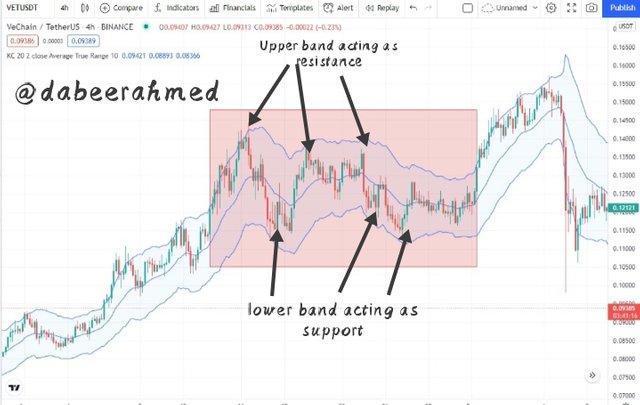
Observing the chart, the Keltner channel signal moved sideways several times while price maintained a resistance and support level. Furthermore, the Keltner indicator served as dynamic resistance and support levels to price movement, with the upper band serving as resistance and the lower band serving as support.
Combination of 200 MA and Keltner Channel Indicator
The Keltner channel indicator, like any other indicator, has a tendency to produce erroneous or distorted trade indications. To filter out the erroneous or false signals, the Keltner channel can be combined with additional indicators such as a moving average (MA) with a longer time.
When combining the Keltner channel indicator and the 200 MA, there are a few things to look out for, including the following:
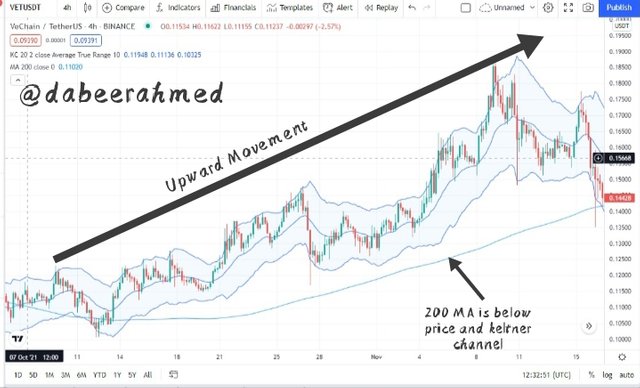
In UpTrend
In an uptrend, the 200 MA should be below the price and the Keltner channel, with the Keltner channel moving upward. This strongly confirms bullish trend. Take a look at the image below to see what I mean:
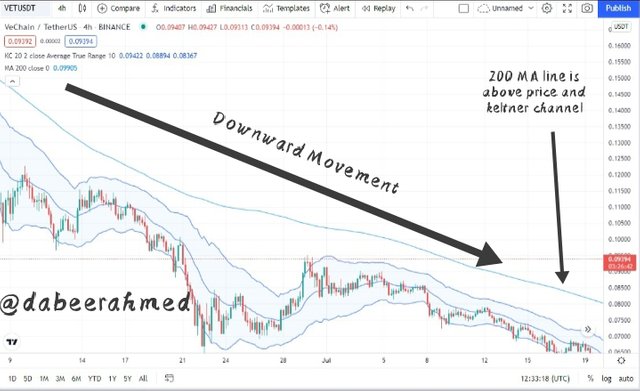
In Down Trend
In a downtrend, the 200 MA should be above the price and the Keltner channel, with the Keltner channel should be moving downward. This strongly supports bearish trend. Take a look at the image below to see what I mean:
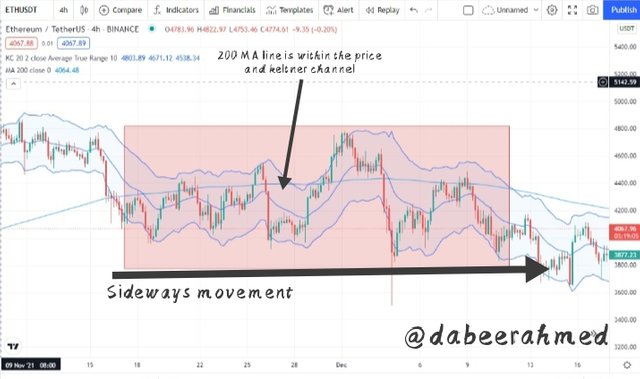
In Sideways Market
In a sideways market, the 200 MA should be within the price and Keltner channel, confirming the lack of a trend because price formation retains defined resistance and support levels. Take a look at the image below to see what I mean:
5. What is Dynamic support and resistance? Show clear dynamic support and resistance with Keltner Channels on separate charts. (Screenshots required).
Dynamic Support and Resistance
The price of an asset shown on a price chart travels in either an ascending or descending waveform, resulting in significant price swing points known as support or resistance levels. As current price development reacts to prior price swing points, the concept of dynamic support and resistance is derived diagonally. Indicators such as moving averages and the Keltner channel are commonly employed to identify dynamic resistance and support levels.
Keltner channel lines (upper, middle, and lower bands) act as dynamic price support and resistance levels. The top band should ideally act as a dynamic resistance level, while the lower band should serve as a dynamic support level. Take a look at the charts provided below to see what I mean:
Uptrend
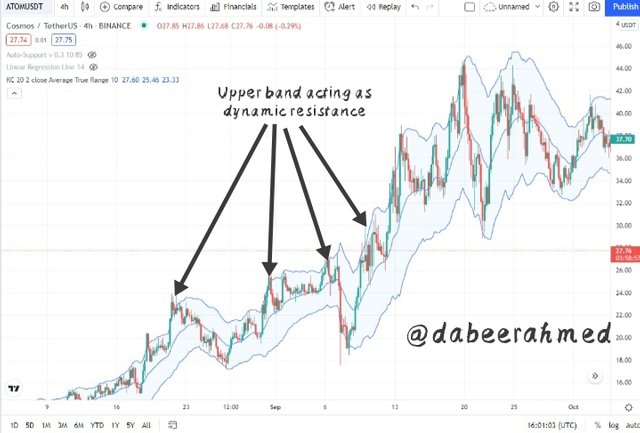
The above scenario depicts an uptrend, with the upper band acting as a dynamic resistance level. When comparing the current dynamic level to past price data, the present dynamic level corresponds to the past price swing point.
Down Trend
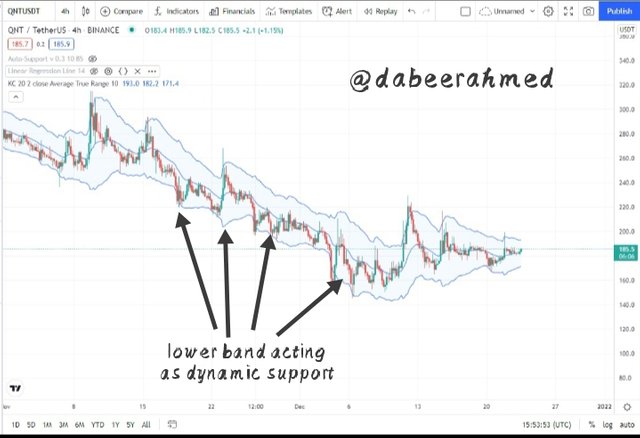
The scenario depicted above is one of a downtrend, with the lower band acting as a dynamic support level. When comparing the current dynamic level to past price data, the present dynamic level corresponds to the preceding price swing point.
6. What's your understanding of price breakouts in the Crypto ecosystem? Discuss breakouts with Keltner Channels towards different directions. (Screenshots required).
Breakouts in Crypto Trading
Breakouts in trading occur after a period of sideways price movement, in which price swings within a determined level of resistance and support. The Keltner channel indicator can be used to validate the breakout because volatility must breach either the dynamic resistance level or the dynamic support level before the price can continue in the desired direction. Price breaches above or below the Keltner channel indication lines on a technical level. The Keltner channel confirms the move, as its lines move in the same direction as the breakout.
Keltner Channel Bullish breakout
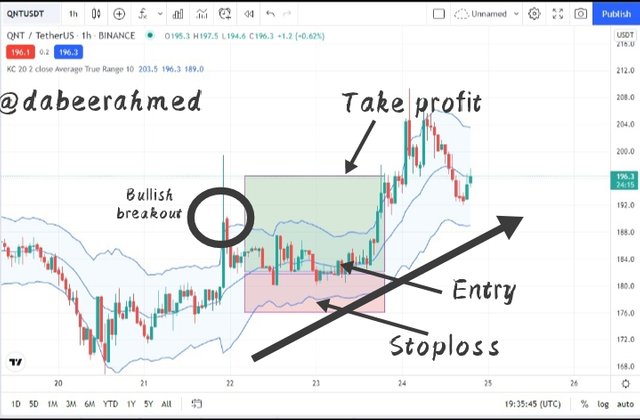
In an uptrend, a breakout at a resistance level indicates that the upward trend will continue. With price breaking and closing above the upper band, the Keltner channel signal confirms the breakout (dynamic resistance). This break demonstrates the positive volatility that underlies price movement, allowing traders to prepare for the incoming bearish trend. Consider the chart below to see what I mean:
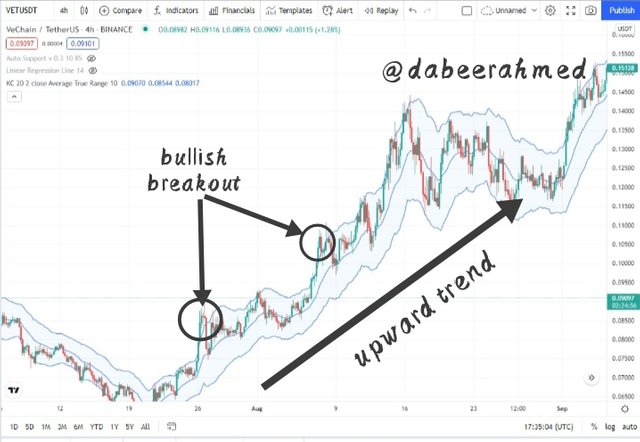
Price broke and closed above the upper band, as seen above, and the middle line functioned as a dynamic support. This indicated the possibility of a positive trend movement. Following the breakout, the bullish trend continued, confirming the Keltner channel breakout signal.
Keltner Channel Bearish breakout
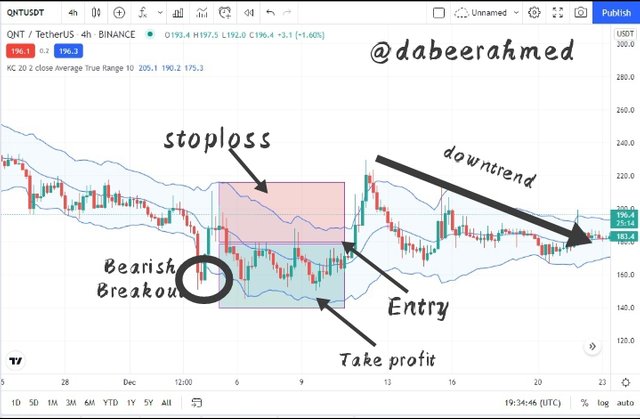
In a downtrend, a breakout at a support level indicates that the bearish trend will continue. With price breaking and closing below the lower band, the Keltner channel indicator confirms the breakout (dynamic support). This break confirms the bearish volatility that has been supporting the bullish price movement, allowing traders to prepare for the incoming bearish trend. Consider the chart provided below to see what I mean:
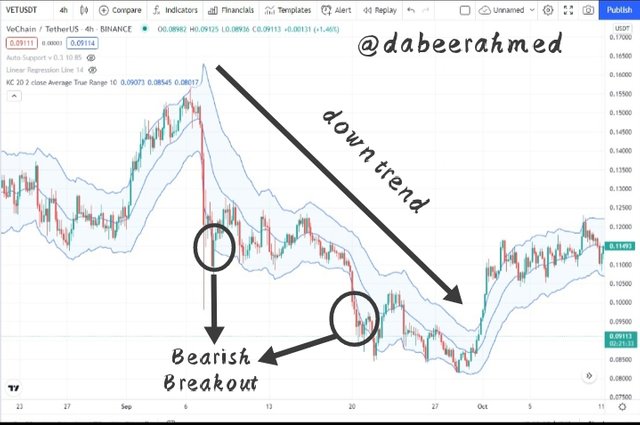
According to the above chart, the price broke and closed below the lower band, while the middle line functioned as dynamic resistance. This indicated the possibility of a bearish trend movement. Following the breakout, the bearish trend continued, confirming the Keltner channel breakout signal.
7. What are the rules for trading breakouts with Keltner Channels? And show valid charts that work in line with the rules. (Screenshot required).
Trading Breakout Rules Using Keltner Channel
In this section of the assignment, I will explain the rules for trading breakouts with Keltner channels. Remember, in the previous question, I explained the breakdown of support and resistance. When the price breaks above the upper channel, it indicates the resistance has been broken, as we predicted. When the price falls below the lower band, it indicates that the support has been breached.
1. Bullish breakout
- The first thing to watch for is price movement between the centre line and upper band. Then, after a period of price movement, look for a candlestick that breaks and closes above the upper band.
- Following the breakthrough, you look for price restrictions as you move downward.
- The price should then be seen moving back or down between the upper and middle bands. When the price reaches and supports the middle band, an entry should be made after two or three candles develop in the upward direction.
- Then, set the stop loss below the middle band (EMA), and set the take profit to have a risk-reward ratio of 1:1 or 1:2.
2. Bearish breakout
- The first thing to look for is price movement between the centre line and the lower band. Then, after a period of price movement, look for the candlestick to break and close below the lower band.
- Then, following the breakout, you look for price restrictions while continuing upward.
- The price should then begin to move upward between the bottom and middle bands. When the price reaches the middle band and resists it, an entry should be made after two or three downward candles develop.
- Then, set the stop loss above the middle band, EMA, and set the take profit to have a risk-reward ratio of 1:1 or 1:2.
8. Compare and Contrast Keltner Channels with Bollinger Bands. State distinctive differences.
Bollinger Bands and Keltner Channel
Bollinger bands and the Keltner channel are both channel-based indicators that have several characteristics, such as the fact that both indicators may be used to identify trends, act as dynamic resistance and support to price movement, and breakouts confirm signals, among other things. However, there are some significant variations between them, which are as follows:
Bands
Bollinger bands
The Bollinger bands indicator's upper and lower bands are calculated using the standard deviation of price variation. This is determined by the size of the candles that form within the band, with larger candles forming broader bands and smaller candles forming narrower bands.
Keltner Channel
The upper and lower bands of the Keltner channel are calculated using the average true range (ATR), which represents the genuine range of price movement in order to create comparable bands related to price movement.
Representation Of Signals
Bollinger bands
Bollinger bands, due to the standard deviation used, tend to react slowly to price on a short-term basis by providing a smoothed chart representation. This results in delayed signals.
Keltner Channel
The Keltner channel's ATR results in a quick representation of price data on a short-term basis. This provides false signals in some circumstances since it reacts rapidly to price changes.
9. Place at least 4 trades (2 for sell position and 2 for buy position) using breakouts with Keltner Channels with proper trade management. Note: Use a Demo account for the purpose and it must be recent trade. (Screenshots required).
1. Buy Trade SOLUSDT
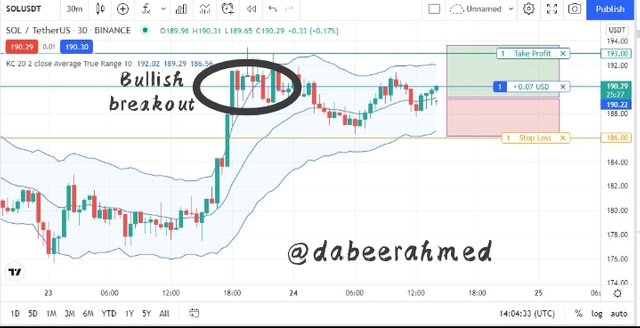
Price fluctuated and broke above the upper band of the Keltner channel on the SOLUSDT chart above, indicating a possible bullish trade signal. As the price pulled back to retest the previous structure point, the middle line (EMA) maintained support. After the appearance of two bullish candles above the middle line, I placed a buy trade order.
The buy trade was completed at $190.22, with a stop loss of $186 and a take profit of $193. The stoploss is below the middle line functioning as dynamic support and the take profit aiming for the previous high points.
2. Buy Trade ATOMUSDT
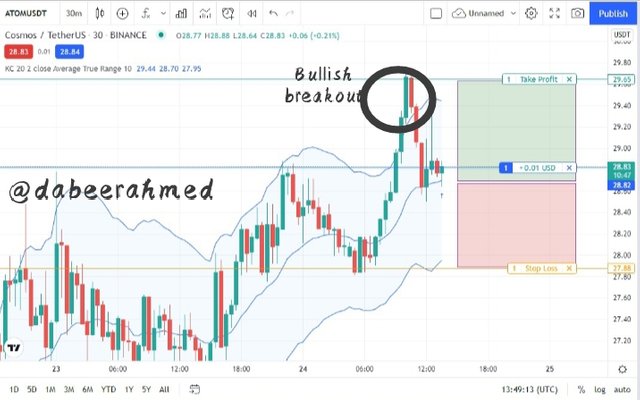
Price fluctuated and broke above the upper band of the Keltner channel on the ATOMUSDT chart above, indicating a possible bullish trade signal. As the price pulled back to retest the previous structure point, the middle line (EMA) maintained support. After the appearance of two bullish candles above the middle line, I placed a buy trade order.
The buy trade was completed at $28.8, with a stop loss of $27.8 and a take profit of $29.6. The stoploss is below the middle line functioning as dynamic support and the take profit aiming for the previous high points.
3. Sell Trade LUNAUSDT
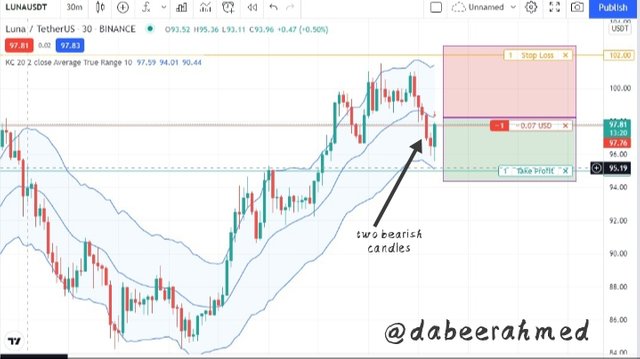
The price ranged and broke below the lower band of the Keltner channel on the LUNAUSDT chart above, indicating a possible bearish trade signal. As the price pulled back to retest the previous structural point, the middle line (EMA) maintained the resistance. After the formation of two bearish candles below the middle line, I placed a sell trade order.
The sell trade was completed at $97.7, with a stop loss of $102 and a take profit of $95. The stop loss is set above the center line, which serves as dynamic resistance, and the take profit is set to target the previous low positions.
3. Sell Trade PYRUSDT
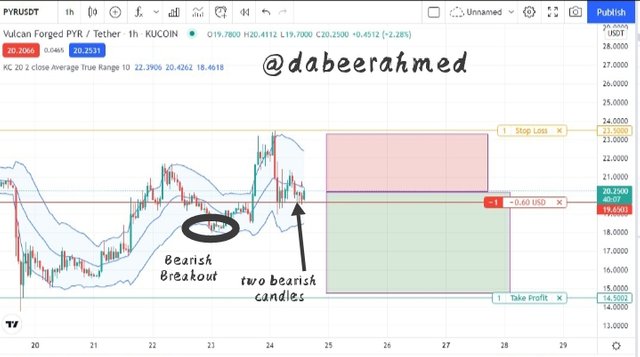
The price ranged and broke below the lower band of the Keltner channel on the PYRUSDT chart above, indicating a possible bearish trade signal. As the price pulled back to retest the previous structural point, the middle line (EMA) maintained the resistance. After the formation of two bearish candles below the middle line, I placed a sell trade order.
The sell trade was completed at $19.6, with a stop loss of $23.5 and a take profit of $14.5. The stop loss is set above the center line, which serves as dynamic resistance, and the take profit is set to target the previous low positions.
10. What are the advantages and disadvantages of Keltner Channels?
Pros of Keltner Channel indicator
- The Keltner channel indicator's graphical representation is generally simple to interpret because it just has three lines forming the channel that provides information, as opposed to different indicators which have several lines.
- The Keltner channel indicator confirms trade signals by breaking and closing above or below the upper or lower bands, with the middle line (EMA) acting as dynamic support or resistance. This is extremely beneficial to traders because buy and sell signals may be quickly spotted.
- It is a volatility-based indicator that assesses the volatility of the asset.
- The indicator is relevant to all timeframes and markets.
- The channels can be utilised to confirm a market asset's trend. The trend is bullish when the price action travels between the middle and higher bands, and bearish when it moves between the lower and middle bands.
Cons of Keltner Channel indicator
- Like many technical indicators, it occasionally produces erroneous indications. As a result, it does not provide 100 % accuracy.
- To filter the signals, it is used in combination with other technical indicators.
- It has the different view on multiple timeframes.
- In some circumstances, the Keltner channel indicator confirms trend and breakouts late, considerably reducing the potential risk to reward ratio to be realised in a trade position.
Conclusion
Technical indicators are the type of tools that is used in technical analysis. Traders use these indicators to predict price movement and direction. The Keltner Channels indicator is also an excellent indicator in this regard. It is a volatility-based indicator that measures an asset's volatility. It is comprised of three oscillating lines that represent the volatility and momentum of a trend via its lines (Upper band, lower band, and EMA), with the EMA situated in the middle of the upper and lower bands. It can also be used to confirm trends and provide trade signals.
To filter the trend, it can be combined with the Moving Average or any other trend-based indicator. As a result, when used in conjunction with other methods, it produces more accurate signals.
Note: All the above provided screenshots are taken from TradingView
Regards, @dabeerahmed