Steemit Crypto Academy | Season 5: Week: 5 | Homework post of @kouba01 || Crypto Trading Linear Regression Indicator by @dabeerahmed
Yesterday I go through the lecture taught by our respected professor @kouba01 which is all about Trading with Linear Regression indicator and here is my homework post in this regard, so let's begin with it without wasting much time;
.jpg)

1. Discuss your understanding of the principle of linear regression and its use as a trading indicator and show how it is calculated?
Linear Regression
Linear regression employs a straight line to model the relationship between variables (dependent and independent variables). These variables are points or data on a graph, and the least square approach is the most commonly used method of linear regression. By minimising the sum of squares from each data point to the line, the least-square approach determines the best fit of the points in the graph.
Linear regression is graphically depicted on a Y and X-axis chart, with the regression line drawn to pass through the centre of the point plotted on the graph. Take a look at the image below to see what I mean:

The linear regression figure above shows how the regression line is plotted to minimize the difference between the real and estimated values.
Linear Regression Indicator in Trading
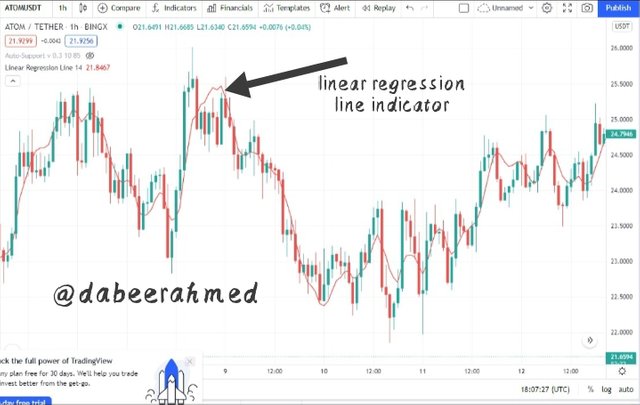
Linear regression can be used in a variety of areas of research, including trading. The Linear Regression indicator is more than just a trend following indicator rather it attempts to forecast the price of an asset in the next period. Although it appears to be a Moving Average, it is not since it does not take the average of the data points into consideration and hence does not delay as much as a Moving Average.
The linear regression line is plotted against the number of periods (X-axis) with price (Y-axis). The price in this scenario is the closing price of each period, and the number of periods is 14 by default. We draw the line of best fit when these are plotted on the graph. The line's ending value would be identical to the linear regression indicator's value for the current period. Essentially, the indication is created by graphing the end points of many lines of best fit.
Calculation of Linear Regression
This concept is represented mathematically by linear regression, and the formula is as follows:
Y = a + b(x)
Where:
a = mathematical expression constant (yΣ - bΣx) / n
b = slope expressed mathematically as (nΣxy - ΣxΣy) / (nΣx² - (Σx)²).
The period of observation is simply denoted by n.
2. Show how to add the indicator to the graph, How to configure the linear regression indicator and is it advisable to change its default settings? (Screenshot required)
Adding Linear Regression Indicator on Chart
Follow the instructions below to add the indicator to the chart:
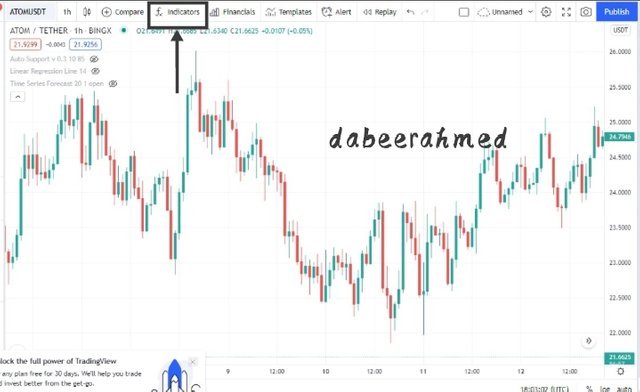
1st step: Select a chart in TradingView and then click on fx indicators which is present at the top of the chart.
Step 2: Type "Linear" into the search bar, then scroll down and pick the Regression Line Formula.
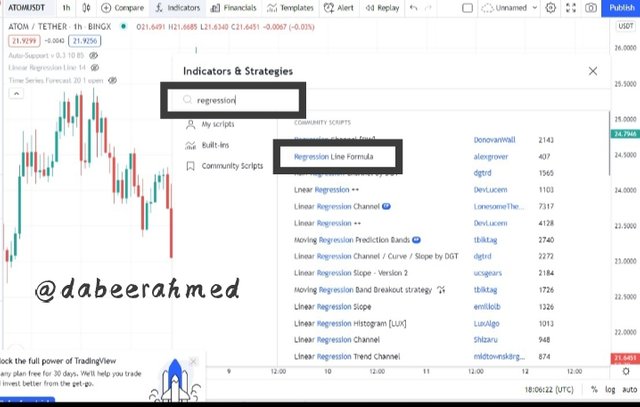
Step 3: Click on the regression line formula to add the indicator to your chart.
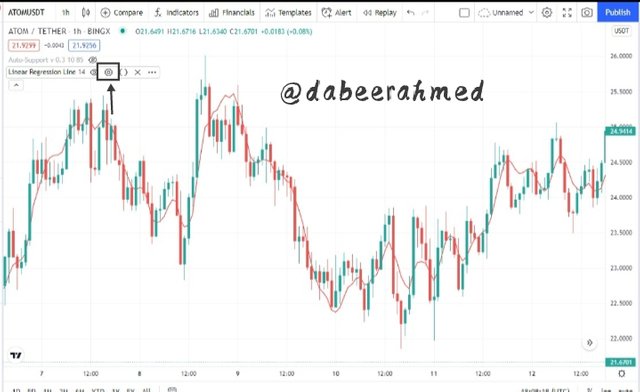
The Linear Regression Indicator Configurations
- By clicking on the Settings icon in the indicator toolbar, you can set the linear regression indicator.
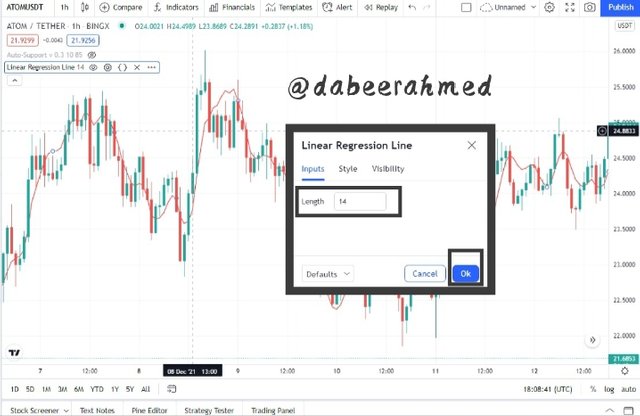
- The default length (period) is 14 on the settings pop-up under the input section. The duration can be modified to any length according on the trader's strategy and preference.
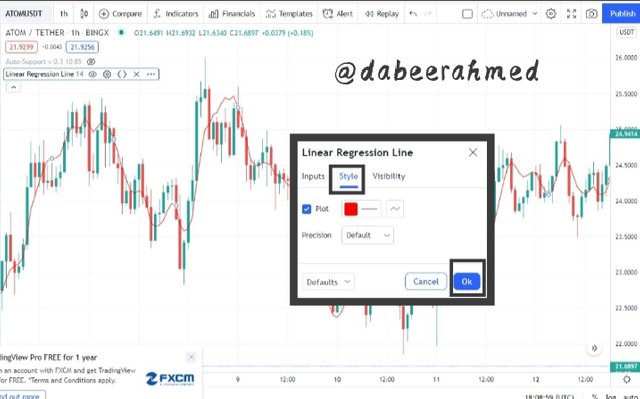
- Traders can choose the colour they want to use in the style area of the indicator's settings.
Linear Regression Indicator Default Setting
The Linear regression indicator has a default period observation of 14, although the appropriate setting depends on the trading system and asset traded. A shorter indication period is used by a short-term trader, whereas a longer indicator time is used by a long-term trader. It is recommended that traders gain sufficient experience with the indicator before changing it from the default settings.
The ideal setting may be established by backtesting the indicator technique, as well as determining the behavior of the Linear regression indicator when paired with other technical indicators such as moving average (MA).
3. How does this indicator allow us to highlight the direction of a trend and identify any signs of a change in the trend itself? (Screenshot required)
Trend Indication using Linear Regression Indicator
As previously indicated, the Linear Regression indicator functions similarly to a Moving Average. So, depending on the period used, the indicator would assist to identify a trend based on its movement direction. During an uptrend, the indicator would move higher, or have a positive slope. During a downturn, the indicator would move downwards, or it would have a negative slope.
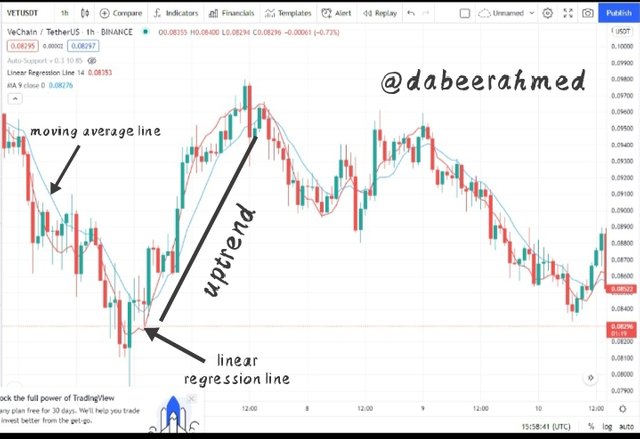
Bullish Trend
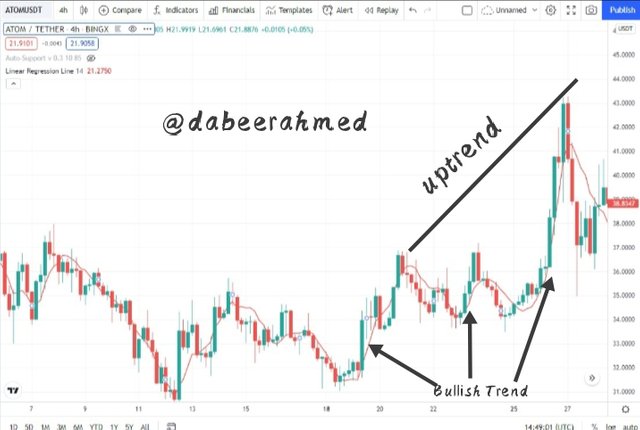
We can observe from the chart above that the Linear Regression Indicator moved upward as the price physically made higher highs and higher lows. Because the indicator has a positive slope, this is a very clear indication of an uptrend movement.
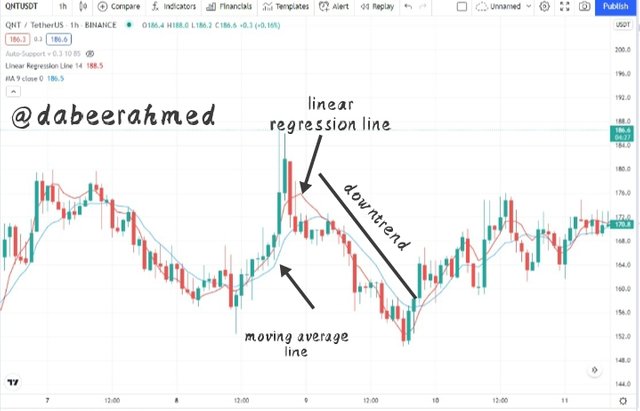
Bearish Trend
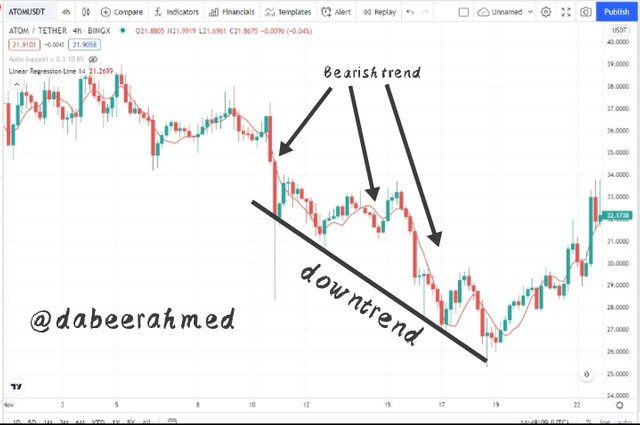
The Linear Regression Indicator moved downward as the price formed lower lows and lower highs, as shown in the chart above. Since the indicator has a negative slope, this is a definite indication of a downtrend movement.
Trend Reversal using Linear Regression Indicator
A change in the slope or direction of the Linear Regression Indicator indicates the possibility of a trend reversal in that direction. If the line crosses the price action, it indicates that the signal is quite powerful. Consider the following two scenarios:
Bullish Reversal
A bullish reversal happens when the Linear Regression indicator begins to move upward after initially moving downward in a downtrend. When the indicator crosses the price and begins to move below it like a dynamic support, this is a strong signal. The chart provided below serves a good example;
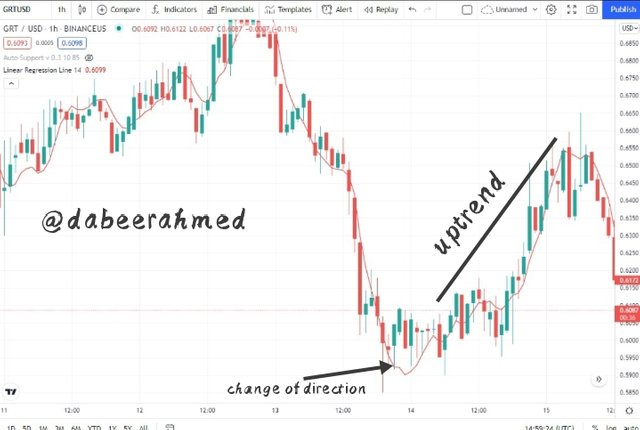
According to the chart above, the indicator crossed the price and began an upward movement at the designated areas. Following this, there was a positive reversal.
Bearish Reversal
A bearish reversal is the inverse of a bullish reversal. In this scenario, the Linear Regression indicator moves upward in an uptrend but then produces a downward curve and begins to travel in downward direction. When the indicator crosses the price and begins to move above it like a dynamic resistance, this is a stronger signal. The chart provided below serves as a good example;
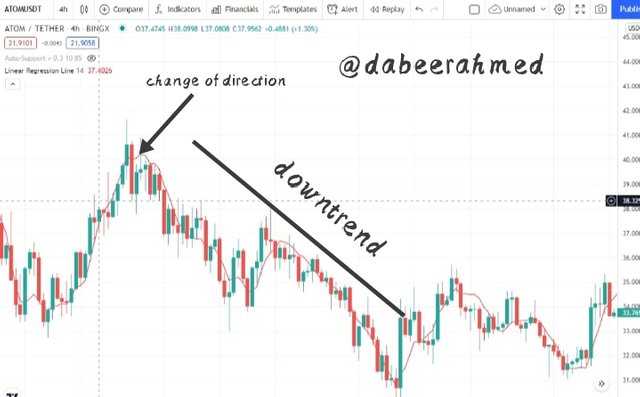
According to the chart above, the indicator crossed the price and began a downward trend at the marked points. This was immediately followed by a bearish reversal.
4. Based on the use of price crossing strategy with the indicator, how can one predict whether the trend will be bullish or bearish (screenshot required)
Price Crossing Linear Regression Line Strategy
The linear regression crossing is a trading method that uses price action and the linear regression line to generate trade signals. The intersection of price and the linear regression indicator line is used in this technique. The cut crossing provides trade clues concerning the direction price will take. As each provides trade signals, the linear regression cut with price can be downwards or upwards.
Bullish Cross
When the Linear Regression Indicator line cuts the price actions upwards, the linear regression crossing sends a positive signal. As the cut is made upwards, the Linear Regression line curve is below the candlestick, suggesting a buy signal.
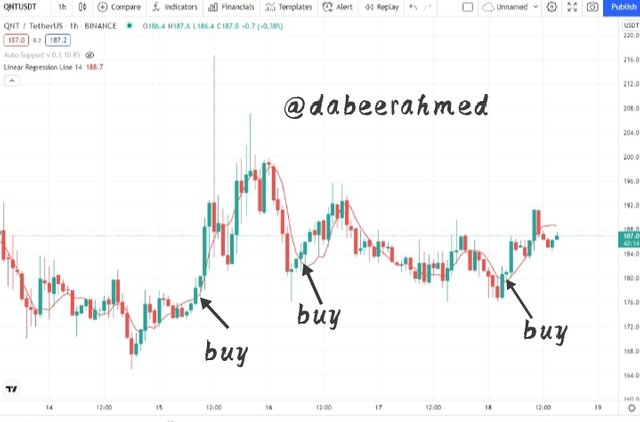
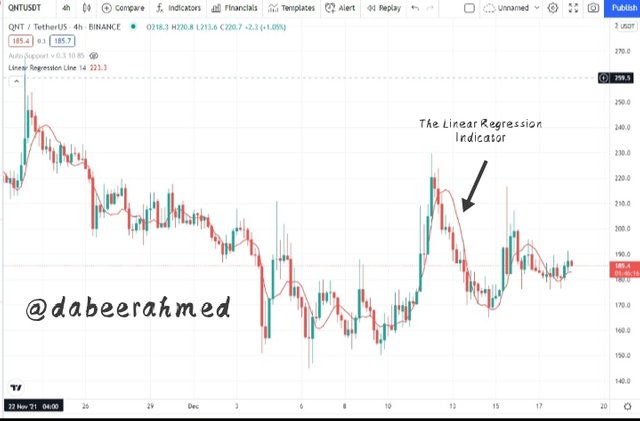
On the above QNTUSDT chart the Linear Regression Indicator line cuts through the price upward, signalling a buy signal.
Bearish Cross
When the Linear Regression Indicator line cuts the price actions downward, the linear regression crossing sends a bearish signal. The Linear Regression Indicator line curve is above the candlestick, giving a sell signal, as the cut is downward.
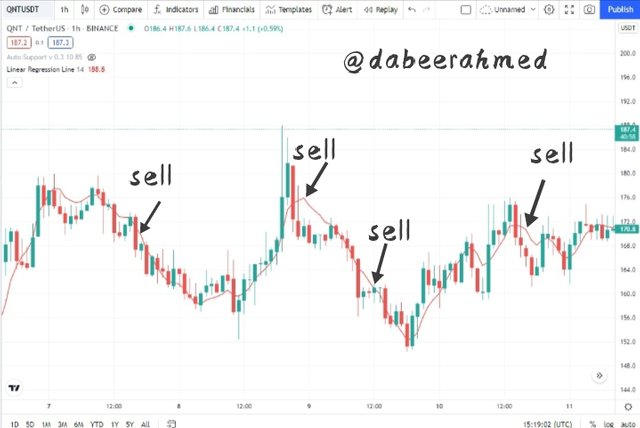
On the above QNTUSDT chart the Linear Regression Indicator line cuts through the price downward, signalling a sell signal.
5. Explain how the moving average indicator helps strengthen the signals determined by the linear regression indicator. (screenshot required)
Linear Regression and Moving Average
As earlier mentioned, the moving average and the linear regression indicator both mostly provide trade indications in the same way. When compared to the moving average, the linear regression indicator reacts faster to market action and delivers more trade indications (but also increasing the amount of false signals).
Some traders employ a combination of the moving average and the linear regression index to help filter out erroneous signals produced by the linear regression indicator. The method operates by entering a trade when the moving average and the LRI both give the same trade signal, resulting in a double signal. The moving average and linear regression indicators can be configured in the same way or differently depending on the trader's trading approach.
When the price breaks through the Linear regression line and the moving average, it indicates a bullish trend or a buy signal. In addition, as illustrated below, the moving average is below the Linear Regression line and price.
In the case of a bearish trend or sell signal, the moving average and linear regression line cut through price downwards, with the moving average going above the linear regression line and price.
6. Do you see the effectiveness of using the linear regression indicator in the style of CFD trading? Show the main differences between this indicator and the TSF indicator (screenshot required)
The usage of a linear regression indicator in CFD trading is quite beneficial and, in most circumstances, dependable, since it assists traders and investors in identifying trends and potentially generating buy or sell trade signals from such trends. The usefulness of this indicator is dependent on the data collected from the varying price point, as price moves in a continuous uniform manner, due to the utilised price point following a natural sequence of increasing or decreasing value.
On a medium-long term basis, the linear regression indicator is utilised to forecast the likely outcome of price. The TSF, a variation of the linear regression indicator, is more useful for short-term market predictions.
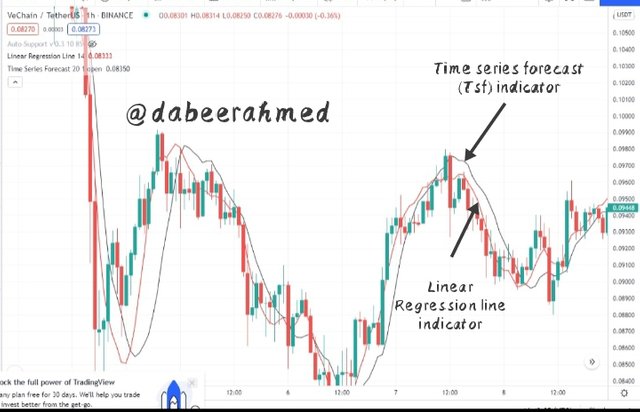
The linear regression indicator and the TSF indicator are placed on the chart with different periods, with the linear regression indicator having a period of 14 and the TSF indicator having a period of 20. As observed, the TSF reacts faster to price direction changes, making it a superior option for trading on a short-term forecast.
Difference between Linear Regression and TSF
The primary difference between the linear regression indicator and the TSF indicator is that the TSF indicator includes the slope of the plotted data points into its computation, making the TSF curve more reactive to current price changes. This means that the TSF indicator is more suited for generating short-term trading signals.
Another notable difference is the use of the TSF indicator. The TSF indicator can be used to identify price increase, decline, and reversal zones. Because the TSF is particularly reactive to changes in price movements, it can also be utilised to generate varied short-term trading signals.
7. List the advantages and disadvantages of the linear regression indicator
Advantages of Linear Regression
- When compared to the moving average indicator, the linear regression indicator responds to price action faster.
- The linear regression indicator is used to get trading alerts and identify trends. Through tactics such as the linear regression crossing strategy, which use the Linear Regression line to cut through pricing.
- Its trade signal is simple to grasp and analyse, making it a good choice for both beginner and expert traders.
- The graphical representation of the linear regression indicator is generally simple to interpret because it just has one line that conveys information, as opposed to indicators like Ichimoku or ema, which have several lines.
Disadvantages of Linear Regression
- Because it is derived from previous candle data, the linear regression indicator is called a lagging indicator.
- Not appropriate for a very volatile market.
- It generates a large number of false signals due to its great sensitivity to price motion.
- In other circumstances, the linear regression indicator confirms the trend late, which dramatically limits the potential risk to reward ratio that can be realised in a trade position in a volatile market.
Conclusion
Various mathematical approaches are used in different sectors of life. Mathematics and statistics play a significant part in price analysis and the involvement of various technical indicators in technical analysis and financial trading. The Linear Regression Indicator is a useful tool in this situation.
The ultimate aim of linear regression is to demonstrate the relationship between the plotted points and the squared distance. The Linear Regression indicator is a trend-based indicator that consists of a curve plotted with asset price values as variables over a given time period. The linear regression indicator emphasises the present trend by moving above or below the price movement. This is due to the fact that the regression curve's points are derived from varying price points utilised as variables.
Note : All the screenshots of charts are taken from Tradingview
Regards, @dabeerahmed
#kouba-s5week5 #cryptoacademy #club5050 #steemit #steemexclusive