Steemit Crypto Academy | Season 5: Week: 4 | Homework post of @fredquantum || Crypto Trading With On Balance Volume (OBV) Indicator by @dabeerahmed
Yesterday I go through the lecture taught by our respected professor @Fredquantum which is all about On balance Volume (OBV) indicator and here is my homework post in this regard, so let's begin with it without wasting much time;

1.In your own words, explain your understanding of On-Balance Volume (OBV) Indicator.
Indicators are crucial technical analysis tools that the majority of traders use to make accurate trading decisions. Traders can use On Balance Volume (OBV) indicator to get trading indications or as a confirmation tool. It is a single-line indicator that predicts the price of an asset based on the volume of buy/sell transactions in the market. The OBV indicator is a momentum indicator that measures the influx of buy and sell pressures into an asset's price. Joseph Granville was the first to design this indication in 1963. Granville believed that examining and comprehending volume inflows was a critical step toward comprehending institutional investor movement.
The buying and selling pressure is measured by the OBV indicator, which has a direct impact on the volume of assets traded on the asset. To determine and predict future/current market reactions, the previous day's volume and the current day's volume closing are used.
The OBV Indicator assists a trader in making an informed decision about whether to enter or quit a market since it allows the trader to identify trends and price direction early, even before price changes.
2.Using any charting platform of choice, add On-Balance Volume on the crypto chart. (Screenshots required).
I previously defined the OBV indicator. It has numerous advantages for traders. You must, however, add it to your chart before you may enjoy the benefits. This time, I'd want to show you how to include it into a chart. I'm going to use [Tradingview](tradingview.com] as an instance.
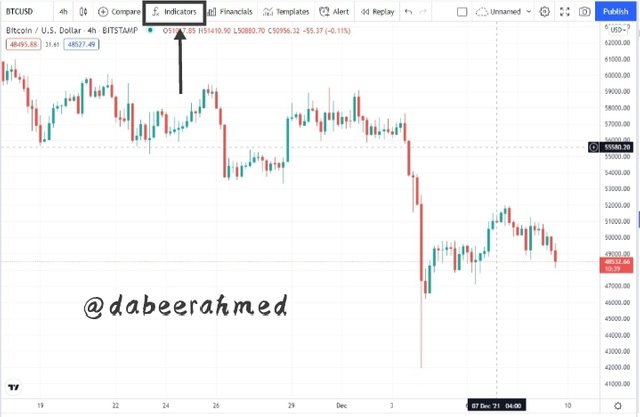
- To begin, visit tradingview.com and go to the chart page.
- Now select indicators and strategies button which is given above the chart.
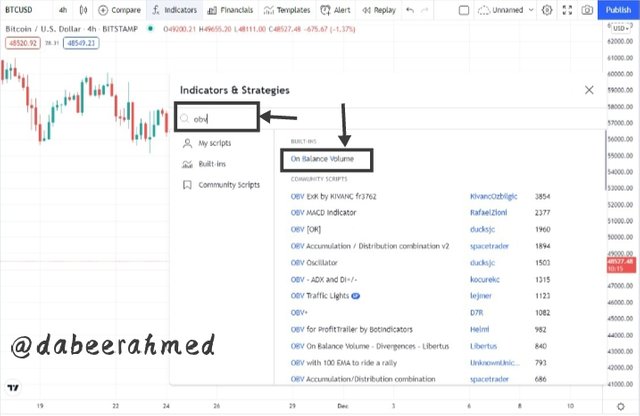
- Enter OBV in the search box and choose On-Balance Volume from the list.
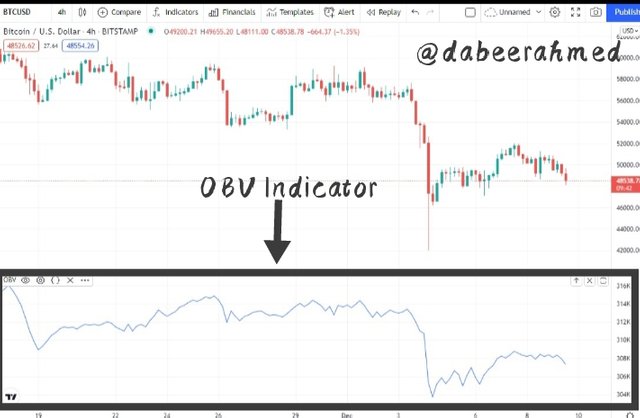
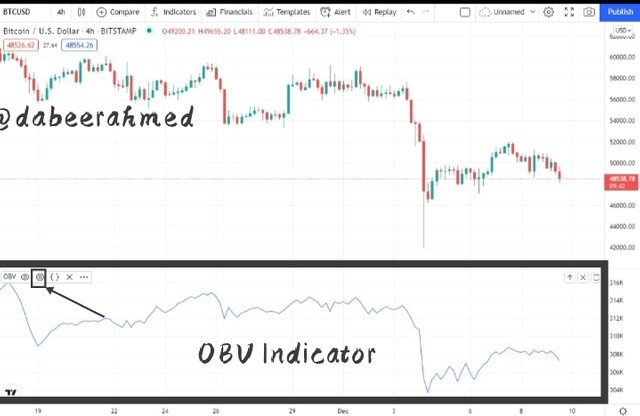
- The OBV Indicator is now visible.
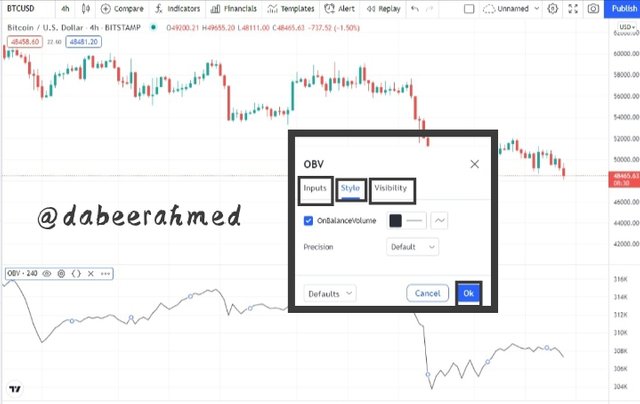
- I moved my mouse over it and selected Settings. You can customise the indicator according to your preferences in the settings. The colour of the indication line can also be changed using the style tab.
- The On Balance Volume (OBV) indicator has now been successfully added to the chart.
Below are all of the screenshots for adding the obv indicator to the chart;
3.What are the Formulas and Rules for calculating On-Balance Indicator? Give an illustrative example.
Indicators are gotten through mathematical models from price data points like the closing price, opening price, daily high and lows of price etc. The OBV calculates the total volume of an asset and determines the inflow of volume by using the closing day price (previous/present).
Let's identify some models;
If the current day's close is higher than the prior day's close, the below given formula is true.
OBV = OBV of the previous days + Volume of the current day
If the current day's close is smaller than the previous day's close, then this is true.
OBV = OBV of the previous days - Volume of the current day
If the current day's close is equal to the prior day's OBV, then this is true.
OBV = Previous days OBV
Let's look at a crypto asset's 5-day closing price and volume as an example.
Closing price of Day 1 = $10, Volume of Day 1 = 20k
Closing price of Day 1 = $12, Volume of Day 1 = 25k
Closing price of Day 1 = $14, Volume of Day 1 = 22k
Closing price of Day 1 = $16, Volume of Day 1 = 25k
Closing Price of Day 1 = $18, Volume of Day 1 = 27k
We can now calculate the OBV for the data above.
Day 1 OBV = 0
Day 2 OBV = 0 + 25,000 = 25,000
Day 3 OBV = 25,000 - 22,000 = 3000
Day 4 OBV = 3000 + 25,000 = 28,000
Day 5 OBV = 28,000
We added the volume for days 2 and 4 because the closing price was higher than the prior day's closing price, as seen in the above computation. In addition, we subtracted on day 3 because the closing price was lower than the day before. Day 5 is also identical to day 4 because the closing price is the same as the prior day's closing price.
4.What is Trend Confirmation using On-Balance Volume Indicator? Show it on the crypto charts in both bullish and bearish directions. (Screenshots required).
Every trader must have a good understanding of market trends. Before making any trading choice, a trader looks for basic signals called trends. Identifying trends will assist you in making entry and exit decisions in the trend's direction. It will also alert you when a trend is weak and a reversal is likely to occur.
In this section, we'll look at how to use the On Balance (OBV) indicator to confirm trends.
Bullish Trend
We discovered that the volume of purchasing and selling pressures in the market affects the OBV indicator line. During a strong trending market, the OBV line will typically form a series of higher highs and higher lows. This indicates that the trend is bullish, and the market is expected to continue moving upward. The graph below serves as an example.
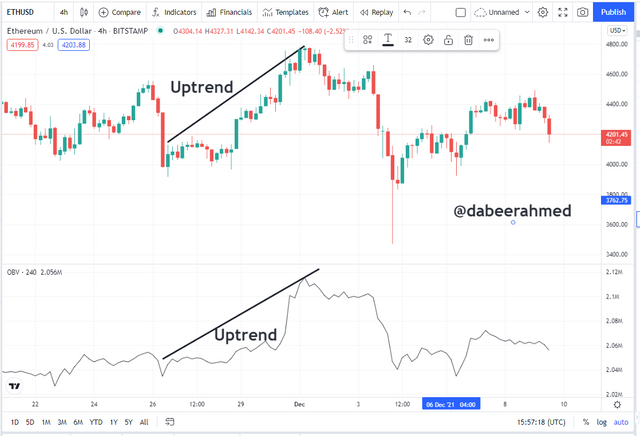
From the ETHUSDT chart we can clearly see that that the highs are getting higher highs and the low is getting higher lows. This reaffirms the upward trend. The asset's price (blue line) is likewise rising. This is a confirmation of current upward trend.
Bearish Trend
Similarly, when we see the OBV line decreasing, we notice lower lows and higher highs, indicating a downtrend confirmation. This is a confirmation of the bearish trend, as well as a hint that the price will continue to fall. The graph below serves as an example.
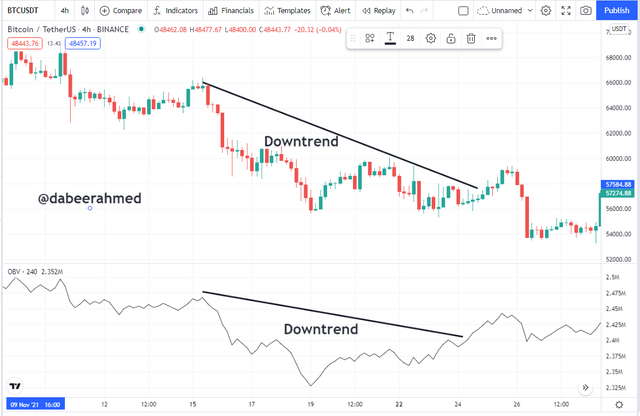
From the above BTCUSDT chart we can clearly see that the lows are getting lower lows and the highs are getting higher lows. This reaffirms the downtrend. The asset's price (blue line) is likewise decreasing. This is a confirmation of current downtrend.
5.What's your understanding of Breakout Confirmation with On-Balance Volume Indicator? Show it on crypto charts, both bullish and bearish breakouts (Screenshots required).
After a period of price consolidation, a break-out happens in the market. For price to acquire momentum before trending, this phase is known as an accumulation phase. Price tends to bounce off support and resistance zones during this period before breaking out to the upside or downside.
Confirmation Of Bullish Breakout
As price movement is accompanied by volume pumped into the market, the OBV signal can be useful in verifying price breakouts. In the below chart, we can see the line consolidating in the OBV indicator, confirming the price-volume evolution. We can anticipate a price breakout to the upside after some time. The OBV also increased as a result of the break, indicating that there was a lot of purchasing pressure in the market.
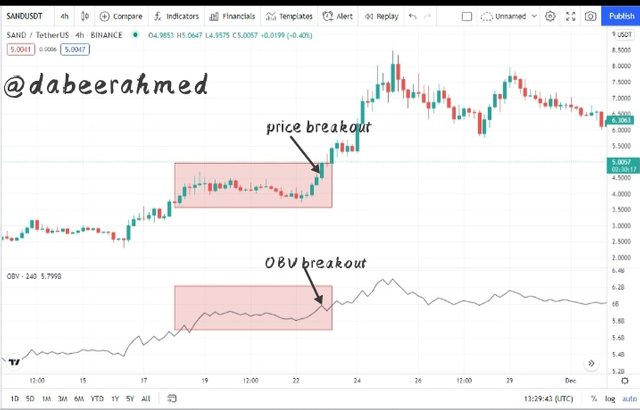
As shown in the chart above the price had broken through the resistance level, resulting in an uptrend (bullish breakout). On the OBV indicator, this action was likewise confirmed.
Confirmation Of Bearish Breakout
Moreover, after price consolidation, the chart below shows a breakout to the downside. We can see how the OBV reacted to the breakout by declining to the downside on the chart. The OBV signal confirms the downside breakout, indicating lower volume and a lack of interest in the asset's price.
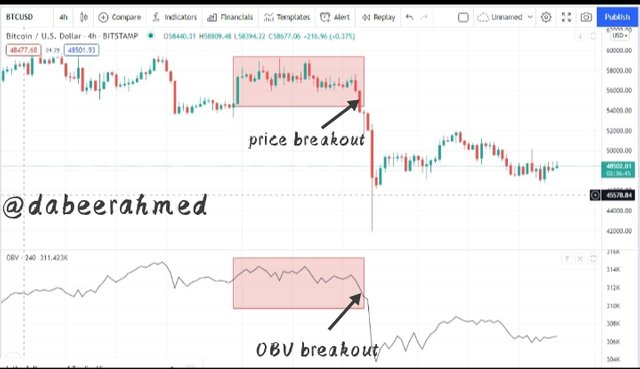
As shown in the chart above the price had broken through the support level, resulting in an downtrend (bearish breakout). On the OBV indicator, this action was likewise confirmed.
6.Explain Advanced Breakout with On-Balance Volume Indicator. Show it on crypto charts for both bullish and bearish. (Screenshots required).
We discussed how to confirm breakout using the OBV indicator in the previous section. The OBV signal will be used to confirm an advanced breakout in this section. The term advanced breakout refers to when a breakout occurs on the OBV Indicator before it occurs on the asset price. Traders can use the advanced breakout to predict and profit from price breakouts before they happen.
Bullish Advance Breakout
Price breakouts to the upside or downside in a range market. However, we frequently see the OBV indicator break a previous high when the price hasn't. This is a sign that the market has been flooded with large volumes in order to break the prior high. The graph below serves as an example.
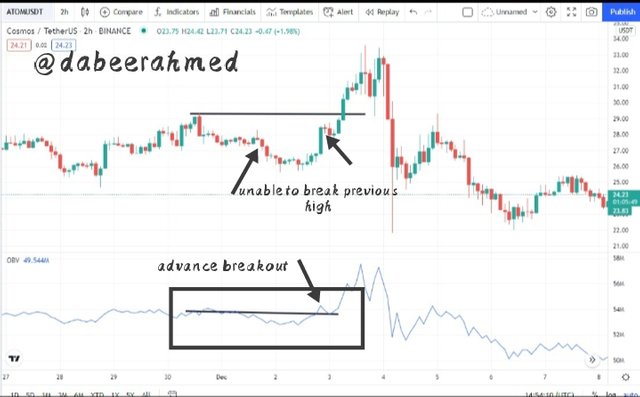
The price has failed to go above the previous high, despite the fact that the OBV has already broken above the prior high, as shown in the chart above. Following that, an uptrend occurred, confirming the advanced breakout indicated by the OBV Indicator.
Bearish Advance Breakout
A bearish advanced breakout occurs when price fails to break a previous low after the OBV signal has broken a previous low following consolidation. The breakout of the OBV suggests that volume is being reduced in order to continue pushing price lower in order to breach the prior bottom.
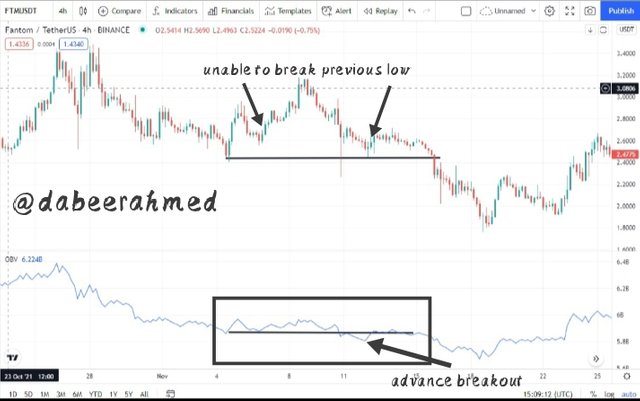
The price has refused to fall below the previous low, despite the fact that the OBV has already broken below the prior low, as shown in the chart above. Following that, a downtrend began, confirming the advanced breakout indicated by the OBV Indicator.
7.Explain Bullish Divergence and Bearish Divergence with On-Balance Volume Indicator. Show both on charts. (Screenshots required).
Bearish Divergence
Technical analysis tools use divergences to detect possible trend reversals and exhaustion using an indicator and price action. The OBV is not an emotion because it may be used in combination with price action to identify divergences. When the price is generating higher high patterns, the OBV indicator is forming lower low patterns, indicating a bullish structure. The OBV indicator's lower low formation indicates declining volume, indicating uptrend exhaustion. This information can be used by traders to exit a bearish position and seek for a sell entry opportunity. The graph below serves as an example.
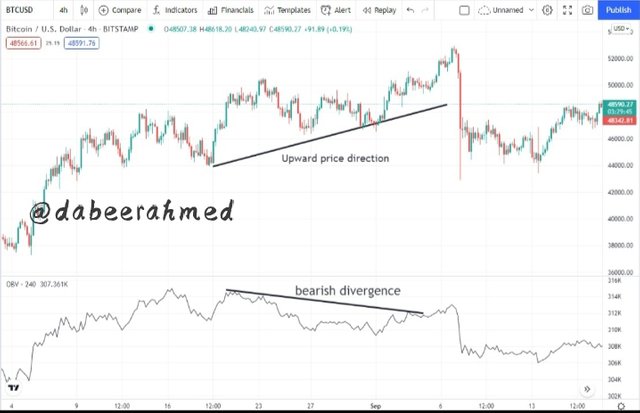
As you can clearly see in the above given chart that the OBV indicator line is moving downwards while the price is moving towards upward direction. However the price later moved down to confirm bearish divergence.
BullishDivergence
In the case of a bullish divergence, the OBV indicator tends to create higher highs and higher lows patterns as the price forms a bearish structure with lower lows and lower highs. The OBV indicator's bullish structure construction reflects growing volume pumped into the market, indicating the bearish trend's exhaustion and a likely price reversal to the upside. The graph below serves as an example.
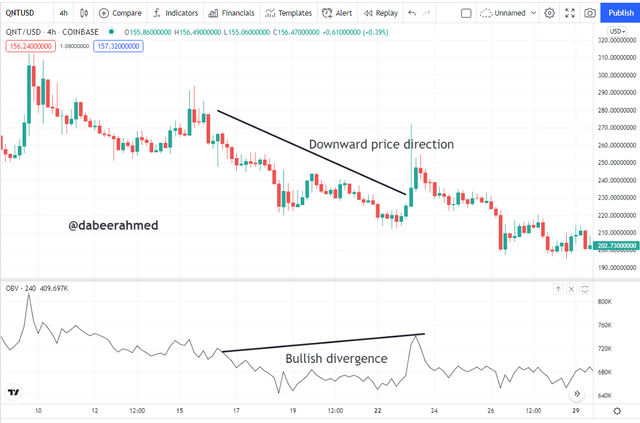
As you can clearly see in the above given chart that the OBV indicator line is moving upwards while the price is moving towards downward direction. However the price later moved up to confirm bullish divergence.
8.Confirm a clear trend using the OBV indicator and combine another indicator of choice with it. Use the market structure to place at least two trades (one buy and one sell) through a demo account with proper trade management. (Screenshots required).
In this section, I'll show you how to trade on the Tradingview platform with a demo account. I will use Moving averages in combination with the OBV indicator throughout my trades.
Buy Trade
Looking at the chart below, we can see that ONT/USD is in an uptrend, with higher highs and higher lows. This bullish trend is confirmed by the OBV indicator, which shows the line generating higher low and higher high formations, confirming the uptrend. When we combine the OBV indicator and the moving average for confluence trading, we observe that the moving average is also in accordance with the bullish signal. Price broke above the moving average, indicating that the uptrend is still valid.
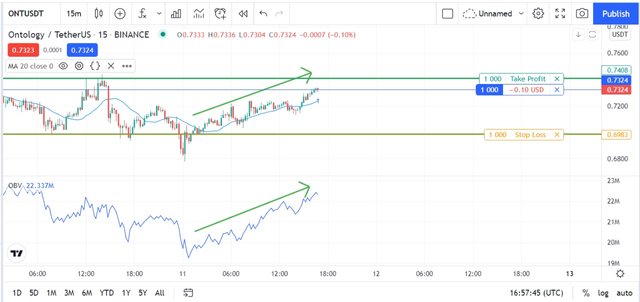
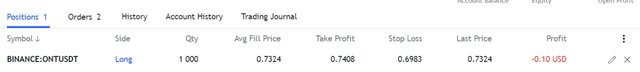
I checked this and used it to execute a buy trade in the ONTUSDT pair, which is currently trading at $0.73, with a take profit of $0.742 and a stop loss of $0.69.
Sell Trade
Looking at the chart below, we can see that QNTUSD is in a downtrend, with lower highs and lower lows. This bearish trend is confirmed by the OBV indicator, which shows the line generating lower low and lower high formations, confirming the downtrend. When we combine the OBV indicator with the moving average for confluence trading, the moving average tends to be in line with the bearish signal. Price fell below the moving average, indicating that the downtrend is still in effect.
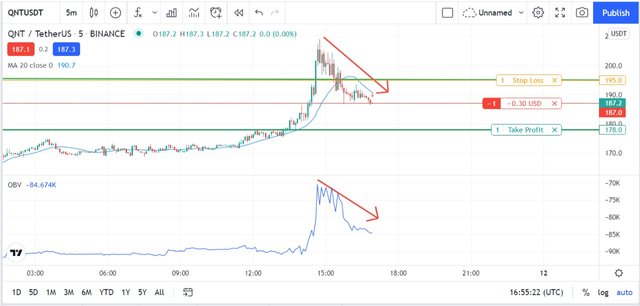
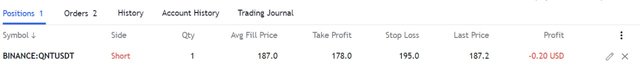
I checked this and used it to execute a sell trade in the QNTUSD pair, which is currently trading at $187, with a take profit of $178and a stop loss of $195.
9.What are the advantages and disadvantages of On-Balance Volume Indicator?
Pros Of On Balance Volume (OBV) Indicator
- A trader can quickly detect the presence of an uptrend or downtrend using an OBV Indicator.
- The OBV indicator can provide a variety of signal information, such as trend confirmation, divergences, and price breakouts, as well as assist with risk management.
- When paired with other indicators such as moving averages, the indicator's signal information can be strengthened and filtered.
- It is possible to use the OBV Indicator in both long-term and short-term trading.
Cons Of On Balance Volume (OBV) Indicator
- Due to delayed volume confirmation, it may occasionally provide incorrect information.
- To confirm a trend, it requires conjunction with other indicators.
- The indicator is a leading indicator that can be manipulated. It does not reveal the market's genuine reaction.
- We can expect false signals like any other indicator.
Conclusion
Indicators are useful technical tools. The OBV Indicator is one of the most effective indicators used by traders to predict value of an asset. It is used to confirm an upward and downward trend. This indicator assists a trader in determining when to enter and exit a market. Because the OBV indicator is a leading indicator, it works best when paired with other technical analysis tools to avoid false signals and price manipulation.
Note : All the screenshots of charts are taken from Tradingview
Regards, @dabeerahmed
#fredquantum-s5week4 #cryptoacademy #club5050 #steemit #steemexclusive