Understanding Trends II- Crypto Academy / S5W3- Homework Post for @reminiscence01

Hello Friends,
It's another wonderful experience in this journey of cryptocurrency knowledge and skill acquisition.
After studying the lecture post by Prof. @reminiscence01, I carried out series of research to know and understand more about Trend Reversal concept.
When I was satisfied with the information and knowledge I got, I then with confidence write to share my understanding of Trend Reversal.

1 a) Explain your Understanding of Trend Reversal.

I understand Trend Reversal as a turnaround in the price movement of a crypto asset.
It is a market condition when the price movement of a crypto asset changes it's direction and moves back in the opposite direction.
For example, if the price of Steem was moving upward trend and when it gets to a certain point in the market, it then changes from the upward direction and starts moving downward.
It can also be the other way round, the price moving downward and when it gets to a certain point in the market, it then changes from the downward direction and starts moving upward.
Trend Reversal tend to happen when buyers or sellers show weakness and unable to continue pushing prices up or down.
Trend reversal can be either bullish or bearish.
A bullish trend reversal occurs when the price of an asset stops moving downward and begins to move in the upward direction.
While a bearish trend reversal happens when the price of an asset stops moving upward and begins to move downward.
Below image clearly explains the reversal trend concept.
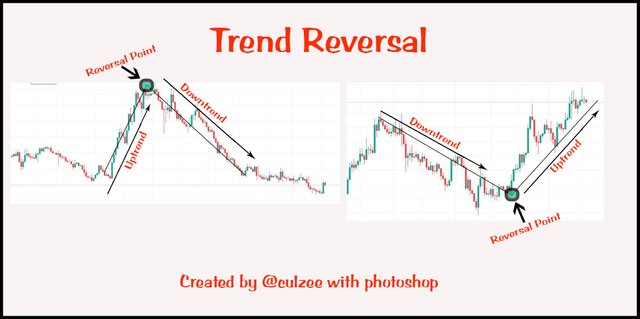
Image created by me
What is the benefit of identifying reversal patterns in the Market?
There are so many things a trader who understands and can identify trend reversal patterns in the Market can gain.
Identification of trend reversal is very necessary for a trader because of the following benefits:
it will help the trader to know the best time to enter the market. Identifying trend reversal will help a trader who understands the patterns very well to enter the market at the beginning of a trend.
it will help the trader to know the best time to exit the market. A trader who can not identify trend reversal may not understand trend reversal signal to take profit and exit the market. This will eventually lead the trader to a huge loss. But a trader who understands and can identify trend reversal pattern very well will know the exact time to take profit and exit the market without incurring loss.
it gives a trader an opportunity to make profit from trading in the opposite direction. This is another interesting benefit a trader who can identify trend reversal patterns very well can enjoy. A trader who understands and can identify trend reversal pattern very well can take advantage of bullish and bearish trend reversal to make a lot of gain. The trader will be able to identify when the market is bullish and when there is a signal for trend reversal, he or she will quickly take profit and exit the market, and then enter the market again when the market goes bearish.
Another benefit of identifying reversal patterns is that, it helps traders to reduce risk in trading. Any trader who understands and can identify trend reversal very well can easily avoid a lot of risks that exist in volatile cryptocurrency market.
b) How can a fake reversal signal be avoided in the market? (Screenshot needed).
In cryptocurrency market, a trader should be very careful and should watch out for fake reversal signals because they happen.
In cryptocurrency trading, it is not advisable to use any indicator as a standalone tool for technical analysis.
The reason is because there is no indicator that can give accurate and perfect indication of price action.
Therefore, to avoid a fake reversal signal in the cryptocurrency market, traders should use additional one or more indicators to confirm signal before entering any market position.
This will help the trader to dictate false signal and to avoid some careless mistakes in trading.
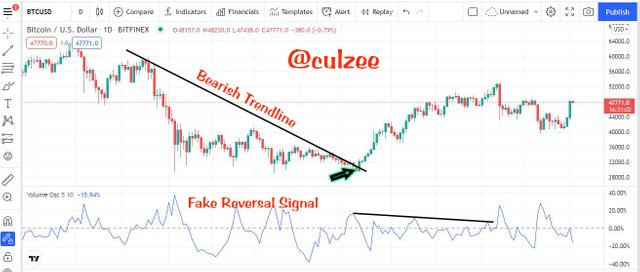
Screenshot from Tradingview.com
From the screenshot above, you will observe that the price action breaks the bearish trendline and pushing up.
Now, looking at the indicator, it continues moving in bearish direction showing no reversal at all.
In this case, a trader should either add another indicator for more confirmation or desist from entering the market to avoid mistake and loss.
2. Give a detailed explanation on the following Trend reversal identification and back up your explanation using the original chart. Do this for both bullish and bearish trends (Screenshots required).
a) Break of market structure
Market Structure has to do with the continuous asset price formation of higher highs and higher lows, in a bullish market structure and in a bearish market structure asset price also forms a continuous series of lower highs and lower lows.
Break of bullish market structure
In our last class with prof. @reminiscence01, we were thought that in a bullish market structure that the new higher high must be higher than the previous higher high and that the new higher low must not go down to reach the previous higher low.
When the price movement violates the above bullish market structure rules, the bullish trend will become invalid and will signal a reversal from bullish to bearish trend.
This shows that the buyers are no longer able to continue pushing the price in the upward direction of a trend.
This time, the buyers are failing to dominate the market while the sellers are taking over the market.
When this happens, a break of market structure will occur, and there will be trend reversal from bullish to bearish trend.
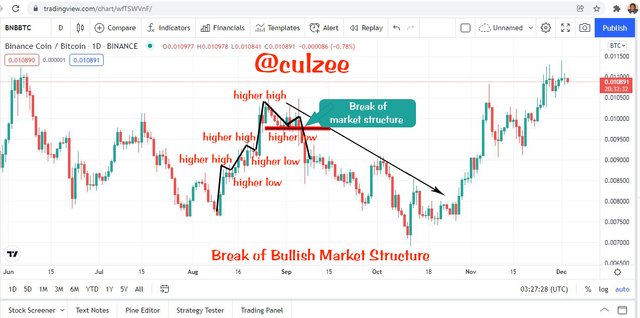
Screenshot from Tradingview.com
From the above screenshot, you will notice that the price was moving towards upward direction generating higher highs and higher lows formations.
When the price failed to create a new higher high, it stopped and there was a turnaround.
This shows that the buyers are no longer able to continue pushing the price upward and it is a strong trend reversal signal.
When this happened, sellers took over the market and there was a break of market structure. The price action then changes from bullish to bearish trend.
This is a good signal for traders to exit the buying position and enter selling position.
Break of Bearish Market structure
In a bearish market structure, the new lower high must not be higher than the previous lower high and that the new lower low must be lower than the previous lower low.
When the price movement violates the above bearish market structure rules, the bearish trend will become invalid and will signal a reversal from bearish to bullish trend.
This shows that the sellers are no longer able to continue pushing the price downward and the buyers are taking over the market.
When this happens, a break of market structure will occur, and there will be trend reversal bearish to bullish trend.
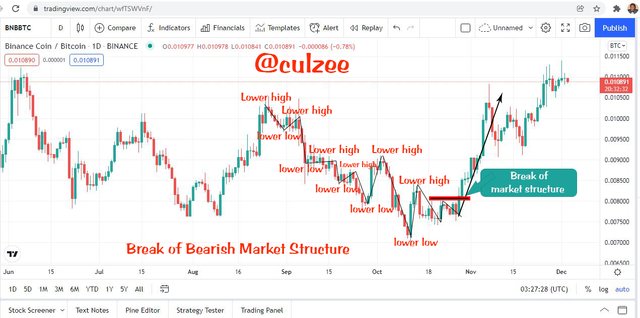
Screenshot from Tradingview.com
From the above screenshot, you will see that the price was going in the downward direction forming lower highs and lower lows.
When the price failed to create a new lower low, it stopped and there was a tr. end reversal.
This shows that the sellers are no longer able to continue pushing the price downward and it is a strong trend reversal signal.
When this happened, the buyers took over the market again and there was a break of bearish market structure. The price action then changes from bearish to bearish trend.
This is a good signal for traders to exit the buying position and enter selling position.
b) Break of Trendline
Trendline is one of the technical analysis tools that is commonly used by traders to determine market trend.
It marks out areas of resistance or support and a break of the trend line will show price movement beyond the resistance line which is a signal for a trend reversal.
A break of trendline leads to a trading opportunity, to buy cryto asset when the market trend is going upward (bullish) or to sell asset when the price movement is going downward (bearish).
Bullish Trendline break
A bullish trendline is a straight line joining at least 2 major swing low points.
As the price continues to obey the market structure rule, the price movement will always come down, hit the trendline, which is functioning as a support and resistance that will force the price to bounce back to continue with the uptrend.
This shows that the bullish trend is valid. But if the price movement violates this rule by breaking the trend line, there will be a trendline break which is a strong trend reversal signal.
At this point, traders should be ready to place a buying order.
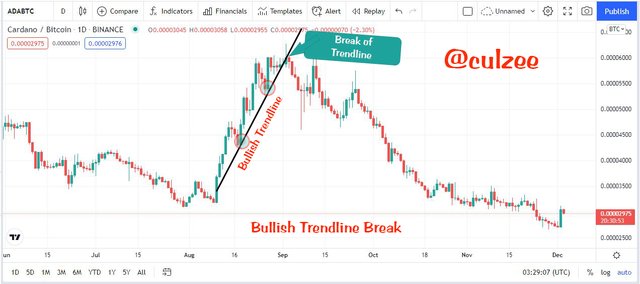
Screenshot from Tradingview.com
From the above screenshot, you will notice that the price movement was obeying the market structure rule, the price movement would come down, hit the trendline and bounces back to continue with the uptrend.
At a time, it hit the trendline and broke through and there was a trend reversal. The sellers took over the market and price started coming down.
This is a good signal for traders to exit the buying position and enter selling position.
Bearish Trendline break
A bearish trendline is a straight line connecting at least 2 major swing high points.
As the price continues to obey the bearish market structure rule, the price movement will always go uptrend, hit the trendline, which serves as a support and resistance that will force the price to bounce back to continue with the downtrend.
This shows that the bearish trend is valid. But if the price action violates this rule by breaking the trend line, there will be a bearish trendline break which is a strong trend reversal signal. At this point, traders should be ready to selling their crypto assets.
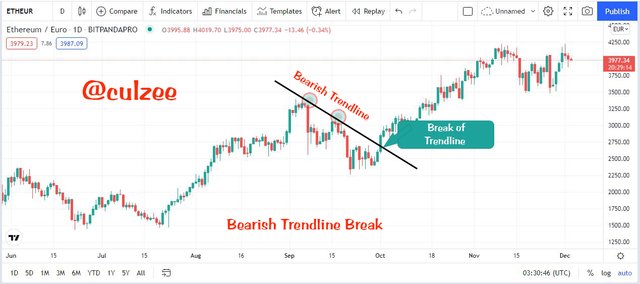
Screenshot from Tradingview.com
From the above screenshot, you can see that the price action was obeying the market structure rule, the price movement would go up, hit the trendline and bounces back to continue with the downtrend.
It got to a certain point that it hit the trendline and passed through it, and there was a trend reversal. The buyers took over the market and price started going uptrend.
This is a good signal for traders to exit the selling position and enter buying position.
c) Divergence
This is another Strategy where traders combine indicator and price action to identify trend reversal in market.
In Divergence market trend, price movement is going in one direction while indicator is going in the opposite direction.
That is to say, that divergence occurs when price movement is going contrary to the indicator's direction.
For example, price movement might be going towards upward direction with a higher high formation, while the indicator is going downward direction with a lower low formation.
This concept can be confusing to those who do not understand it. But it is a very good trend reversal identification method that gives traders early signal of trend reversal.
Traders who understand this method close up their market positions before the reversal takes effect and prepare to make another trading decision.
We have two types of divergence, bullish and bearish divergence.
Bullish Divergence
A bullish divergence is a situation in the market when price movement falls to form a new lower low while the indicator forms a higher high.
This market condition shows that the existing bearish trend is weak and that the bulls are ready to control the market.
Bullish divergence gives an early signal of trend reversal from bearish to bullish trend.
Traders can take advantage of the signal to exit their sell positions and wait for the right time to enter a buy position.
Below is a screenshot example that will give you a clear picture of Bullish Divergence.
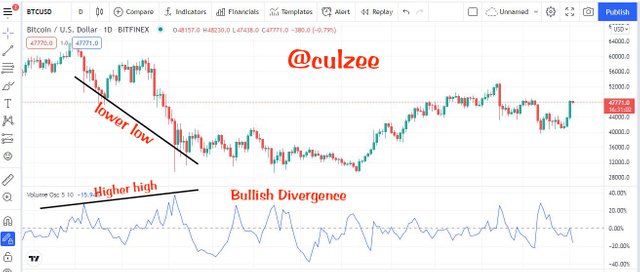
Screenshot from Tradingview.com
Bearish divergence
Bearish divergence is a direct opposite of a bullish divergence. It occurs when the price action rises to form a higher highs while the indicator is showing lower low formation.
This market condition shows that the existing bullish trend is weakening and that the bears are ready to control the market.
Bearish divergence gives an early signal of trend reversal from bullish to bearish trend.
Traders can take advantage of the signal to exit their buy positions and wait for the right time to enter a sell position.
Below screenshot will give you a clear example of Bearish Divergence.
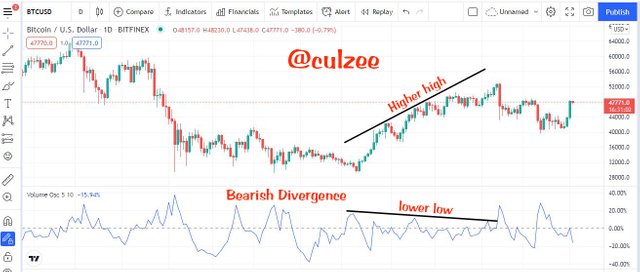
Screenshot from Tradingview.com
d) Double top and Double bottom
Double tops
The double top is one of the ways through which trend reversal can be identified.
Double top is made up of 2 tops that appear as two consecutive peaks. They are approximately at the same level with a valley that creates the neckline in between them.
In double top, the second top does not break the level of the first top. It would try to make a higher high, it would fail.
The double top pattern would be completed when the price breaks the neckline and close below it.
Double tops usually occur during a bullish market. The second top formed after the new high retest the previous high without breaking the previous high.
This shows that the buyers are weak and could not push the price above the previous high and the sellers are eager to dominate the market.
For double tops to occur, the price must not go beyond the previous high and the closing price of the new high must not be higher than the previous high.
Below screenshot shows an example of double tops on a chart.
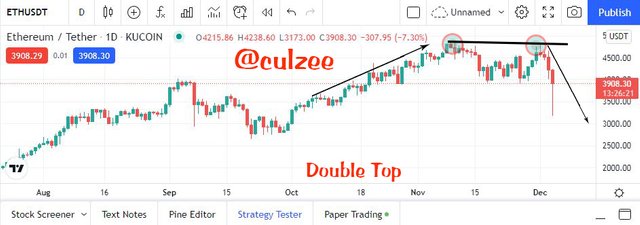
Screenshot from Tradingview.com
Double Bottoms
The double bottom is just the opposite of the double top.
It is comprised of 2 bottoms that are approximately at the same level with a valley that creates the neckline in between them.
In double bottom, the new low does not go beyond the previous low. It tries to make a lower low but failed.
The double bottom pattern would be completed when the price breaks the neckline and closes above it.
Double bottom usually occur during a bearish market. The second bottom formed after the new low retest the previous low without breaking the previous low.
This shows that the sellers are weak and could no longer push the price below the previous low and buyers are ready to take over the market.
For double bottom to occur, the new low must not go beyond the previous low and the closing price of the new bottom must not be lower than the previous low.
Below screenshot shows an example of double bottom on a chart.
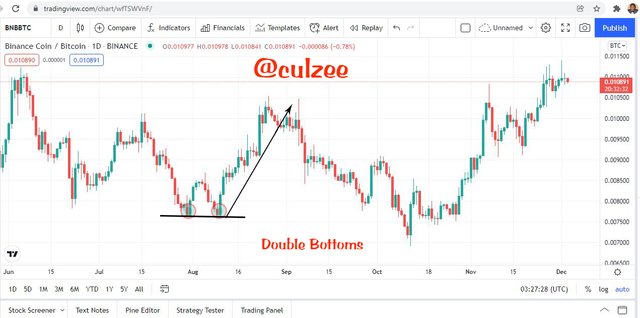
Screenshot from Tradingview.com
3. Place a demo trade using any crypto trading platform and enter a buy or sell position using any of the above mentioned trend reversal/continuation pattern.
I choose to trade BTCUSDT on Tradingview paper trading platform. I also want to use Break of Trendline reversal indicator alongside with Relative Strength Index (RSI).
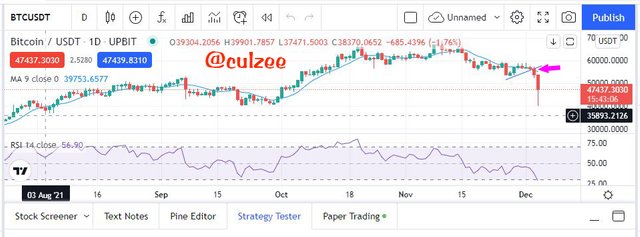
Screenshot from Tradingview.com
From the above screenshot, the price action broke the bullish trendline which signals a reversal from bullish trend to a bearish trend.
I did not take my trading decision with that signal, so I had to confirm it using the Relative Strength Index (RSI) indicator.
As you can see, the RSI indicator confirmed the signal. Having confirmed that there is a trend reversal from bullish to bearish trend, I then place a Sell Order as you can see on the screenshot below.
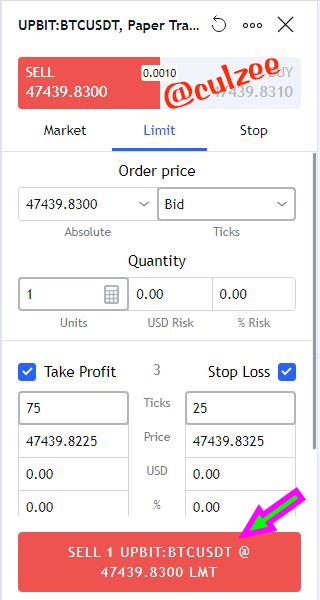
Screenshot from Tradingview.com
From the above screenshot I decided to sell my asset 47439.8300. I therefore placed my Take Profit at 47439 .8225 and Stop Loss at 47439.8325.
After that I placed my Sell Order . My order was successfully executed as you can see in the screenshot below.
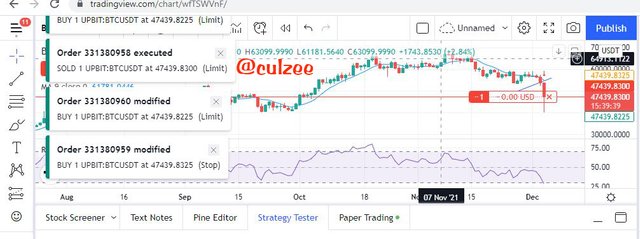
Screenshot from Tradingview.com
Conclusion
The importance of understanding trends in cryptocurrency market can never be overemphasized.
The reason is because for one to trade, you must first and foremost understand the market trend before how to enter the market and any other thing.
I have really learnt and gained a lot of experience in the previous class and in this week's lecture and the whole thing is becoming more clearer and easier for me.
I will never cease to appreciate our lecturer, Prof. @reminiscence01 who is always there to give us the best.
Thank you so much for the wonderful lecture and remain blessed.
Hello @culzee , I’m glad you participated in the 3rd week Season 5 of the Beginner’s class at the Steemit Crypto Academy. Your grades in this task are as follows:
Observation
This is not a clear example of divergence. You can revisit the lesson to get a clearer picture of how to spot divergence on the chart.
Recommendation / Feedback:
Thank you for participating in this homework task.