Trading Using Wedge Pattern - Crypto Academy / S5W5 - Homework Post for @sachin08


INTRODUCTION
Hello everyone,
In our last week, we were taught how to trade using rectangle pattern. This week our lecture is on trading using wedge pattern.
I believe the reason our lecturers focus more on different indicator patterns is because indicators are the backbone of cryptocurrency trading and their importance can not be overemphasized.
Good knowledge of different technical indicators is a great idea that can help us make good trading decisions in other to succeed as cryptocurrency traders.
I have carefully studied the lecture presented by our professor @sachin08 and understand the wedge pattern.
Now, let me present home work task.
1. Explain Wedge Pattern in your own word.

Wedge Pattern is a technical indicator formed by two converging trendlines that meet at an apex with upside and downside slant on a price chart. The upper trendline is known as Resistance Line, while the lower trendline is called Support Line.
See an illustration of the wedge chart pattern below.
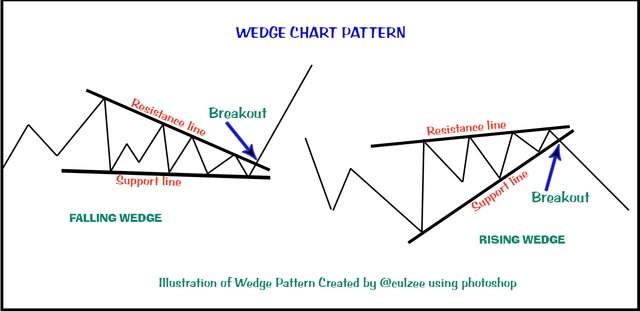
An illustration of wedge pattern created by me using photoshop
A wedge pattern shows a pause in the market and signals either a bullish or bearish price reversals.
As you can see from the above illustration, the wedge pattern has three major characteristics namely:
- Converging Trendline
- Decreasing Volume
- Trendline Breakout
When a wedge pattern is formed and there is a price reversal, traders can then make a trading decision to either buy crypto assets during a falling wedge or to sell assets during a rising wedge, depends on the breakout direction.
2. Explain both types of Wedges and How to identify them in detail. (Screenshots required)
In wedge pattern trading, we have two types of wedge:
- Falling Wedge
- Rising Wedge
Let me explain them one by one.
The Falling Wedge:
The falling Wedge is a bullish trend of a wedge pattern. When I looked at it first time, it looks like a bearish trend, so I thought our lecturer made a mistake, but when I tried to understand it, I discovered it is very correct.
You can recognize falling wedge when see the two converging trendlines forming a downward slopping triangular shape.
Below is a screenshot example.
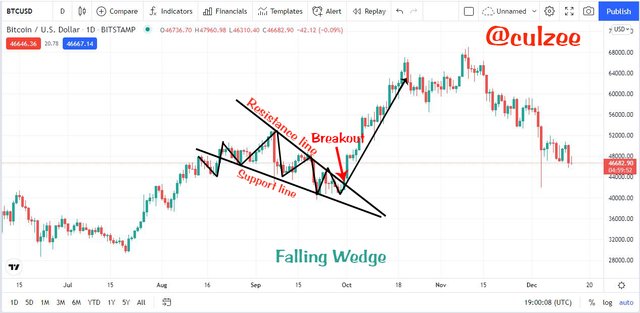
An illustration of falling wedge pattern/ screenshot from www.tradingview.com
When the price of crypto asset falls over a period of time, a wedge pattern occurs at the bottom of the downtrend and there will be a reversal. The price will change direction from downtrend to begin an uptrend.
In falling Wedge, when the two converging trendline are drawn, the consolidation part ends when the price action breaks through the resistance line and there will be a breakout leading to uptrend.
This indicates that the sellers who had been in control of the market are getting weak and buyers are taking over from the sellers pushing the price upward.
In the above screenshot, you will see in a BTCUSD chart that the sellers were pressing the price downward creating lower low and lower high formations.
You will also see that the two converging trendlines are forming a downward slopping triangular shape and that the volume is decreasing.
Now, observe that just before the two trendlines get closer to each other, the buyers took over the market and forced the price to break the resistance line and continues pushing the price higher to create new higher highs and higher lows.
Therefore, the falling wedge signals a possible price reversal and breakout leading to a bullish trend and this is an opportunity for traders to enter a buying position, because the asset will yield good profit as the price rises.
The Rising Wedge:
The Rising Wedge is a bearish trend of a wedge pattern. It also looks like a bullish trend when you look at it at first glance.
You can recognize rising wedge when the two trendlines get closer to each other and the sellers took over the market forcing the price to break the support line. Below is a screenshot example.
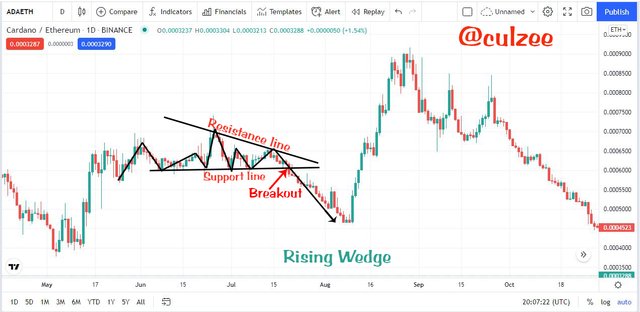
An illustration of rising wedge pattern/ screenshot from www.tradingview.com
When the price of crypto asset rises over a period of time, a wedge pattern occurs at the top of the uptrend and there will be a reversal. The price will change direction from uptrend to begin a downtrend.
In rising Wedge, when the two converging trendline are drawn, the consolidation part ends when the price action breaks through the support line and there will be a breakout leading to downtrend.
This indicates that the buyers who had been in control of the market are getting weak and sellers are taking over from them pushing the price downward.
In the above ADAETH chart screenshot, you will see that the buyers were pressing the price upward creating higher highs and higher lows.
You will also see that the two converging trendlines are forming a upward slopping triangular shape and that the volume is trending downward in the formation of Rising Wedge.
Now, observe that just before the two trendlines get closer to each other, the sellers took over the market and forced the price to break the support line and continues pushing the price lower to create new lower highs and lower lows.
Therefore, the rising wedge signals a possible price reversal and breakout leading to a bearish trend and this is an opportunity for traders to enter a selling position because the asset will yield good profit as the price continues to come down.
How to identify Falling Wedge and Rising Wedge
Just like the rectangle pattern, to get wedge pattern on a chart is not common and very easy. You will need to patiently burn some data before you can get it.
However, the following guidelines below can help you to identify the Falling Wedge and Rising Wedge pattern.
Falling Wedge
Below are four major characteristics you need to identify the Falling Wedge.
Two Downward Slopping Trendline:
The falling wedge is comprised of two downward slopping trendlines, the upper resistance trendline and the lower support trendline. These downward slopping trendlines converges as the price slide loses momentum and the buyers came in to slow the decline.Downward Volume Trend:
In falling wedge pattern, the price movement usually trends downward generating lower highs and lower lows.Multiple Touches:
To identify falling wedge, you must ensure that the higher highs and lower lows touch the resistance and support lines as least 5 times.
It could be 3 higher highs touching the resistance line and 2 lower lows touching the support line or 2 higher highs touching the resistance line and 3 lower lows touching the support line.Decreasing Volume:
One other feature of falling wedge is a decrease in the price action volume as the channel goes downtrend. The reason for this is because the sellers who have been in control of the market is losing strength and the buyers are getting ready to take over the market.
Rising Wedge
Below are four major characteristics you need to identify the Rising Wedge.
Two Upward Slopping Trendline:
The rising wedge is comprised of two upward slopping trendlines, the upper resistance trendline and the lower support trendline. The two upward slopping trendlines converges as the price slide loses momentum and the sellers came in to slow the trend.Upward Volume Trend:
In rising wedge pattern, the price movement trends upward creating higher highs and higher lows.Multiple Touches:
The rising wedge must have the higher highs and lower lows touching the resistance and support lines as least 5 times.
It could be 3 higher highs touching the resistance line and 2 lower lows touching the support line or 2 higher highs touching the resistance line and 3 lower lows touching the support line.Decreasing Volume:
Another characteristic of rising wedge is a decrease in the price action volume as the channel goes uptrend. This is because the buyers who have been controlling of the market is losing strength and sellers are getting ready to take over the market.
3. Do the breakout of these Wedge Patterns produce False Signals sometimes? If yes, then Explain how to filter out these False signals.
Wedge Patterns like every other technical indicators can produce fake signals. The reason is because no indicator is perfect and always give 100% accurate result.
This explains the reason cryptocurrency traders do not rely on only one indicator to make trading decisions.
Professional and experienced traders always confirm signals they get from any indicator with other indicator(s) before making decision to either buy or sell.
Based on this, the answer to the above question is yes. Wedge patterns breakout can produce false signals some times. This is because they are not perfect tools and can not be 100% accurate always.
In-fact, the major function of indicators is to give a predicting or forecasting signal, which is subject to confirmation before making final decision. They are not and can never be perfect and 100% reliable.
So, traders should not think that any indicator can give a perfect signal always and for that rely on one indicator 100% to make trading decisions.
Indicators are meant to give signal that traders can use to forecast market trend. Every trader is expected to confirm signal with at least one other indicator before entering a trade to invest their hard earn money. This will help to prevent huge loss.
How to filter false signals
To filter false signals from wedge pattern, traders should always confirm breakouts from wedge pattern with at least one other indicator before entering a trade.
Traders should not make the mistake of using wedge indicator as a standalone tool to make trading decisions.
Below is a screenshot chart example on how to filter false signal from wedge pattern.
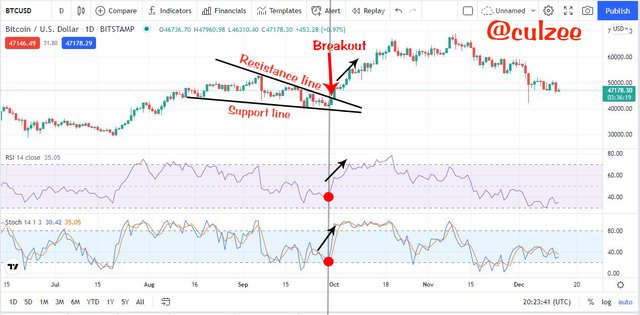
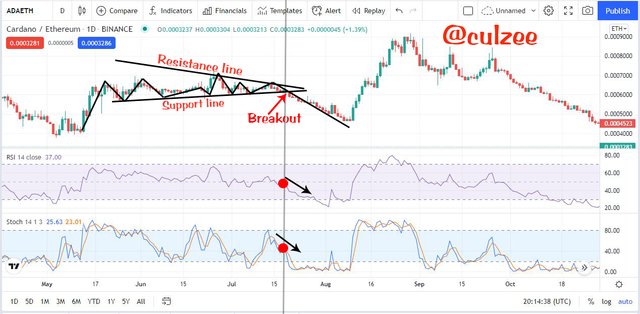
An illustration of how to filter false signal/ screenshot from www.tradingview.com
From the above screenshot, you can see that the falling wedge shows a breakout and a signal of a bullish trend. Before concluding whether the signal is fake or not, I used the Relative Strength Index (RSI) to confirm the signal.
As you can see in the screenshot, the Relative Strength Index (RSI) confirms that the signal is not fake. It show that there is a reversal at the I marked red and the market trend went bullish.
I also used stochastic oscillator indicator to check if there the fake-out in the falling wedge pattern. The stochastic oscillator also shows that there was a reversal at the point I marked red and it signals a price movement towards a bullish trend.
Therefore, the falling wedge breakout has been filtered and the signal a genuine and not fake. If it is a fake signal, one of the two indicators would have dictated it.
so, it is safe for a trader to enter a buying position because the trend will yield good profit as the price continues to go uptrend.
I also used the same measure to filter the rising wedge breakout. Below is the screenshot example.
An illustration of how to filter false signal/ screenshot from www.tradingview.com
4. Show full trade setup using this pattern for both types of Wedges.( Entry Point, Take Profit, Stop Loss, Breakout)
Rising Wedge Trading Setup
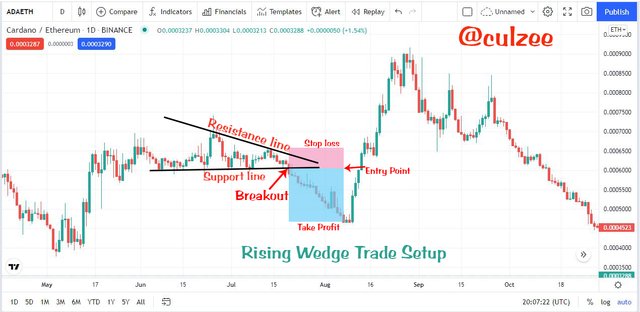
An illustration of rising wedge trade setup/ screenshot from www.tradingview.com
The above screenshot shows a Rising Wedge pattern on ADAETH chart. In the chart, you can see the two converging trendlines are forming an upward slopping triangular shape and that the volume is trending downward in the formation of Rising Wedge.
When the sellers took over the market and forced the price to break the support line, there was a breakout.
At the breakout point, I entered my Sell position and then set my Take Profit using 1:1 risk to reward ratio and finally placed my Stop Loss a little above the resistance line.
Falling Wedge Trading Setup:
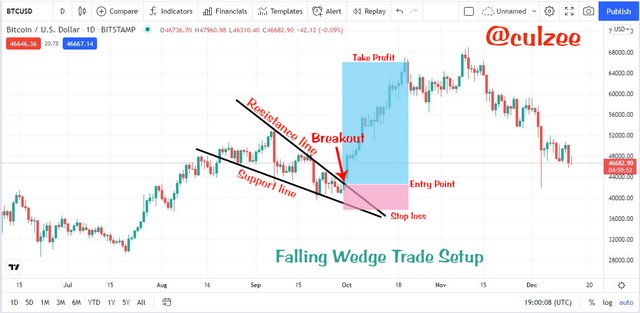
An illustration of falling wedge trade setup/ screenshot from www.tradingview.com
The above screenshot shows a Falling Wedge pattern on BTCUSD chart. In the chart, you can see that the two converging trendlines are drawn and the consolidation part ends when the price action breaks through the resistance line and there was a breakout leading to uptrend.
At the breakout point, I entered my Buy position and then set my Take Profit using 1:1 risk to reward ratio and finally placed my Stop Loss a little below the support line.
5. Conclusion
The success of a trader in cryptocurrency market depends largely on his or her ability to know and properly use technical indicators to forecast market trend.
A trader who knows how to use different indicators to identify market trend is of a greater advantage to make good trading decisions that will yield high profit.
This week's lecture teaches us another type of technical indicator, Wedge pattern and how to Trade using the Wedge Pattern. It was a wonderful class.
In this home work, I have explained in detail what a wedge pattern is, the different types of wedge pattern and how to identify them on a chart.
I have also mentioned that breakout of Wedge Patterns can sometime produce false signals and then explained with aid of charts how to filter out these False signals.
Finally, I showed a full trade setup of falling and rising wedges indicating Breakout point, Entry Point, Take Profit and Stop Loss.
It has been a wonderful lecture. I really appreciate our lecturer Professor @sachin08 for this awesome class. Thank you and more of God's blessings.
Cc: @sachin08