Reading Special Bar Combinations –Crypto Academy / S5W8 - Homework Post for @sachin08


Hello and happy New Year to everyone.
I want to first and foremost thank God, the Almighty who made it possible for us to see this great and prosperous new year.
This is a new beginning. A time to re-plan and re-strategise on the best way to move our cryptocurrency trading business to the next level.
Well, this week's lesson is interesting, I learnt a lot in this class. It was well presented by prof.@sachin08.
Here is my home work.

1- Explain Price Bars in your own words.

Price bar is a basic foundation of technical analysis. It defines price movement in cryptocurrency market for a specific period of time.
Price bar chart shows market sentiment using a price bar comprising of High, Low, Open and Close points. Below is an illustrative example I created with Photoshop.
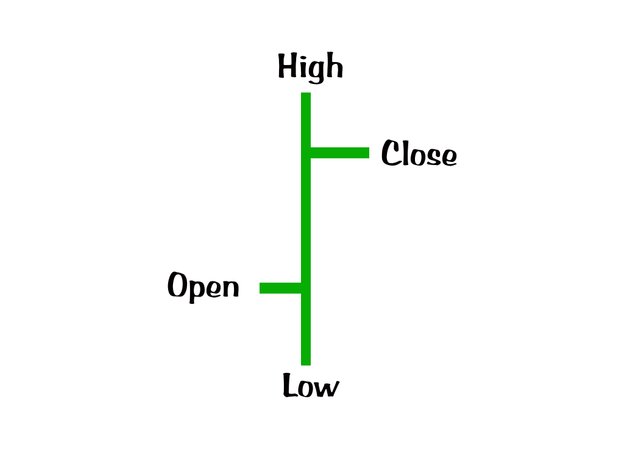
Illustration designed by me
As you can see from the above illustration, the vertical line on the price bar shows the highest and the lowest prices for a given time period. while the small horizontal line on the left shows the opening price and the small horizontal line on right shows the closing price.
When reading a price bar chart, if the price closes above the opening price point, the bar may be coloured black or green and when the price closes below the opening price, it may be coloured red. The reason for this is to enable traders to easily identify trends.
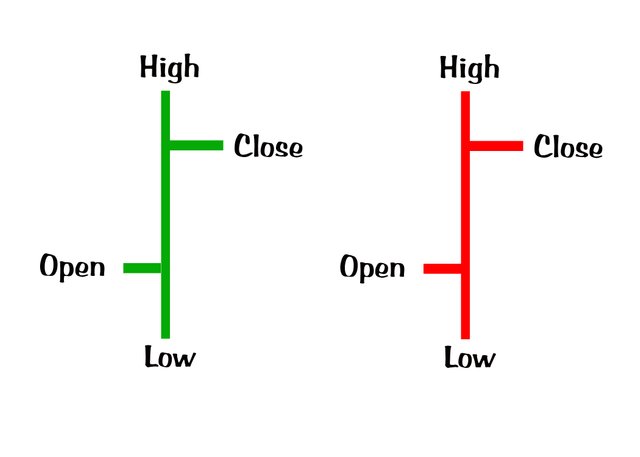
Illustration created by me
Price bars can be used to cover different periods of trading activities, it could be from one minute upto a month.
How to add price bars on Chart with proper screenshots?
To add price bar on chart simply follow these steps:
- Go to www.tradingview.com
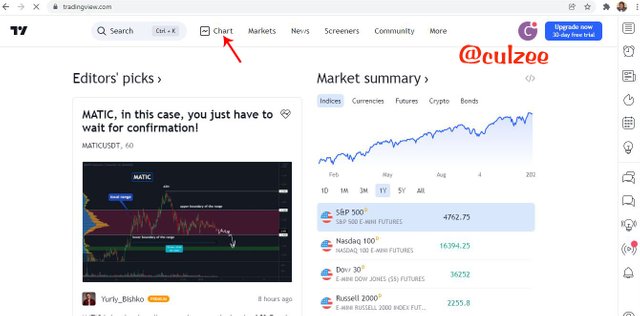
Screenshot from tradingview.com
- Click charts on the menu bar as you can see on the screenshot above.
- When the chart opens, locate Candle logo on the left side of the menu bar.
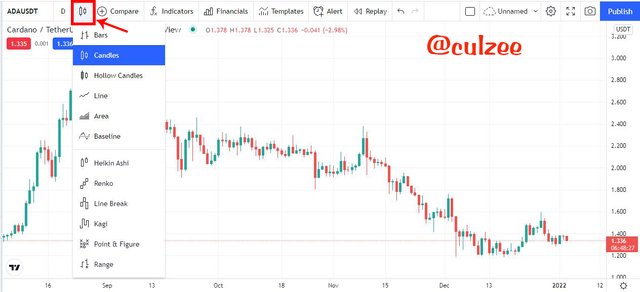
Screenshot from tradingview.com
- Then select and click on Bars and the bar chart will open.
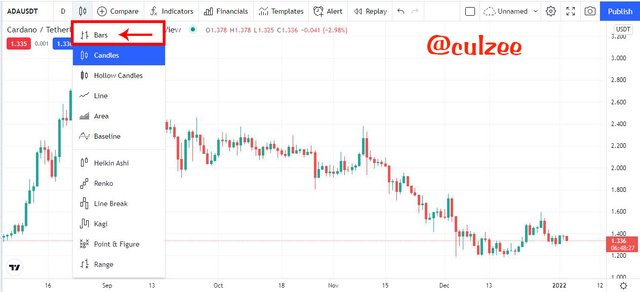
Screenshot from tradingview.com
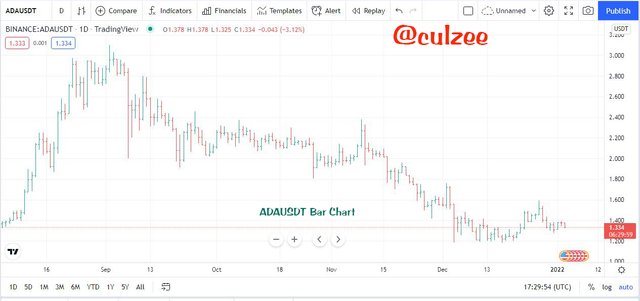
Screenshot from tradingview.com
2- How to identify trends using Price Bars. Explain for both trend. (Screenshots required)
For one to identify an uptrend or a downtrend using price bars, the trader need to be familiar with the following technical terms: Higher High, Higher Low, Lower High and Lower Low.
Higher High- This is a technical term in financial market that is used by traders and investors to describe when the Higher High of a particular day closed higher than the Higher High of the previous day. It gives a signal that the price of an asset is increasing or trending for higher price.
Higher Low- This is a technical term in financial market that is used by traders and investors to describe when the Higher Low of a particular day closed higher than the Higher Low of the previous day.
Lower High- This technical term in financial market is used to describe when the Lower High of a particular day closed lower than the Lower High of the previous day.
Lower Low- This technical term in financial market is used to describe when the Lower Low of a particular day closed lower than the Lower Low of the previous day.
Identification of an Uptrend
Now, to identify an uptrend using price bars, traders must ensure that there is a formation of higher highs and higher lows. This is the major Criteria for a bullish trend identification. The reason is because series of higher highs and higher lows indicate that the buyers or the bulls are dominating the market.
Screenshot from tradingview.com
In an uptrend identification, the higher high of today must close higher than the higher highs of yesterday or the previous day, and the higher lows must be higher than the higher low of the days before. In other words, the price must close higher than the opening price.
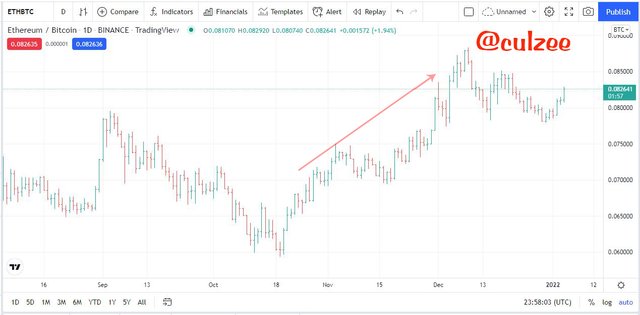
When you look at bar chart and see at least two or three higher highs with at least one or two higher lows, you will know that the bullish trend is valid. See an example below.
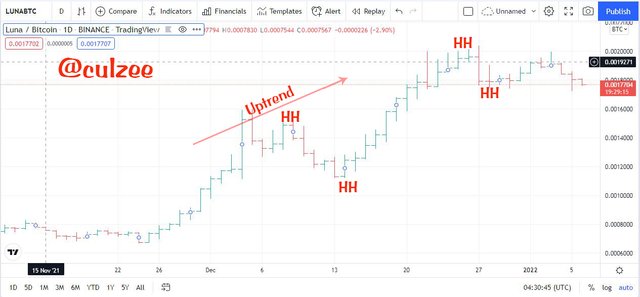
Screenshot from tradingview.com
From the above screenshot, you will see a formation of higher highs and higher lows. The higher high of each day closed higher than the higher high of the previous day, and the higher lows are higher than the higher lows of the days before. This shows that the bulls or the buyers are in control of the market.
However, it is important to note that we must not see fresh higher high everyday, but we must see the price closing higher than the opening price and the higher lows must be higher than the higher lows of the previous day.
Identification of a Downtrend
To identify a downtrend using price bars, traders must ensure that there is a formation of lower highs and lower lows. This is the major Criteria for a bearish trend identification. The reason is because series of lower highs and lower lows indicate that the sellers or the bears are dominating the market.
In a downtrend identification, the lower high of today must close lower than the lower high of yesterday or the previous day, and the lower low must be lower than the lower low of the day before.
In identification of a downtrend, the closing price must be lower than the opening price.
When you look at bar chart and see at least two or three lower highs with at least one or two lower lows, you will know that the bearish trend is valid. See an example below.
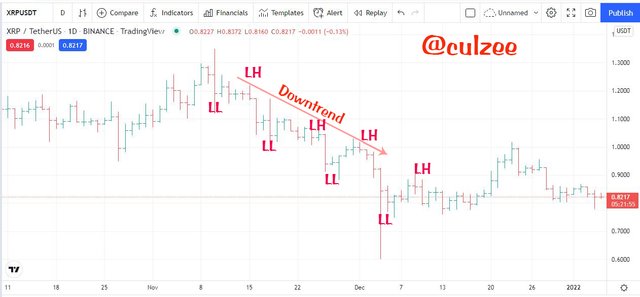
Screenshot from tradingview.com
From the above screenshot, you will see a formation of lower highs and lower lows. The lower highs of each day closed lower than the lower highs of the previous days, and the lower lows are lower than the lower lows of the days before. This shows that the bears or the sellers are in control of the market.
However, it is important to note that we must not see fresh lower high everyday, but we must see the price closing lower than the opening price and the lower low must be lower than the lower low of the previous day.
3- Explain the Bar Combinations for Spending the Day inside for both conditions. (Screenshots required)
Price bar charts contain numerous bar combinations with some special combination of bars that can be used to predict the future price movement.
The Bar Combinations for Spending the Day inside also known as inside bars means a price bar combination where the new formed high is lower than the high of the previous day and the new Low is higher than the low of the previous day bar. See below illustration for example.
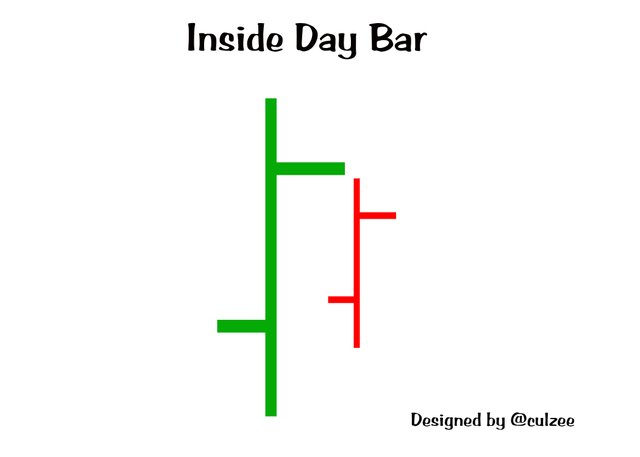
Illustration created by me
The Day inside is always in the middle of the mother bars or close to the high or low of the trend . Day inside is not determined by the bar's appearance. The most important thing about it is that it is within the high and low distance of the mother bar.
Spending the Day inside shows a short-term market sentiment indicating market indecision. What this means is that, at this point in time, the buyers are no more willing to buy more crypto asset and the sellers are not interested to sell their asset. They are all waiting to see the next market trend.
The inside bar is not telling traders that price will go up or that the price will come down, rather it implies that the price is waiting before making the next big move.
It is a reversal or price continuation bar formation that shows itself with only two price bars. It can occur in both the bullish and the bearish trends.
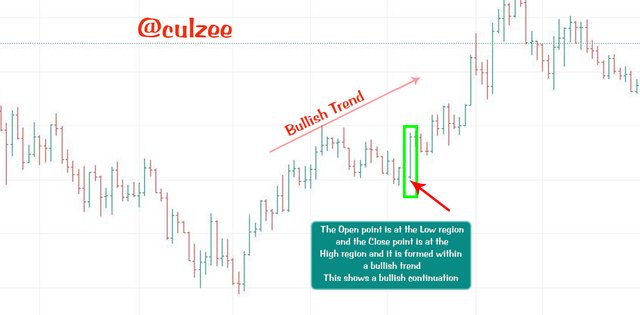
Bullish Day inside
For a bullish Spending day inside or inside bars trend, the new high must be lower than the high of the previous day and the Low higher than the previous day's low. What this means is that the new price bar forms its open at or higher than the low of the previous price bar and the close is below the high of the previous price bar.
For example, see below screenshot.
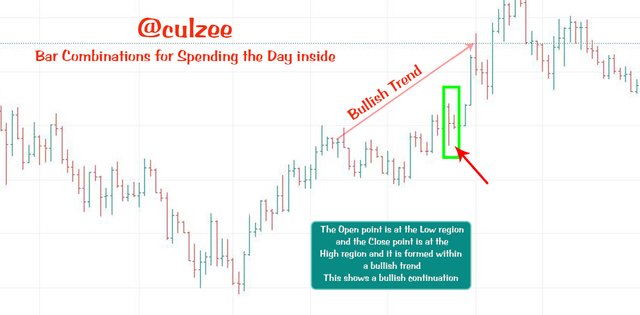
Screenshot from tradingview.com
From the above screenshot, you will see at the point I marked with small green vertical rectangle and a small red arrow that the new high is lower than the high of the previous day and the Low is higher than the low of the day before.
If you look at the screenshot critically, you will observe that the inside day was formed along the bullish trend. This show a bullish trend continuation after some period of indecision between the buyers and the sellers.
This bullish inside bar indicates that the bulls are defeating the bears in the struggle to control the market.
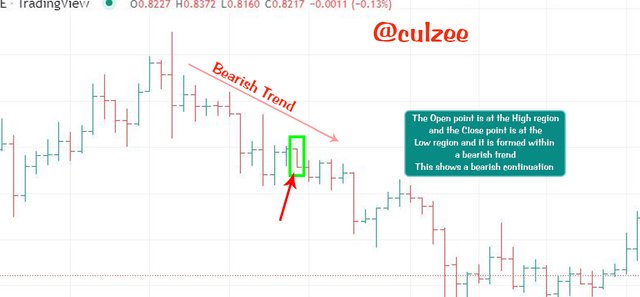
Bearish Day inside
For a bearish Spending day inside trend, the new low must be higher than the low of the previous bar and the new high must be lower than the high of the previous bar.
What this means is that the new price bar forms its open lower than the low of the previous price bar and the close bar is below the high of the previous price bar. See screenshot example below.
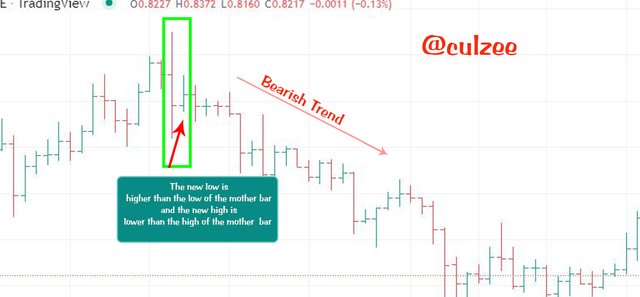
Screenshot from tradingview.com
From the above screenshot, you will see at the point I marked with small green vertical rectangle and a small red arrow that the new price bar opens lower than the low of the previous day price bar and closed below the high of the previous day price bar.
When you look at the screenshot closely, you will observe that the inside day was formed immediately after the peak of a bullish trend. This shows that the inside day bar formation is a price reversal move for a bearish trend, after a short time indecision between the buyers and the sellers.
This bearish inside bar signifies that the bears are defeating the bulls in the struggle to take over the market.
4- Explain the Bar Combinations for Getting outside for the Day for both conditions. (Screenshots required)
Getting outside for the day is a bar combination for spending the day which the high - low range shows outside the range of the previous bar. It's opening and closing point can be located anywhere outside the bar for the day, but the important criteria that is needed for it to be valid includes:
The Opening point must be at the Low region and the Closing point must be at the High region. This means that the sellers are becoming weak in the struggle with the buyers and the buyers are dominating the market.
The Opening point must be at the High region and the Closing point must be at the Low region. This implies that the buyers are losing out in the struggle with the sellers and the sellers are winning and have taken over the market from the buyers.
Getting outside for the day is another bar combination for spending the day pattern that indicates a price reversal or continuation of market trend.
Bullish Trend for Outside Day
In the bullish outside day trend, the opening point is always at the Low point and the closing is at the high. What this means is that as buyers continue to purchase an asset, the price of that asset will be going up from the Low point ascending to close at the high region.
For the bullish trend to be valid, the closing point of the day must be higher than the closing point of the previous day. See screenshot example.
Screenshot from tradingview.com
Bullish Trend for Outside Day
In the bearish outside day trend, the opening point is always at the High point and the closing is at the Low point. What this means is that as sellers continue to sell their asset, the price of that asset will be going downward from the High point descending to close at the Low region.
For the bearish trend to be valid, the closing point of the day should be lower than the closing point of the previous day.
Screenshot from tradingview.com
5- Explain the Bar Combinations for Finding the close at the open for both conditions in each trend. (Screenshots required)
Finding the close at the open refers to a bar combination where the closing price of the previous day is at the same point with the opening of today's bar. See below illustration I created for example.
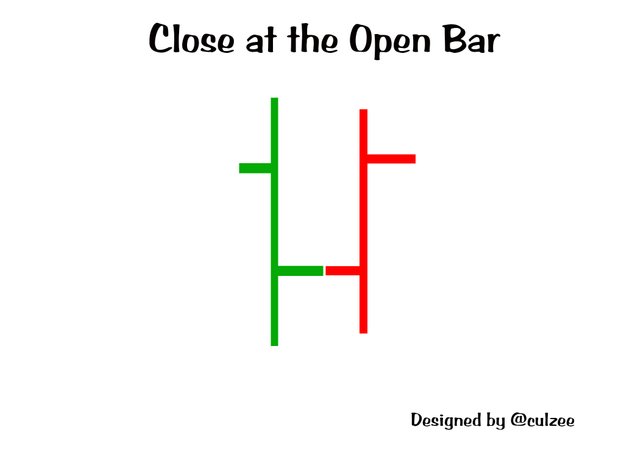
Illustration created by me
A closing bar at the open indicates a market condition where traders are not prepared to buy or sell a particular crypto asset at a particular point in time. They wait and monitor the market to know the next price action.
At this point, traders are expecting a clear signal to know if the price will reverse or will continue in it's original trend.
Now, when the price of the asset closes and opens at the same point or near the same price, traders can easily observe whether the market will be moving uptrend or downtrend, or if the price will reverse or will continue in it's original trend.
To identify whether the market will reverse or continue in it's original trend using bar combination for finding the close at the open, lets look at the bullish and bearish criteria:
For Uptrend:
Traders should carefully observe the opening and closing price region, if the opening and closing prices are close to the High point, there is a possibility that the price will continue in it's original direction.
If the open and close are at or near the Low point, the price will likely reverse. See below illustration.
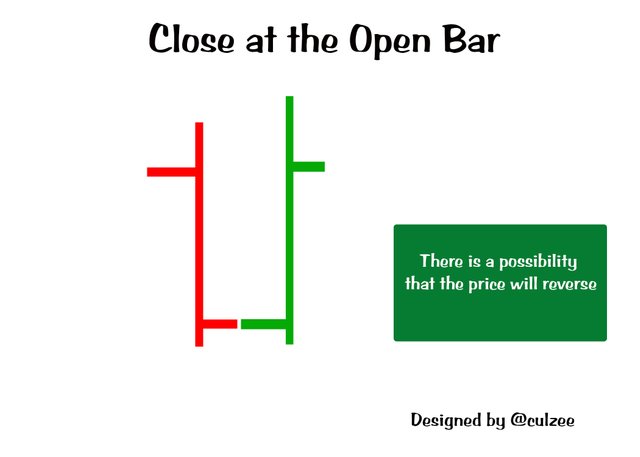
Illustration created by me
Below is a screenshot of close at the open chart.
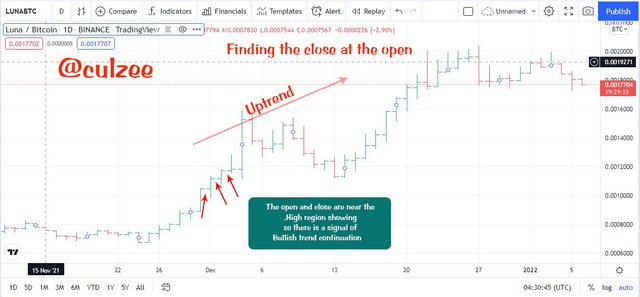
Screenshot from tradingview.com
For Downtrend:
If the open and close points are near the Low region, the downtrend is likely to continue, but if the open and close appear near the high point, then the price will likely reverse.
Below is a screenshot example.
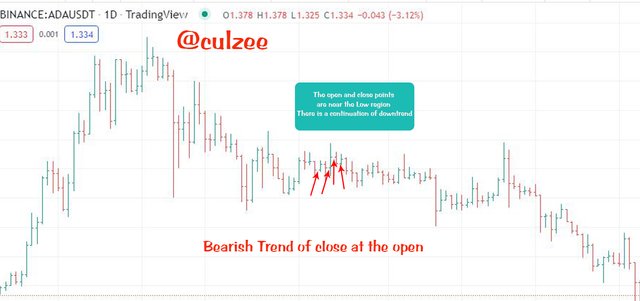
Screenshot from tradingview.com
CONCLUSION
It has been an exciting learning experience. The lecture and the home work are very much interesting, although not very easy for me to comprehend like our usual candlestick pattern. I have learnt a lot in this class.
I sincerely appreciate our lecturer, prof. @sachin08 for this wonderful lecture. Thank you and remain blessed.