Trading Strategy with VWAP Indicator - CryptoAcademy/S5W5 - Homework Post for @lenonmc21

Source
Hello there again fellow Steemians.👋👋👋👋👋👋👋👋
It's @cosai99 again with the next homework post for Steemit CryptoAcademy Season 5 Week 5, Dynamic Beginners' Course. For today's post, we are going to explore another trading strategy popular amongst crypto-investors. The last time we took a look at trading with the stochastic oscillator together with a 200-period simple moving average to determine trade entries into the market and determine the appropriate times to make a trade entry, either a sell or a buy. Today, we will talk of another one, quite simple if you ask me and appropriate for short-term trades, which is the Volume Weighted Average Price, VWAP. We will talk more of it in the task following. This lecture was facilitated by Prof. @lenonmc21.
Let's get started.

Overview of the Volume Weighted Average Price Indicator📈📉📊✔
In today's investment, we need strategies to maximize our profits no matter the trend the market takes. We need to understand what we are comfortable with and use the various technical indicators to formulate strategies that will suit our tastes. Hence, the uttermost need to get familiar with most of the tools. Also, we factor in the period in which our investment plan will remain active till we exit the trade, either being short-term or long-term investment. Most traders will normally trade in trending markets and hence sometimes will avoid those which are ranging. That is where our focus will be today, most especially when there are retracements. Today, we will look at the VWAP indicator and how it is used to make entries for buy and sell trade. We will take a look at various strategies revolving around the indicator and show some examples.
Example of VWAP
Let's get on with the task at hand then, shall we?

Theory
Explain and define in your own words what the “VWAP” indicator is and how it is calculated (Nothing taken from the internet)?
VWAP, or better still, Volume Weighted Average Price Indicator is one of the special technical indicators used by many investors to carry out trade analysis and make a decision. It is a price momentum indicator that depends greatly on the volume of the market at a specific price. It outlines the average price of crypto assets, relating to the volume of assets present in that period. This gives a fair idea of the price movements in the given period as the volume also fluctuates. It is taken daily, making it an intraday indicator. Any further and the VWAP becomes smoothened and inaccuracies arise. This is because VWAP is used for short-term trade analysis and picking a longer-term eliminates any subtle changes the market experiences.
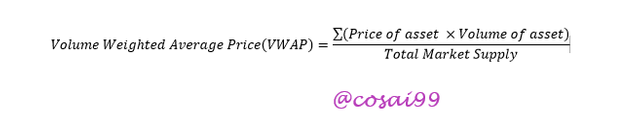
The VWAP is a formula that factors in the prices and volumes of the assets and uses such data to construct a line as we will see later. The formula is:
.png)
This is the formula used to construct the VWAP and as we can see it involves the volumes and the price. This property is Cumulative, meaning that it is a summation of the prices from 00:00 to 23:59 of the particular day so as a result, the value increases.
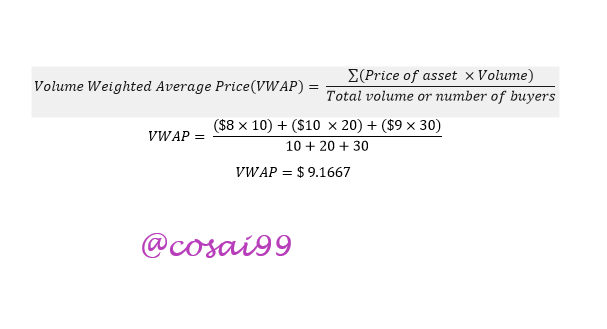
For example, if a stock has 10 people buying at $8, 20 people buying at $10, and 30 people buying at $9, then the VWAP can be calculated as:
.png)
This means that the person who bought at $10 made a loss since it bought above the average($9.1667) and those who bought at $8 and $9 made quite a bit of profit. The VWAP helped to determine who lost and who got a profit from the purchase of stock.
Adding the VWAP Indicator to the trend chart
We can add the VWAP indicator to our trend chart as the formula is inputted or programmed into the application and hence can construct the line without any difficulty, making trading stress-free.
Click on the "fx" button to view the indicators.
.png)
Source
Choose VWAP as your indicator.
.png)
Source
Uncheck the Upper band, Lower band, and Band Fill boxes. This is to allow only the average line to show and prevent any confusion
.png)
Source
We see the VWAP line as shown below
.png)
Source
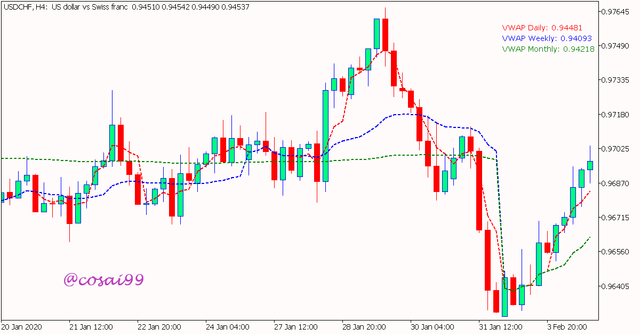
The VWAP enables investors to know how to control the price by seeing the deviation from the VWAP line and taking decisions to draw the price back to the average. This also allows the investors to anticipate a trend continuation.
We must take note that the VWAP line lags behind the price trend since the data is taken in the past, not the current data on the trend and hence an average is determined which is in line with the current trend.
Why VWAP is popular amongst traders?
This is because of two(2) reasons as I would like to believe.
- The first has to do with the fact that traders can easily identify the momentum of the price trend with ease, whether it is above it or below it. Since it is an average line, it gives a smoother curve compared to the price trend. This makes it easy to determine what trend the market is following, if above the VWAP then obviously note an Uptrend and vice versa, a Downtrend.
.png)
.png)
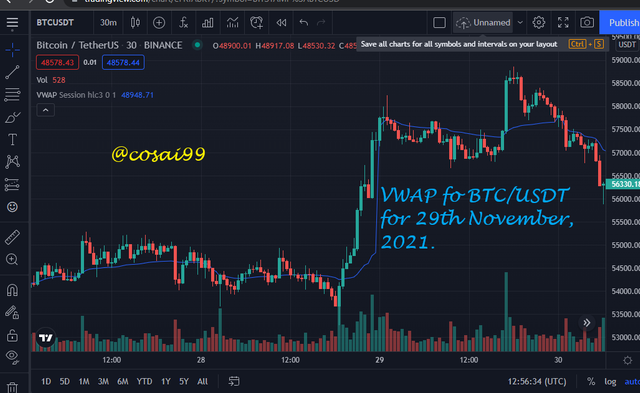
- It is also easy to determine if an asset is cheap or expensive on the market. This can help determine entry and exit points on the trend. When the highest peak with a high strength(meaning high volume), above the VWAP, their asset is deemed expensive and that would be a good time to sell an asset. Conversely, when the lowest peak with high strength(high market volume) is formed below the VWAP, their asset is deemed to have lost some value and hence regarded as cheap and makes a good time to buy the asset in stock.
.png)
Buy and Sell points indicating the value of BTC on the market as either cheap or expensive
This strategy is the VWAP breakout strategy.
Explain in your own words how the “Strategy with the VWAP indicator should be applied correctly (Show at least 2 examples of possible inputs with the indicator, only own charts)?
For the strategy to work efficiently, it must fulfill three(3) conditions, or else the trade will incur high losses.
(1) Confirmation of Breakout in the current trend
We need to wait for a breakout to occur in the current trend, a temporal reversal if you may. This strategy is used on retracements in the trend, so it won't work if a permanent or long trend reversal should occur; this will evidently make you incur huge losses on your investment. You need to look out for the swing high(in the case of bullish) or swing low(in the case of bearish) to anticipate a retracement in the trend. Additionally, we need to confirm a breakout of the price trend either above(bullish) or below(bearish) the VWAP. This attests the occurrence of the retracement in the trend.
.png)
.png)
(2) Confluence with the Fibonacci's Retracement
As we know, one indicator is not enough to confirm a market trend's status to make a decision. We would need another indicator to confirm our assertion to reduce any kind of inconveniences and raise our chances of success. In this case we would fall on the Fibonacci's Retracement Indicator. This indicator is used to confirm the possibility of a retracement, say pullbacks or rallies. Also, they are used to determine accurate entry points when investors want to trade a retracement. It is made up of several lines of which have percentage chance attached to them. It is optimal that the break in the VWAP falls between 38.2% and 61.8% to confirm the retracement. Any higher or lower than that will mean a trend reversal is about to occur, meaning a long run reversal and not a temporal one. We already know that the VWAP is used to trade retracement and that is a temporal reversal, hence we would not want out breakout to fall outside our range.
We have to first select the indicator from the left side pane.
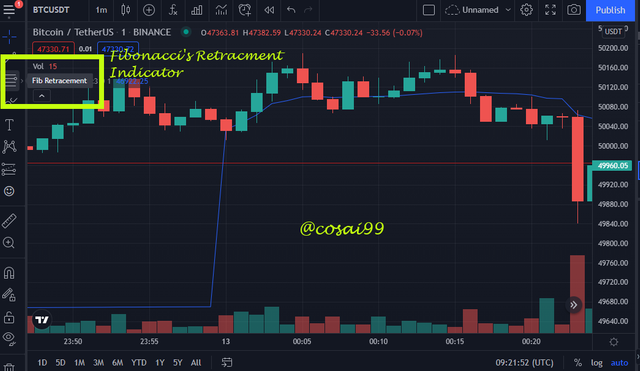.png)
Fibonacci's Retracement Indicator
We see that as we stretch from the last swing low to the swing high, lines with percentage chance come up, covering that area. This, we also see that the breakout point is within our range so we confirm our retracement.
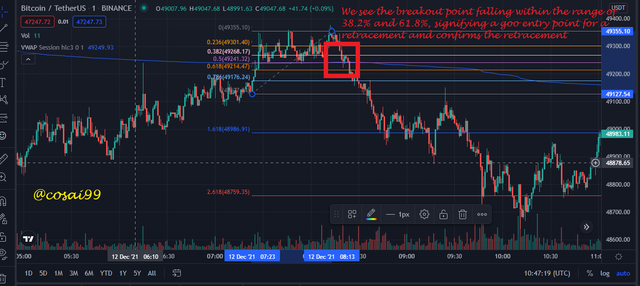.png)
Source
(3)Managing Trade risk appropriately
After confirming, we need to take our trade entry at the breakout point. We must note that there are rules to follow to manage our trade risk appropriate whiles maximizing our profits in the trade. Our Stop Loss should be a little above the 38.2% line. I would recommend the 161.8% line to maximize our Take Profit. We can do this easily with Fibonacci's Extensions and make our Take Profit at the 161.8% line or the 138.2% line, depending on where you took your Stop Loss at, or the lowest low in the trend. Just like below.
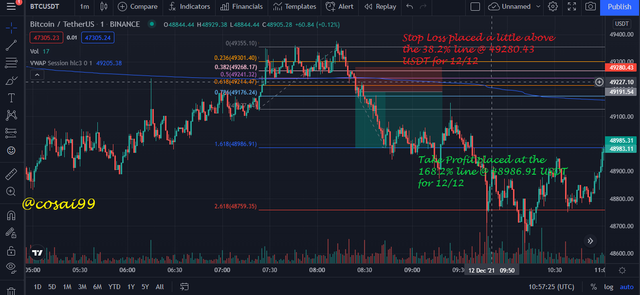.png)
Source
Above is the first example involving a BTC/USDT trade in the retracement.
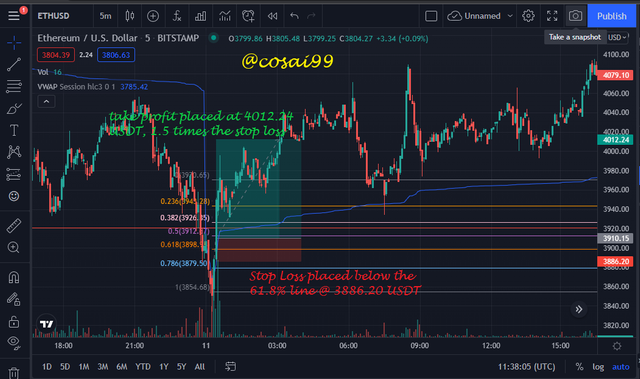
The second example has to do with ETH/USDT pair. As you see below, the breakout point was in the range of 38.2% and 61.8% and also crosses over the VWAP line, confirming two(2) of our conditions. There is also confluence with the Fibonacci's Retracement.
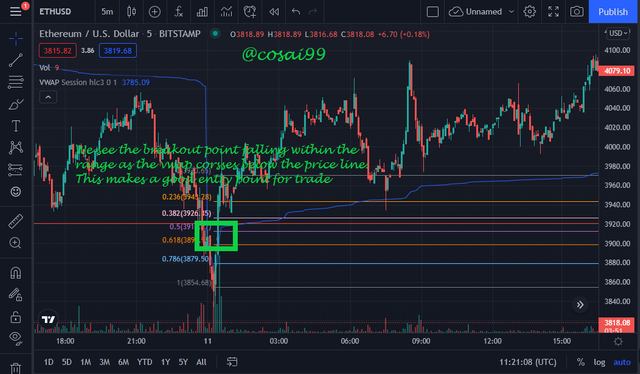.png)
Source
We can now enter the trade by taking our Take Profit and Stop Loss. We take profit at 161.8% line and take stop loss a little below the 61.8% line. This will enable us manage the trade risk efficiently and hence conforming to the third condition.
.png)
Source
Explain in detail the trade entry and exit criteria to take into account to correctly apply the strategy with the VWAP indicator?
To enter the trade and exit the trade in VWAP indicator strategy, we need to first confirm that the peaks that are formed after the breakout at the VWAP line exceeds the maximum(swing high) and minimum(swing low) peaks before the breakout. This is the first condition in the strategy, and this signals a retracement occurring in the trend. This occurance asserts the fact that the trend will continue and may not reverse. So, the next peak after the breakout has to overcome the maximum peak, in the case of a bullish trend, or minimum peak, in the case of a bearish trend. Just like below
.png)
.png)
After observing the confluence with the Fibonacci's Retracement Indicator, we can now determine our entry point at the candle after the breakout of the VWAP. This is to just further confirm your assertion. The entry point must be in the range of 38.2% and 61.8% so to confirm the occurance of a retracement. If the opposite happens, then this signals a trend reversal and our strategy will be null, making us search or wait for an opportunity for a confluence. Here, we take out entry.
For the exit, we need to take out Take Profit and our Stop Loss. It is recommended that the Take Profit be taken at 1.5 times the Stop Loss, or maximum twice the Stop Loss. The Stop Loss is also recommended to be taken at a little below the 61.8% line, just to manage the risk of loss. The take profit from this Stop Loss will be at the 161.8% line and hence trade can begin. When the trend crosses the Stop Loss, you take the initiative exit the trade to avoid any further losses.
NB: It is necessary all these conditions are followed to the letter or else we will be trading wrongly with the strategy and hence, will incur huge losses in our trade. All of them should be fulfilled before trading with this strategy.
Practice
Make 2 entries (One bullish and one bearish), using the strategy with the “VWAP” indicator. These entries must be made in a demo account, keep in mind that it is not enough just to place the images of the entry, you must place additional images to observe their development in order to be correctly evaluated.
Bullish Trend Entry
In this trend, we can take an entry point at the breakout. We tested the retracement with the Fibonacci's Retracement and observed that the point fell in the range of 38.2% and 61.8%, confirming the occurance of the retracement.
.png)
Source
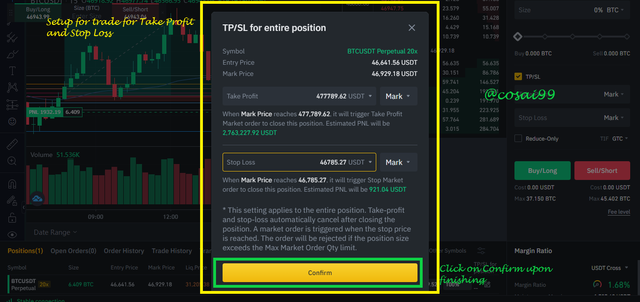
We have fulfilled two of the conditions of the strategy. Then we took the entry of the trade and try managing our risk. We took a Take Profit at 47789.62 USDT and the Stop Loss taken at 46785.27USDT. The Stop loss was a little below the 61.8% line and Take Profit, 1.5 times the Stop Loss. The risk was managed properly and hence, when the trade hits the stop loss value, the trade will exit automatically by the program as it was set like that. That makes the third condition fulfilled. The entry was made at the right pane for the Stop Limit Order for futures in Binance, as seen below.
.png)
Stop Limit Order
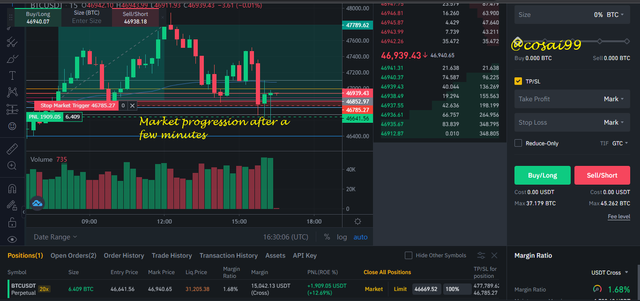
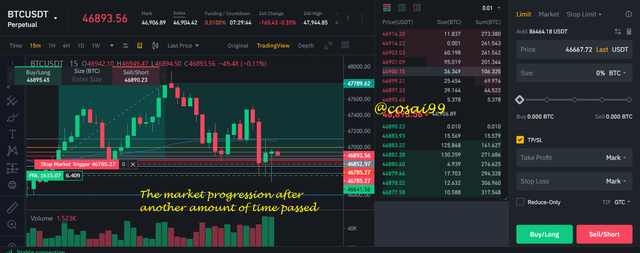
We worked in the 15mins timeframe and hence after a few minutes, the image below was observed in the market as the trend progresses.
.png)
Market Progression after a few minutes
We then waited a few more minutes to see how the market progress and we witnessed that it hit the stop loss and hence the trade exited the trade at the moment.
.png)
Exit of the trade
Bearish Trend Entry
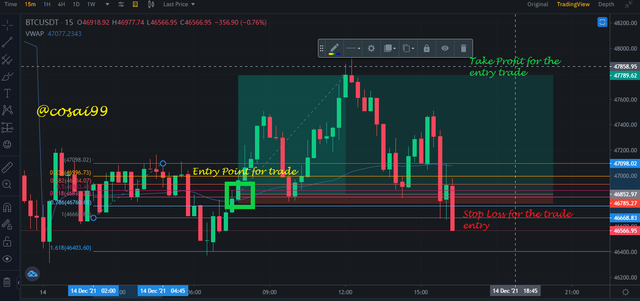
Also in the bearish trend here, we see that the entry point was in the range of 38.2% and 61.8% after testing the retracement with Fibonacci's Retracement. Hence we made an entry after the breakout, on the next candle.
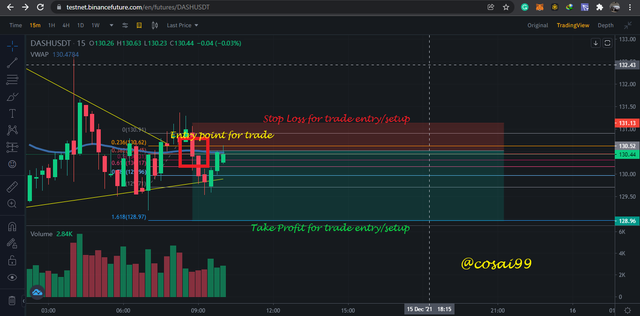.png)
Entry Point
We now try to manage the trade risk by placing a stop loss and Take profit, placing the Stop Loss above the 38.2%, and our Take Profit, 1.5 times the Stop Loss. We placed our Take Profit at a value of 128.96 USDT and our Stop Loss at 131.16 USDT. Using this management, when the trade hits the stop loss, our order will be cancelled automatically as augmented by the website settings and the profit taken.
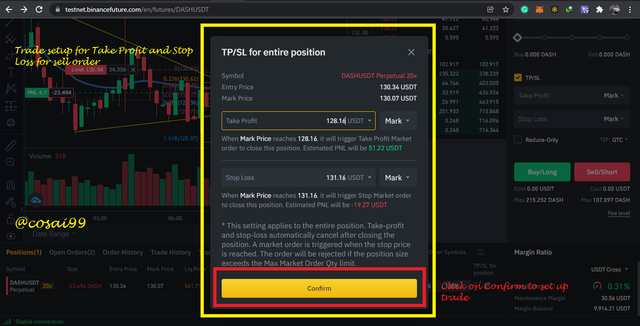.png)
Managing the risk of the trade
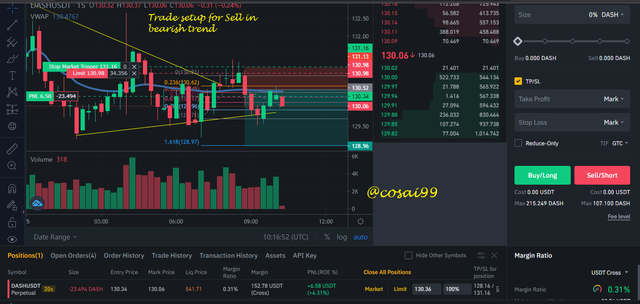.png)
Trade setup
After waiting for a few minutes, we notice our trade is progressing as we planned.
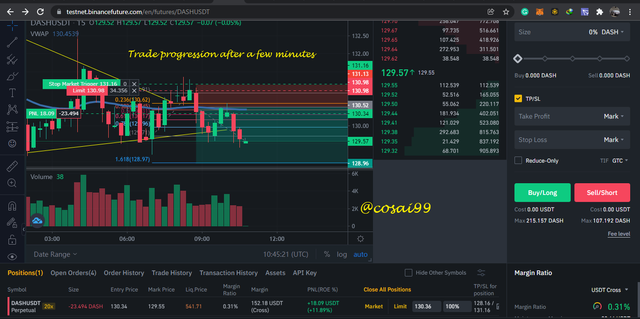.png)
Trade Progression after a few minutes
We also tested with the wedge pattern in the retracements.
Conclusion
Today, we have taken note of how the VWAP is used, its explanation and the strategy involving its usage. This can prove helpful to a lot of traders, especially beginners. It will take a lot of practice to master and believe me this is one of the key ways to success in trading crypto assets of forex in general.
Thank you for reading @lenonmc21🙏🙏🙏🙏🙏🙏🙏🙏🙏
Saludos @cosai99 vaya que interesante su aplicación a las criptomonedas.
Gracias Mi amigo👋👋👋👍