Candlestick Patterns- Steemit CryptoAcademy Season 5- Homework Post for Task 10
Hello again there.👋👋👋👋👋👋👋👋👋👋
It's @cosai99 with the last of the homework post for task 10 of Steemit CryptoAcademy Season 5, Introductory Course. Today, in the task we will talk about the basic techniques used in investment in the crypto-world. We all know crypto can be viewed as a business of trading assets when favorable. Knowing when to sell or buy assets can be a crucial factor in determining our success. Hence, we implore the Candlestick system in crypto. We will learn of its anatomy, patterns, psychology, and how to combine them to successfully decide a move in investing in crypto. This lecture is facilitated by @reminiscence01 and reviewed by @nane15 and @dilchamo.
Shall we start then?
Overview of Candlestick Pattern🖥💻📈📉📊💵💵💵
Let's take a moment to consider an event in real-time business investment.
We look at various factors before finally deciding to invest in a particular business. Such are the demand and supply of the product or services the business provides, the trend in profit the business makes, the margin of losses that may occur, the past and present condition of the business, amongst other factors that potential investors look at. This forms the basis of the interest of investors in various businesses.
The same applies to crypto since it can be viewed as a form of business, trading assets. This depends on the demand(buying) and supply(selling) of crypto in the market. Here, investors look at the trend following the buying and selling of crypto, who currently controls the price, the price at which is sold or bought, and the volumes of crypto available for trading. We then turn to rely on the Candlestick Pattern of crypto as the basis for deciding how to invest. This is also utilized in the global financial market for technical analysis since it is based on the Demand and Supply principle of financial asset management and stock market movement prediction.
Image Source
The Candlestick helps investors determine the market movement and help them predict a future trend and make a good investment decision.
Let's take a deeper look at what exactly it is.🏃♂️🌫🌫🌫🌫

QUESTION 1
Explain the Japanese candlestick chart? (Original screenshot required).
In the 18th Century, a simple rice merchant from Sakata, Japan introduced a system of accounting for market trends on rice and how the market responded to its price, based on the principle of Demand and Supply. This was in Osaka in the Ojima rice market, during the Tokugawa Shogunate, same as the Edo Period between 1603 and 1868. His name was Muhenisa Homma. He studied the market responses to the trade of the rice he sold and derived a system of noting down these trends. He called it the Japanese Candlestick. He established a theory of predicting the future price of rice, based on his observation of market trends and hence was very successful as a businessman. He made a basis that they resemble the rotation of the Yang-Yin Circle(signifying what was later described as Demand and Supply of the market) and how they are interrelated, just like the psychology behind the Yang-Yin circle. This must be noted that psychology is fundamentally based on the demand and supply of crypto assets in the market and the investors' sentiment towards the crypto market.
The Japanese Candlestick is a representation of the price movement of crypto for a given period. It shows the various trends in investment in crypto assets, either investing are buying more or selling more, determining the price of crypto. As I said before, this is based on the demand and supply of crypto and here, and this is reflected in the candlestick graph. This conveys information to traders and this helps them decide on investing in crypto. The Japanese candlestick also conveys the state of the market, whether bull or bear market. Let's describe it in detail.
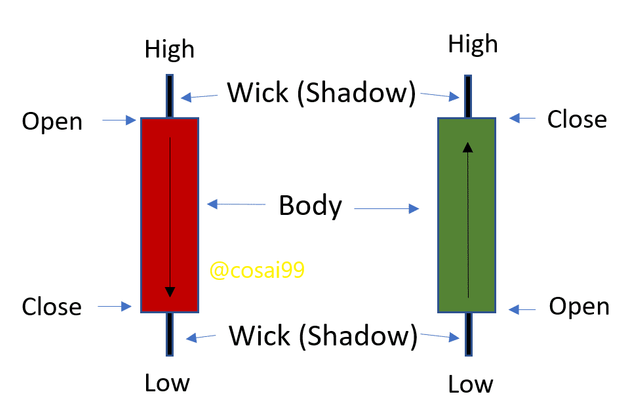
Anatomy of the Candlestick
The candlestick resembles a candle with wicks at both ends. The candlestick is made up of two(2) main parts, the Real body and the Shadow. The real body represents the price movements of crypto within a certain period. This price movement is between the open and close prices of the crypto. For clarity, different colors are used to represent a bullish crypto market and a bearish crypto market. The real body also communicates the volume of crypto available at that set time. The shadow illustrates the unsettled movements of prices of the crypto asset. It is between the highest and lowest prices. This shows the struggle for control of prices between bullish investors(buyers) and bearish investors(sellers). Concerning prices indication, there are four(4) parts on the candlestick namely High, Low, Open and Close prices. Let me explain each of them.
Source
High Price
The high price indicated the highest price either bought or sold on the crypto market within a certain frame of time. This is indicated by the top end of the wick of the candlestick.
Low Price
The low price is the converse of the high price. It is the lowest price either bought or sold on the crypto market within a certain frame of time. It is indicated by the low end of the wick of the candlestick.
Open Price
This is the start of the price movements on the market. It indicates the first price recorded on the market at a specific time frame. It is indicated in opposite places depending on if it is a bullish trend or a bearish market trend. It is a the bottom of the candlestick if a bullish trend is taking place because, for a bullish trend, profit on crypto start to rise and hence starts at the lowest price(i.e. the lowest profit recorded) on the crypto market. It is at the top of the candlestick if the market experiences a bearish trend because here, the profit on crypto starts to dwindle. So, the highest price on the bearish market is the opening price of the bearish market.
Close Price
This is opposed to the closing price of the movements in the market. It indicates the last price recorded on the market at a specific time frame. Just like the open price, it is indicated in different places on the candlestick depending on what kind of market the crypto asset is experiencing. It is at the top end of the candlestick if it is a bullish trend in the market. This is because the closing price of the bullish market trend is the highest price in the price movement recorded. Conversely, it is at the lowest part of the candlestick body if a bearish trend occurs because the bearish closing price records the lowest price in the price movements as profits on trading or investing in crypto dwindles
Candlestick Patterns and their Psychology
The Engulfing Candlestick Pattern
This candlestick pattern is made the preceding candlestick is bigger than the previous one. Let's take a look at the pattern in a bullish and bearish market trend.
- Bullish engulfing candlestick pattern
Here, the green candlestick opens at a lower price and closes at a much higher price than the previous day's bearish candlestick. Thus, it completely "engulfs" or covers the previous bearish candlestick. The wick of the engulfing bullish candlestick is closer to the real body meaning that the closing price is close to the highest price recorded during the day. The investor must expect 2 more bullish candlesticks to occur before confirming a bullish pattern in the market and investing. If this doesn't happen, we can't guarantee a bullish pattern. This can also be referred to as a Downtrend Reversal, where downtrend means supply exceeds demand for the crypto, and investors would sell at a lower price. Investors consider the two candlesticks to confirm an engulfing pattern.
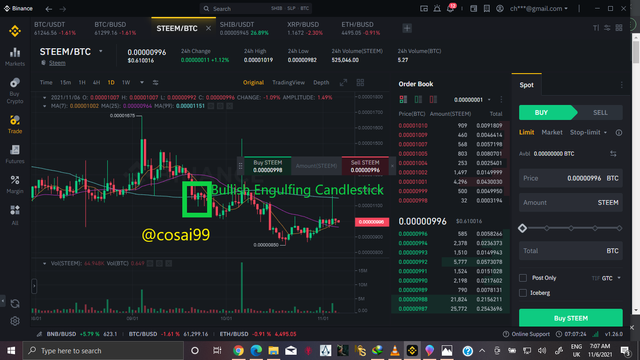
Engulfing Bullish Candlestick
- Bearish engulfing candlestick pattern
Here, the red candlestick closes at a lower and opens at a higher price than the previous day's bullish candlestick. Hence, it engulfs the previous bullish candlestick. This usually indicates an Uptrend Reversal, where uptrend is the situation where demand far exceeds supply and investors buy at a higher price, maximizing profits in the market. Just like the bullish engulfing pattern, investors must wait for more candlesticks to form to confirm and invest in such a situation.
.png)
Engulfing Bearish Candlestick
Psychology
The psychology behind the engulfing candlestick pattern is that investors tell who is in control of the price of the crypto and also tell the occurrence of a trend reversal. In the case of the bullish engulfing candlestick pattern, it means that previously, bearish investors were selling more crypto at a price then over time bullish investors bought more at a much higher price than the bearish investors and hence have taken control of the crypto market. This is conversely true for the bearish engulfing candlestick pattern, i.e., bearish investors or sellers have taken control of the crypto market. The large candlestick represents a large market volume in each case and signifies a stronger reversal as such.
Hammer Candlestick pattern
This candlestick resembles a hammer. Here, the real body of the candlestick is pushed at the extreme top or low ends of the wick. This forms when the real body opens and closes at the same price, either high or low. In regards to closing at the high, it signifies an uptrend reversal. Here, in the beginning, sellers tend to capitulate their assets, meaning selling the crypto when they perceive a decline in the price of the asset to consolidate their position in the crypto market hence liquifying the crypto, then buyers raise the price up by buying at a much higher price than the closing price of the crypto during the previous day. It must be noted that this occurs during a price decline of the crypto asset. This increases the buying pressure on the crypto and as a result, the price of the crypto. Together with the formation of the declining candles after the hammer, which is a candle with a close higher and an open lower than the previous hammer formed, and the price increase, this signifies a price reversal and hence confirms the hammer pattern. This shows that the buyer is now in control of the price of the assets or that there has been a downtrend reversal.
The inverted hammer has the real body forming at the lower end of the wick and signifies an uptrend reversal or the sellers have now the price of the crypto in their control. All we said about the hammer pattern is conversely true for the inverted hammer.
The hammer candlestick has the wick 2/3 times as long as the real body.
.png)
Hammer And Inverted Hammer candlestick
Psychology
The psychology behind this is that there is a price reversal in either trend(a downtrend reversal in the hammer indicating a bullish market, and an uptrend reversal in the inverted hammer indicating a bearish market). This also signifies who is in control of the price of the crypto asset.
Doji Candlestick Pattern
Here, the candlestick resembles a line crossing the wick. This means it has the crypto opening and closing at the same price. In Japanese, doji means blunder or mistake signifying the rarity of having the price of crypto opening and closing at the same price. Let's look at the various Doji candlestick patterns we can observe in the market.
Dragonfly Doji
This is where the opening and closing prices of crypto are exactly at the higher end of the wick. This means that sellers were controlling the price and there is pressure on them by the buyers hence there is a chance of a reversal in the downtrend. Hence, analysts can use this to interpret a possibility of a price reversal(in this case, an increase) or a continuation of the current trend, depending on the candle that forms next.Gravestone Doji
This occurs when the opening and closing prices of crypto are exactly at the lower end of the wick. This connotes the fact that buyers were controlling the price and there is pressure on them by the sellers hence there is a chance of a reversal in the uptrend. Here, analysts and investors can deduce that a possibility of a price reversal(here in this situation, a decrease) can't be ignored or a continuation of the current trend, depending on the candles that form next.Long-legged Doji
This occurs when the opening and closing prices of crypto are exactly in the mid-point of the wick. This means that the buyers and sellers are both exerting equivalent pressure on each other and hence are unable to gain control of the price. This indicates the indecisiveness of either party to affect the trend of the crypto market.
.png)
Drafonfly Doji and Gravestone Doji
Psychology
This indicates a possible trend reversal in each case or even a continuation. Investors are recommended to wait for the next candles to form before deciding as this indicates an indecisiveness in the crypto-trade market.
Harami Candlestick Pattern
This candlestick is one of the unique candlesticks investors look out for. It forms at specific areas on the graph and indicates a possible change or continuation. The word harami is the Japanese word for pregnant, as it resembles a pregnant person. The harami candlestick is made of two(2) candlesticks, the previous Pregnant Candlestick and the following Trailing Candlestick, i.e. a bigger one which is the previous pregnant candlestick and a smaller one following which is the trailing candlestick. Let's take a look at such a pattern in bull and bear markets.
- Bullish Harami
In this instance, there is a red pregnant candlestick which is followed by a green trailing candlestick. This happens after a sell rally and also at the price support area, which is the beginning of an uptrend. Here, prices start to spike as demand for the crypto increases and buyers' sentiment towards the crypto asset grows. Here, it can indicate a possible price reversal as the struggle for control persists and may be in favor of the buyers. It must be noted that the bullish harami doesn't always indicate a reversal but then maybe a trend continuation. Let's consider the image below
.png)
Bullish Harami
- Bearish Harami
Here, there is a green pregnant candlestick which is followed by a red trailing candlestick. This normally would happen after a buying rally and at the price resistance area, which is the beginning of a downtrend. Here, prices of crypto assets start to decline as supply far exceeds the demands, and investors start to capitulate at this instance. They start to sell their crypto more than there are available buyers and hence reduce the prices of crypto assets, just to consolidate their positions in the market. As a result, they tend to provide a possibility of a trend reversal.
.png)
Bearish Harami
Psychology
The harami communicates a reversal possibility in the crypto market to investors. It occurs at specific areas in the graph, which are the support area and the resistant areas. The bullish harami is formed at the support area and might communicate a reversal in the price decline in the bear market. If the next candlestick form is in favor of the bull market, it confirms a reversal, and then bull investors can start buying crypto. The opposite is true for the bearish harami, and it occurs at the resistance area. The support and resistance here are in referral to the price movements in the market and the value it places on the crypto asset. There is also a possibility of trend continuation and it is not always a reversal so investors should be mindful and rather combine this with other technical analysis elements. The truth about harami candlestick patterns is that it rarely forms on the market.
Morning and Evening Star Candlestick Pattern
These candlestick patterns are also important in deciding a move in the investing of crypto assets. These are Morning and Evening Candlestick patterns. They usually involve 3 candlesticks to confirm. Let's delve deep into what these two mean.
Morning Star Candlestick Pattern
This candlestick indicates a current trend reversal in the market. It implies a trend reversal to the bullish market. It is made up of three candlesticks. Here, a strong bearish candlestick is first and it is then followed by a Doji candle. Here, it means that the bear investors were in control of the price of crypto assets with a reasonably high market volume then after a while, they started to lose control and show some sort of weakness. The struggle between buyers and sellers put an indecisive front on the market. This is then followed by an engulfing bullish candlestick. This implies that the bull investors were able to rally control from the bear investors and are now in control of the price of crypto. Also, it starts with a downtrend and ends with an uptrend, and occurs at the price resistance area to effect a price rise.
Evening Star Candlestick Pattern
This pattern is opposed to that of the Morning star pattern. It implies a trend reversal to the bearish market. It is made up of three(3) candlesticks as well. In this instance, a strong bullish candlestick is formed and then followed up by a Doji candlestick. This means that on the 1st day, the bull investors were in control of the price of the crypto asset and also in high volume. But then the pressure from the bear investors grew on the bull investors and set the market in an indecisive state, unable to determine who is in control. This is then followed by an engulfing bearish candlestick. This means the bear investors were able to rally control from the bull investors and are now in control of the price. Also, in contrast to the morning star pattern, it starts with an uptrend and ends with a downtrend, at the support area, and this means the price starts to decline.
.png)
Morning and Evening Star Candlestick Patterns
It must be noted that the volume of the market should be looked out for when using this strategy to invest for confirmation of a trend reversal.
In your own words, explain why the Japanese Candlestick chart is the most used in the financial market.
The Japanese Candlestick pattern is very useful to investors. It forms the fundamental principle in understanding various trends in the crypto market and how to use them to make good decisions when it comes to investment. It is used by traders to know the current trend of the market and also make a forecast of how the trend may be in a certain period. This will help them also make preparations for the future to minimize losses. Since each market also communicates the sentiments of investors of crypto assets, it can give a fair idea of how much value is placed on the crypto asset. But then, the candlestick alone isn't enough to make a very good analysis or strategy. You need to combine them with certain indicators to form a good trading strategy. These can be the RSI regions, break-retest-break strategy, support and resistance areas, trendlines, and others. Let's take a look at them.
RSI or Relative Strength Indicator, is used to identify the overbought and oversold regions. The overbought region is where the price of the asset is way above its actual value and this can be due to extreme buying pressure. This is in the favor of the bullish market, and in this case, may be over what investors considered. This suggests a correction, say, an equilibrium change must occur. The opposite is true for the oversold region, favoring the bearish market, where the price declines way below the expected value of the price. This can be calculated using the price-earning ratio. This is the RSI, if above 70 then the asset is overbought, if is below 30, then it is oversold. Traders will normally expect a reversal for correction.
Moving Average Convergence Divergence, MACD, is used to determine trend continuity. It is calculated over a 26-period exponential moving average(EMA) from the 12-period EMA, the weighed average due to the price movements. This is used to create a signal line and then the MACD line is done due to the price fluctuations. The market can be determined as overbought or oversold. If the 26-period is above the 12-period(signal line) EMA, then the market is overbought, if below, then oversold. This is different from the RSI since RSI is done over 14 days. The MACD also determines the continuity of such a market, whether overbought or oversold for the 26 days. This can signal a false positive indication when there may be none and that is the limitation associated with this indicator.
Average Directional Index, ADX, determines the strength of a trend, whether long or short that is to say, designed by Welles Wilder. Here, two(2) indicators are needed, Positive and Negative Directional Indicators(+DI and -DI). Non-trending means that there is no price movement. This has to be calculated. Here again, if the +DI crosses over the -DI and ADX are above 20 or 25, then this signals a long bullish market or a potential buy position. If the converse happens and ADX is below 20, then it signals a market, a short one to that. If the +DI crosses over the -DI and ADX is below 20, then it signals a short market.
Describe a bullish and bearish candle. Also, explain its anatomy. (Original screenshot required)
The terms "bull" and "bear" used in markets are used to describe price movements in the stock market and this case, the crypto asset market. This is used in how the bull and bear attack. The bull moves its horns in an upward movement and the bear slashes its claws downwards in attacking. About this, the bull market is when the price of crypto assets skyrockets or plummets upwards meaning that the buyers here are contributing more to determining the price. In the bear market, the price declines due to supply exceeding the demand, and hence sellers would control the price by engaging in capitulation. Let's explain concerning the candlestick.
In the bull candle, the opening price is at the low end of the real body and the closing price is at the top end of the real body. It is usually a hollow or green-colored body. The positions of the open and close are because the bid starts at a low price and gradually increases to a high price and at the end of the day, closes at a price higher than its opening price. Because in the bull market, demand exceeds supply, and hence so does the price.
In the bear market, the opening price is the top end of the real body and the closing price is at the low end of the real body. It is usually a black or red-colored body. The positions of the open and close are due to the fact
the asks start at a high price and slowly decline to a lower price than the opening price to attract buyers. This is because supply far exceeds the demand and investors need to lower the prices to attract buyers to sell to, that is during capitulation.
.png)
Source
Conclusion
Today, we learned about the candlestick pattern in-depth, its anatomy, psychologies, and how to apply them. we learned their use in investment and some other tools we can use in conjunction with the patterns to make a good decision in investments. We can safely say we have an idea of how to look at trends in the candlestick charts and know what they communicate.
I would like to thank all the lecturers for educating me in the Introductory Course and the professors reviewing the course.
Thank you for reading @reminiscence01, @nane15, @dilchamo🙏🙏🙏🙏🙏🙏🙏
