Steemit Crypto Academy Season 6 Week 2 - Trading with Double Top and Wedges.
Hello everyone and a warm welcome to steemit crypto academy season 6 week 2
1.) Explain in your own words the concept of Double Top, Double Bottom and Wedges. How to interpret each one?
2.) Main differences between the Double Top and the Double Bottom. Show screenshots.
3.) Explain and highlight the main differences between a bullish wedge and a bearish wedge. Show screenshots of each.
4.) Explain the volatility that usually exists with respect to the volume in the wedges. When is there usually more volume? What happens if a pullback breaks the support of a wedge?
5.) Find and analyze the double top pattern on at least 2 charts. Show your own screenshots.
6.) Find and analyze at least 2 rising wedges and 2 falling wedges on at least 2 charts. Show your own screenshots.
7.) Importance of patterns in technical trading.
8.) Do you find it effective to use these patterns in trading? Justify your answer.
9.) Conclusion

QUESTION 1
Explain in your own words the concept of Double Top, Double Bottom, and Wedge. How to interpret each one?
DOUBLE TOPS
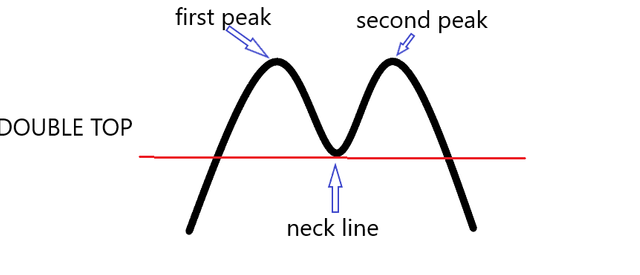
Double top is a bearish technical analysis reversal pattern, this pattern is often perceived at the end of a bullish trend in the shape of an M as seen pictorially below. The M-shaped double top pattern is perceived by traders to be a reversal pattern dictating entry points, Double top is a bearish technical analysis reversal pattern, this pattern is often perceived at the end of a bullish trend in the shape of an M as seen pictorially below. The M shaped double top pattern is perceived by traders to be a reversal pattern dictating entry points
A double top is only confirmed if the initial entry was made from a bearish trend and reacting with a neckline in a retracement to reverse back and form a second peak then a breakthrough beneath the neckline. A double top can be confirmed if all these conditions are met
[Editedwith3dpaints]
DOUBLE TOPS
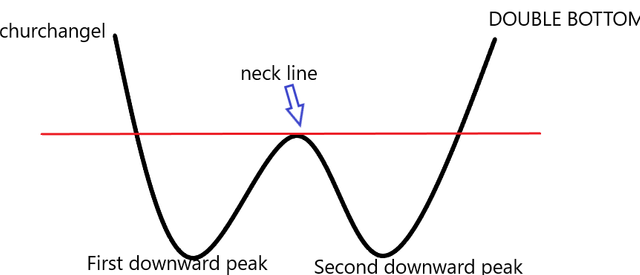
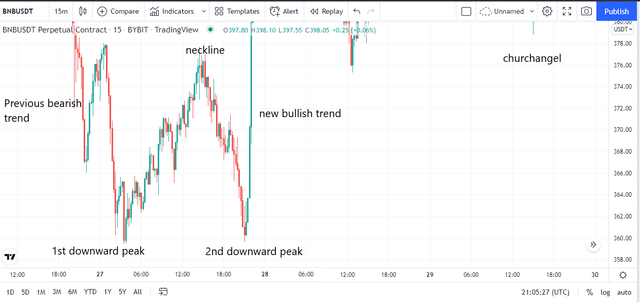
The double bottom is also a technical analysis reversal pattern, as the name implies this pattern is seen W in shape and it is mostly perceived in a downtrend, the double bottom is often perceived to be an end of downtrend and traders in this phase are often looking to go into the trade in a long position
DOUBLE BOTTOM
The double bottom is formed when a price action from a bullish trend forms a first peak (in the downward direction in this case) and retraces back to a certain height in a bullish direction known as a neckline then retraces back to form a second peak in a bearish direction after which the price action moves for a short or long term period in the bullish direction to complete a trend reversal
[Editedwith3dpaints]
WEDGE
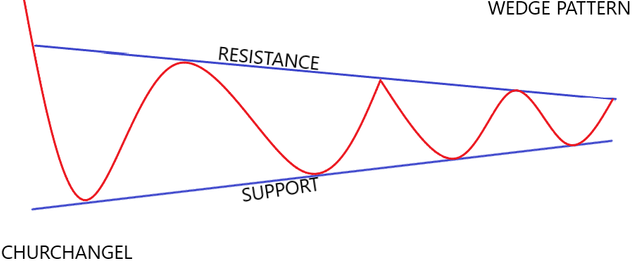
The wedge pattern is a technical trend analysis pattern used to spot trend reversal or continuation in trades, a wedge pattern is formed in a chart with the help of two trend lines one serving as a resistance line while the other serves as a support line both moving in the same direction ( either bullish or bearish i.e rising or falling ) and converging towards each other
Wedge pattern is usually perceived amidst a trade and it signals a temporary pause in current trend most traders often use the wedge pattern to determine entry or exit from trades, they are two types of wedge patterns i.e
RISING WEDGE
FALLING WEDGE
An example of a wedge pattern can be seen below
[Editedwith3dpaints]
QUESTION 2
Main differences between the Double Top and the Double Bottom. Show screenshots.
1
A double top is a reversal pattern that is perceived at the end of a bullish trend usually having an alphabetic M shape while the double bottom is a reversal pattern that is percieved at the end of a bearish trend which has an alphabetic shape of "W"
2
At the end of every double top a short or long term reversal of trend in the bearish direction is expected to follow while at the end of every double bottom a short or long term reversal to the bullish side is expected to follow
3
A difference can be perceived in their individual graphical representation
DOUBLE TOP
DOUBLE BOTTOM
QUESTION 3
Explain and highlight the main differences between a bullish wedge and a bearish wedge. Show screenshots of each.
RISING WEDGE
A rising wedge is a wedge-like formation that is perceived in an uptrend, the rising wedge is seen when a chart price action is making higher highs and higher lows and can be identified in a chart with the help of two trend lines ( support and resistance lines) both slanting towards an upward direction.
In rising wedges, both trend lines or support and resistance levels are seen to converge towards each other becoming narrower as time goes on.
In most cases when traders perceived a rising wedge in the midst of an uptrend, a trend reversal i.e towards the opposite direction is expected to follow after some time, while when a rising wedge is seen during a downtrend it is perceived as a signal for a trend continuation.
The rising wedge pattern depending on what direction the trend formation is serves as a sibgnal for either entry or exits in a market, it serves as a market exit signal during an uptrend and a short entry in both an up or a downtrend.
The rising wedge can easily be identified with the help of two trend lines converging towards each other in an upward direction, a keynote to identifying the rising wedge is that it is always followed by a breakout or a notable trend reversal
Keynotes in a rising wedge
- Upward in nature
- Comprises of two trend lines slanting upwards
- Both lines are converging towards each other
- price action is expected to interact with both trend lines on a minimum of two or more occasions
- in an uptrend, it signifies a trend reversal while in a downtrend it signifies trend continuation
FALLING WEDGE
A falling wedge is referred to as the opposite of the rising wedge, A falling wedge is a wedge-like formation that can be seen when a chart is making lower highs and lower lows, quite similar to the rising wedge a falling wedge can either identify a trend reversal or a trend continuation depending on what direction the trend is currently at.
The falling wedge pattern can be identified in a chart with the help of two trend lines one acting as a support line while the other serving as a resistance line, when a falling wedge is located at the bottom of a downtrend it is perceived by traders as a trend reversal signal while if the falling wedge is seen in an uptrend it signifies a continuation in an uptrend contrary to the rising wedge
The falling wedge can easily be identified in a chart with the aid of two converging trend lines in a downward direction.
Keynotes to identify falling wedges include
- It is downward in nature
- identified with the help of two trend lines i.e support and resistance levels
- at the bottom of a downtrend the falling wedge signifies a reversal in trend while in the midst of an uptrend it signifies a trend continuation
QUESTION 4
Explain the volatility that usually exists with respect to the volume in the wedges. When is there usually more volume? What happens if a pullback breaks the support of a wedge?
A rising wedge pattern is seen often in chart as an assets price action is making higher highs and higher lows hence we have the contracting upper and lower lines when we are looking at the chart, this is because of the reduction in volatility of the assets.
As a rising wedge pattern is being formed the volume of that assets trade begins to consecutively reduce
this reduction in volume and volatility is going to be consistent untill the assets experience a reversal where new trend forms and the assets volume and volatility will be seen to go high during the period of reversal
A falling wedge is seen often in charts of assets making lower lows and lower highs hence forming a contracting support and resistance line, the falling wedge often contracts as a result of the decline in volume and volatility of the asset,In most cases when a reversal is experienced in this phase an increase in both volume and volatility is often perceived to follow
When is there usually more volume? What happens if a pullback breaks the support of a wedge?
Like i said earlier an increase in volatility is seen when there is a breakout in the wedge pattern and is followed by a reversal When there is a breakeout in the support of a wedge this can denote a perfect entry position, long or short depends on the type of wedge pattern the breakout is occuring from
QUESTION 5
Find and analyze the double top pattern on at least 2 charts. Show your own screenshots.
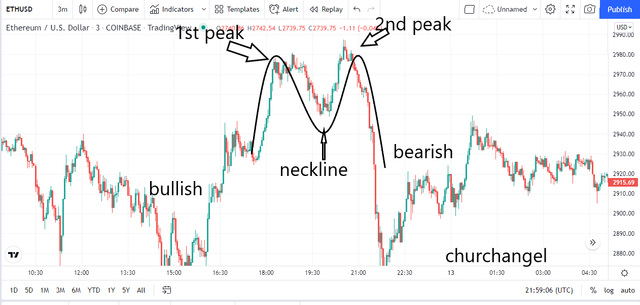
As can be observed from the image in the chart above the double top pattern in the ETH/USDT pair was formed initially form a bullish entry and exited forming a bearish trend on exit. For a bullish trend reversal conditions like the double top has to be formed from the bearish side react with the neck line reverse again to form a second peak then totally reverse and move in the direction of a new trend
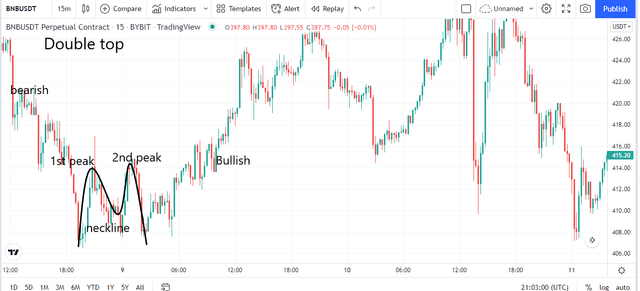
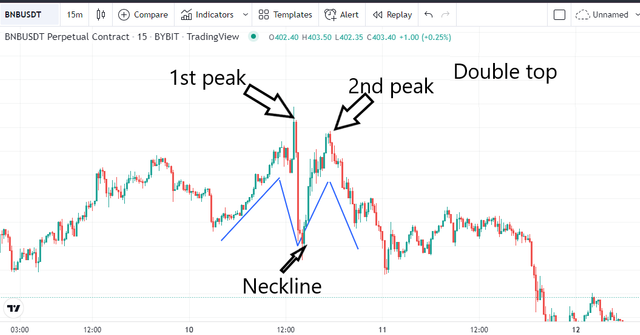
As we can see from the BNB/USDT pair in the image above, our price action began in a bearish trend and at the bottom of the trend formed a double top pattern denoted in the screen shot above with an M letter, after the formation of the Double top pattern a reversal in the asset previous trend was experienced.
QUESTION 6
Find and analyze at least 2 rising wedges and 2 falling wedges on at least 2 charts. Show your own screenshots.
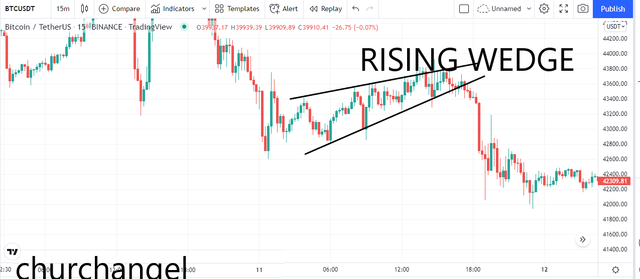
From the chart above it can be observed that the rising wedge was formed at the top or ending of a bullish trend hence the subsequent breaks observed in the images above were observed to be in the support line hence a reversal of price action to the bearish side followed
We have a second type of rising wedge and this type of wedge is seen at the bottom of a down trend, this type of rising wedge is often seen to be a trend continuation pattern. This type of pattern is seen to breakout at the suport level also but the diffrence is that it this rising wedge is from a bearish trend and continues in a bearish direction while the other is from a bearish and reverses to a bullish trend
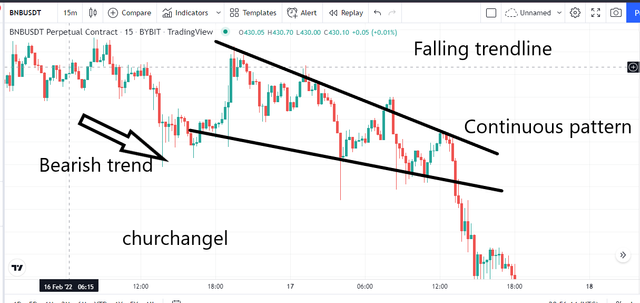
A Falling wedge depending on what direction the proce action enters the wedge it can be a continous pattern or a reversal pattern. In a downtrend a falling wedge signals a trend reversal to the upside, the contracting support and resistance line indicated a decrease in assets volume hence confirming our falling wedge hence when a falling wedge is detected in a downtrend as seen above it might signal a continuous downtrend or a reversal, in the case of our chart above the falling wedge was seen from a bearsih trend and continued in the bearish trend.
QUESTION 7
Importance of patterns in technical trading
A pattern in technical trading a signs we look out for in a chart and expect some sort of repeated behavior when seen, getting familiar with a lot of patterns has a lot of remarkable importance,For instance knowing a lot of reversal patterns during technical analysis can help save one from getting caught in trend reversals in a lot of different occasions, crypto trading has ita foundation built strong on both Technical and fundamental analysis if one is accustomed with reversal patterns and is currently in an open trade a trader would know to look out for some patterns which when spotted will tell him to close order or open a new order in the new trends direction
Another importance of pattern in trading is that it greatly increases your chances of succeding and reduces your chances of losing a lot of trades, the pattern can also help a trader to possibly foretell the new direction of a trend after observing a pattern, for instance one can tell that if a double top is seen at the end of a bullish trend signifies a reversal in trend the the bearish side patterns have a great deal of importance in our daily trading life and it all comes down to objectifying a traders trading skills and increasing his chances of succes while cutting loses
QUESTION 8
Do you find it effective to use these patterns in trading? Justify your answer.
YES
I would say applying and looking out for patterns during our trades is a very crucial aspect of my day to day trading,
the crypto market is a very unpredictable and volatile, understanding very well the reversal and continuation pattern can prove to be of huge help, nothing in the crypto space can be 100% accurately predicted to go in a particularly direction , but with the help of patterns one can.
For instance a double top seen in a bullish trend indicates a trend reversal to the bearish side so also a falling wedge seen at the bottom of a trend can indicate a reversal to the up side, from spotting some certain patterns in a market one can with some degree of accuracy predict the future direction of an asset. So yes these patterns are very effective and it is of utmost importance to learn to identify them in a crypto market
CONCLUSION
As a trader learning to identify patterns is of utmost importance, we have two types of chart patterns i.e trend continius chart pattern and reversal patterns. I had a more indepth understanding of patterns now ,thanks to professor @imagen for this expository course
Ran out of time couldnt properly answer 6... My sincere apologies
Don't worry!
Gracias por participar en la Sexta Temporada de la Steemit Crypto Academy.
Espero seguir corrigiendo tus futuras asignaciones, un saludo.