Part 1- Crypto Academy / S6W1 - Homework post for nane15.
Hello Everyone and a warm welcome to steemit crypto academy season 6
What do you understand by trading? Explain your understanding in your own words.
What are the strong and weak hands in the market? Be graphic and provide a full explanation.
Which do you think is the better idea: think like the pack or like a pro?
Demonstrate your understanding of trend trading. (Use cryptocurrency chart screenshots.)
Show how to identify the first and last impulse waves in a trend, plus explain the importance of this. (Use cryptocurrency chart screenshots)
Show how to identify a good point to set a buy and sell order. (Use cryptocurrency chart screenshots)
Explain the relationship of Elliott Wave Theory with the explained method. Be graphic when explaining.
Conclusion.

QUESTION 1
What do you understand by trading? Explain your understanding in your own words.
Trading in the traditional context means exchanging items for other items of equal value or simply buying and selling which most often involves the exchange of goods or services in exchange for payment which is most often in cash or other items of equal value.
In a crypto world context, we can define trading as a process that involves the purchase of crypto or other assets at a lower price and reselling at a higher price for profit. Crypto trading can also involve the act of monitoring an asset and buying to resale at a higher price for profit ( Buy/Long) or resale at a lower price for profit ( Sell/Short).
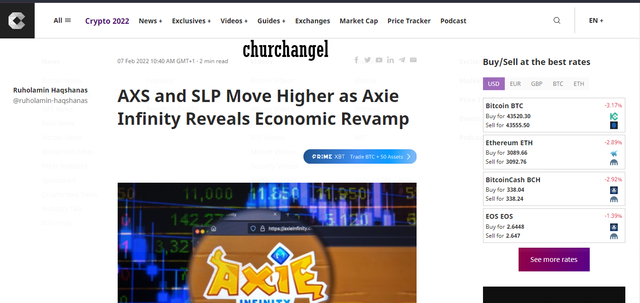
Crypto trading often involves a background study before one can proper make a profit from it, Fundamental and technical analysis are basics required by anyone interested in making a profit from the crypto market. Fundamental analysis involves gathering information about an asset of interest from news or websites which can help a trader to make the right decision about an asset to be purchased an example of a fundamental analysis can be seen in the image below
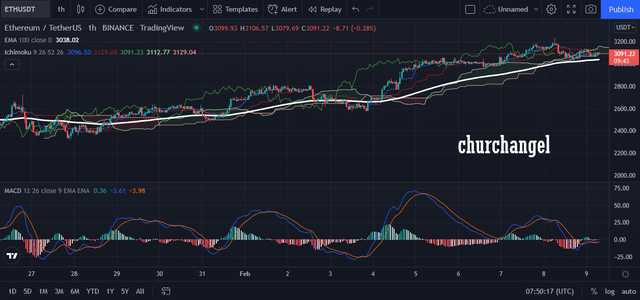
Technical analysis in trading involves the use of charts and indicators to monitor and analyze the behavioral pattern of an asset and predict the future of the asset possible trend direction and making either long or short entries with the aim of making a profit, Graphical example below
QUESTION 2
What are the strong and weak hands in the market? Be graphic and provide a full explanation.
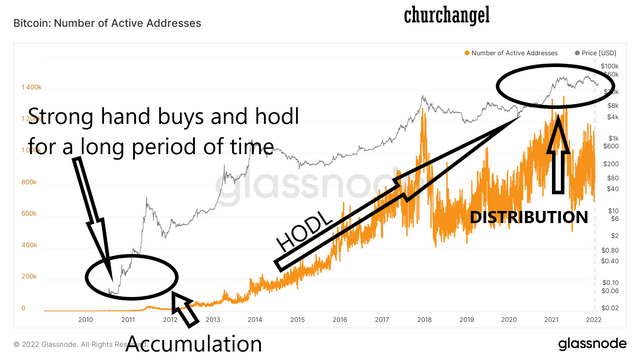
Weak hand traders are referred to as traders who buy and sell habits are driven by emotions, they buy and sell as often as they can. Weak traders are traders who close their position quickly after a loss or jump to buy an asset when it is making new highs so as to catch the trend and sell when the asset's value starts to decline, these set of traders are often driven by fear and greed in a market.
A weak hand seeks to make profit at every chance he gets hence is making market entries and exits as often as possible for profit and in some cases gets caught amidst a trend reversal and ends up loosing assets in the trade.Grahical example below
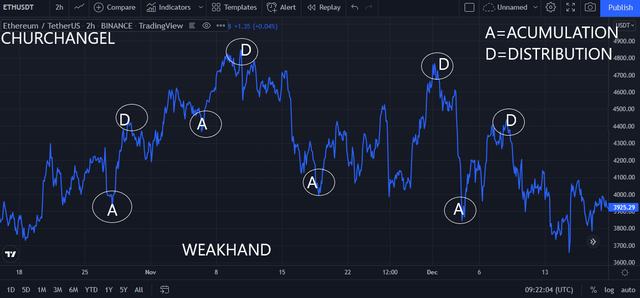
A common misconception in defining strong hands is that anyone that holds a large amount of assets is called a strong hand, A strong hand is anyone in a crypto market that has a lot of capital in an asset and who is not easily moved by market momentum to either buy or sell due to dips or increment in value, strong hands can hold an asset for a significantly long period of time for resale much later at a higher price.
Strong hands are not driven by fear of missing out (FMO) or greed, a strong hand is not driven by emotions in trade he simply buys an asset in a very large quantity and holds for a significant period of time with the aim that an asset will grow and profit will be made.
QUESTION 3
Which do you think is the better idea: think like the pack or like a pro?
The crypto world to the best of my understanding is not an environment for those who are crowd thinkers, if one in the crypto world follows the crowd he will end up losing funds as the crowd always are after trends. Crowd in crypto are conventional thinkers who are run after every signal and make unnecessary entries and endup loosing a lot of capital in the process while
Pros are those set of traders who take their time to make their own research about an asset or a crypto project before making entries or purchases of any sort, the pros in the crypto world are not conventional thinkers they assess an asset with fundamental and technical analysis before they make entries to a trend hence they don't easily get pulled by traps set by whales in the market.
Pros always end up with more profit at the end of the day because they tend to do their own research rather than just buy because everyone is buying so in a nutshell i would say it is better to think like a pro than with the pack
QUESTION 4
Demonstrate your understanding of trend trading. (Use cryptocurrency chart screenshots.)
Trend trading can be referred to as a trading habit that entails making market entries only when there is volatility and an asset is expected to move either in a bullish direction or a bearish one. Although we have three different types of trends which involve Bearish trend ( Upward in direction), Bearish trend ( downward in direction ), and side ways trend, trend trading often involves bearish trading and bullish trend.
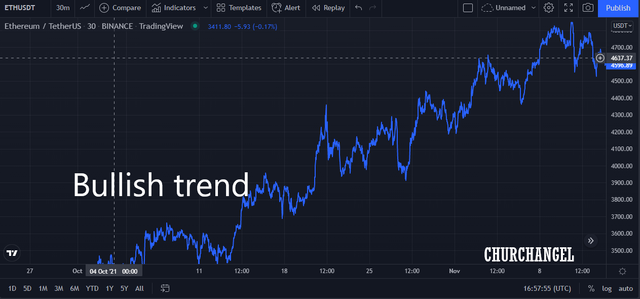
BULLISH TREND
A bullish trend in a very basic term is any market trend moving in an upward direction hence an increment in value, a bullish trend can also be perceived as an asset price making new higher highs and higher lows. A bullish trend often entails confidence in traders, when a bull trend is seen on an assets chart this means that the number of buyers in an asset's market is currently more than the number of sellers hence a bullish trend. Here traders with an open trade order make a profit while traders with a short position loose profit
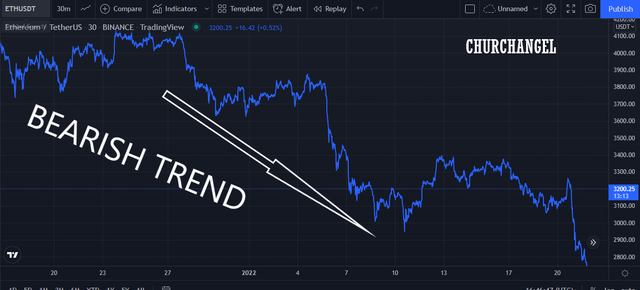
BEARISH TREND
A bearish trend is seen usually in a downward direction and often entails a reduction in the value of an asset, often a bearish trend movement incites fear in amateur traders who are in a long position and some end up liquidated or closing a trade with a loss.
A bullish trend can be simply explained to be the progressive movement of an asset making new lower lows and lower highs, traders with good analysis can predict the incoming of a bullish trend and either open a short position or close their long positions with the help of technical analysis or fundamental analysis. A bullish trend often entails a higher number of sellers in an asset's market than buyers
QUESTION 5
Show how to identify the first and last impulse waves in a trend, plus explain the importance of this. (Use cryptocurrency chart screenshots)
Steps on how to identify the first and last impulse waves
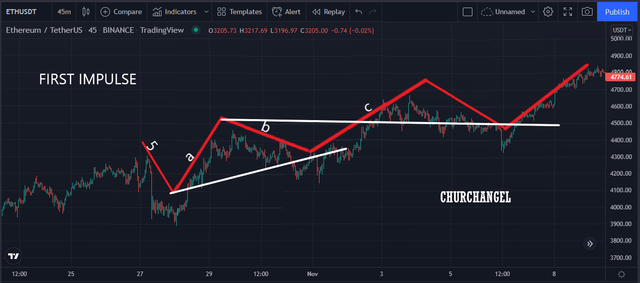
The first impulse can be only identified after the first set of waves have been found and outlined 1-5 and a-c,
P.S 5-a should have the lowest low in the first impulse while wave a-b should have a higher high, higher than wave 5-a
wave b-c should be making new higher highs and the lowest low should be higher than 5-a
Pictorial explanation below
LAST IMPULSE
The LAST impulse can be only identified after the Elliot waves have been outlined in the chart again,the last impulse is found after the last three corrective waves have been seen. Pictorial explanation below
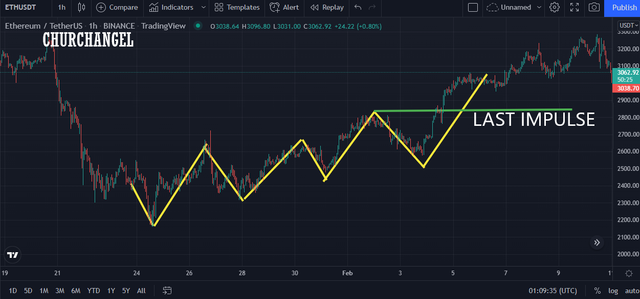
The importance of being able to identify these important areas in a market can not be overemphasized, price assets are believed to sometimes have a pattern like behavior in their movement, knowing how to identify first and last impulse will help a trader to get a closer look at the market's pattern hence be able to predict its future movement even more accurately than before
QUESTION 6
Show how to identify a good point to set a buy and sell order. (Use cryptocurrency chart screenshots)
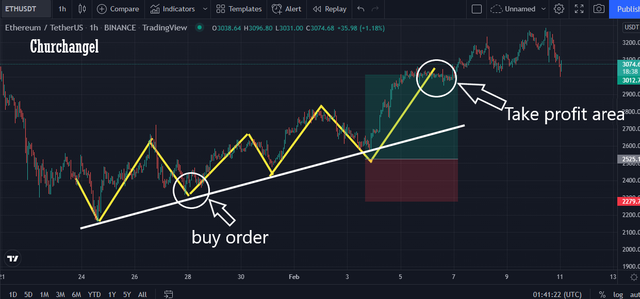
To set up a proper buy position using the Elliot wave theory on an Eth/USDT paiir, i made my market entry at the base of the first impulse support level with a risk to reward ratio of 2:1 with a take profit at 13.91% and a stop loss at 7%. Using the Elliot wave theory the best and most suitable exit position would surely be at the end of the three correction waves during the last impulse
The wave creates a sort of bullish support level which can be used to a great extent to determine suitable entry and exit levels, when a brake is experienced in the support level at the last impulse that might signify a reveal in trend so one is advised to always have a target within first and last impulse and exit after targets are met
QUESTION 7
Explain the relationship of Elliott Wave Theory with the explained method. Be graphic when explaining.
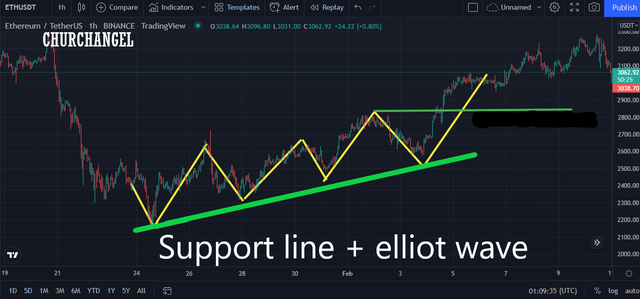
The Elliot wave theory serves as the foundation in the trade setup used above, the Elliot wave theory is used to identify proper waves and locate first and last impulse which in turn helps one mao out a good support level which can be used tofurther support our trade.
I simply added a supporting horizontal line alongside the Elliot wave theory, Mapping support, and resistance level although a very basic technical analysis can prove to be a very effective secondary tool to use to confirm signals sent by an indicator. The Elliot wave theory was used as the primary source for entry and exit signals while the support level was used to confirm entries and exits pictorial representation below
CONCLUSION
The basics or backstory behind every successful trader is the fact that they take their time to do proper fundamental and technical analysis, fundamental and technical analysis are the only way one can accurately to some extent predict the future movement of an asset. Strategies like the combination between Elliot wave theory and support line can help one to maximize earn percentage in the crypto space as well.
cc: @nane15