[Crypto Trading with Price Action] - Crypto Academy / S6W2- Homework Post for @reminiscence01
Hello Everyone and a warm welcome to steemit crypto academy season 6
Questions
- Explain your understanding of price action.
- What is the importance of price action? Will, you chose any other form of technical analysis apart from price action? Give reasons for your answer.
- Explain the Japanese candlestick chart and its importance in technical analysis. Would you prefer any other technical chart apart from the candlestick chart?
- What do you understand by multi-timeframe analysis? State the importance of multi-timeframe analysis.
- With the aid of a crypto chart, explain how we can get a better entry position and tight stop loss using multi-timeframe analysis. You can use any timeframe of your choice.
- Carry out a multi-timeframe analysis on any crypto pair identifying support and resistance levels. Execute a buy or sell order using any demo account. (Explain your entry and exit strategies. Also, show proof of transaction).
QUESTION 1
- Explain your understanding of price action.
Price action to the best of my understanding reflects how well an asset is being valued,the price action of an asset in a market often entails or reflects the mentality of traders currently participating in an asset's market. For instance, a loss of value in an asset might incite fear in retail traders and some might close position with a loss or incite greed in some entering short trade and end up getting caught in a trend reversal
Price action utilizes confirmed data to reflect the real-time value of an asset which serves as a very crucial basic without which the whole fundamental analysis feat can not be possible, price action can be used to predict an assets future movement as an asset that has sales or purchases conducted in its market generates a price action, assets with a high rate of market transaction or volatility are known to be are said to be easily analyzed just via price action, since using price action removes all noise and secondary indicators the prediction of an asset's future direction is done independently on an assets price fluctuations solely and in some cases with the help of imaginary support or trend lines
Trading with the price action has a lot of perks, like when one is trading is price action his chances or success rate are higher because this individual is making use of first-hand market information, no lagging, no secondary information, no wrong signals from indicators just proper information from the assets price action, most often when one loses a trade when doing analysis with price action it is safe to assume the error is from the trader's analysis.
QUESTION 2
What is the importance of price action? Will, you chose any other form of technical analysis apart from price action? Give reasons for your answer.
Price action has a lot of perks some of which are
- Access to first-hand information
The price action often entail real-time market prices, movement are seen within as they are happening in the crypto market
- No noise in the chart, an asset's movement can be clearly seen without confusion
One of the great perk of using the price action is the fact that movements are seen clearly without disruption in the chart, one can in an instant tell the direction of a trend and spot good resistance and support level which can serve as a basis for market entry and exits
- False signals filter
While using price action to both make entries and exits, one won't get caught up by perceiving false signals which are common while using indicators, issues concerning perceiving divergent signals or fake trends would not be frequent when one is using the price action
- Reflects traders mentality
Often in most cases, price action lets you know when and where traders mentality is at, when traders confidence is high a lot of profits are made and a lot of greens are observed and vice versa
Will, you chose any other form of technical analysis apart from price action? Give reasons for your answer.
YES
As much as price action is a fundamental and a core additive to our technical analysis I don't think its safe to only trade using just price action, in the crypto market the chances of one are increased with respective increases in one's ability to analyze an asset, Price action in conjunction with other technical indicators go a long way to analyze the movement of an asset even more. So i would strongly suggest one uses other technical analysis tools in line with the price action to better analyze an asset so one's chance of making a profit would be more likely.
QUESTION 3
Explain the Japanese candlestick chart and its importance in technical analysis. Would you prefer any other technical chart apart from the candlestick chart?
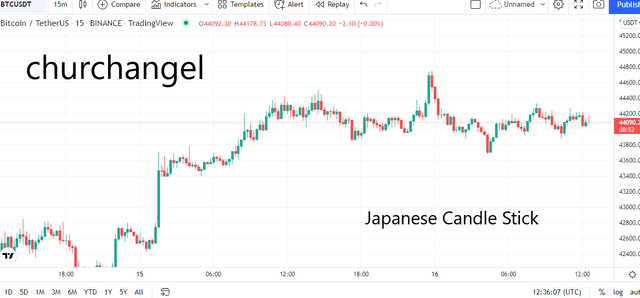
The Japanese candlestick is a technical analysis tool used to indicate price movements by showing opening and closing and highs and lows in the market price for a specified period of time. It offers information like highest points, lowest points, opening prices and closing prices, markets direction, help analyze to predict if there is going to be a bullish trend or bearish and all this information can be absorbed by a Trader by just a glance at the chart
On Japanese candlestick and even most technical indicators now usually green bar represents upward movement in the market and on top of the green indicates a close and the bottom of the green indicates an open while red indicates downward movement in the market and the bottom of the red bar indicates close while the top indicates the open. The wick often known as the shadow is seen on the top of the candlestick whether Red or Green it represents the highest point the market has reached within your specified period of time and if the wick on a candlestick is high it indicates high volatility in the market while if the wick is very low it indicates low volatility in the market
The Japanese candlestick displays crucial information like a market's opens or closes, highs and lows alongside informative patterns that can be used for either entries or exits or mapping out good support and resistance level in an asset. Most traders use the Japanese candlestick for technical analysis cause its not complex to understand and it is very informative and detailing
Would you prefer any other technical chart apart from the candlestick chart?
NO
Most technical charts are not as informative or well structured as the Japanese candlestick let's take the line chart for instance it only uses closing prices of an asset for a given period hence given lesser detail and lesser noise while the bar chart although similar to the candlestick only displays four pieces of information open, close, highs and lows.
All other chart types have their own advantage but overall I believe the candlestick chart stands to still be the best for me so while trading I am always making my analysis on the candlestick chart
QUESTION 4
What do you understand by multi-timeframe analysis? State the importance of multi-timeframe analysis.
Multi-time frame analysis as the name implies simply involves viewing an asset or doing technical analysis on a particular asset or a pair with different time frames. In multi-timeframe analysis, the essence is to get multiple time frames and study the behavior of an asset under different time periods
Multi-time frame analysis is always advised to be done in time frame wide apart, for instance, using different time frames close to each other like the 3 mins, 5 mins, 5mins and 45 mins might prove to be counterproductive and might lead to inaccurate entries. The whole point of Multi-time frame analysis is to confirm a signal gotten from one-time frame by using a different time frame and this can best be done in time frames apart from each other for instance 15 minutes - 2 hours - 4 hours - 1 day. Different timeframes are suitable for a different pattern of trading
The Multi-time frame analysis helps one to get a general notation of the trend of an asset then move onward towards the lower time frame to perform a more detailed analysis with a general sense of the asset's trend direction and make entries.
State the importance of multi-timeframe analysis.
- HIGHER CHANCE OF SUCCESS
No doubt the better one gets at analyzing an asset the higher his chances of entering profitable trades are, when one performs multiple analyses on different time frames errors or pieces of information missing in the first analysis in the first time frame are most likely to get caught in the second time frame or third even fourth, so using this multi-timeframe analysis one tends to eliminate errors more often and accumulate profit even more
- THE GENERAL SENSE OF A TREND IS KNOWN
When one uses a smaller time frame to perform analysis by going farther to a longer time frame one will get the general trend direction and this will help one in trading so he doesn't enter or trade against a trend and minimize risk
- BETTER ENTRIES AND EXITS
When one performs a more comprehensive analysis his chances of entering wrong trades are reduced by a lot, using the multi-timeframe analysis one tends to get the best possible entry window from different timeframes hence entry and exits can be confirmed from across different time frames
QUESTION 5
With the aid of a crypto chart, explain how we can get a better entry position and tight stop loss using multi-timeframe analysis. You can use any timeframe of your choice.
For my multi-timeframe analysis, I would be making my analysis using the following timeframes
15mins - 1 hour - 4 hours - 1 day in the BTC/USDT pair
By understanding the behavior of an asset in a longer time frame it would be quite easy to make an entry in a shorter time frame so it is highly recommended one starts with a longer time frame and analyse downward to shorter time frame,
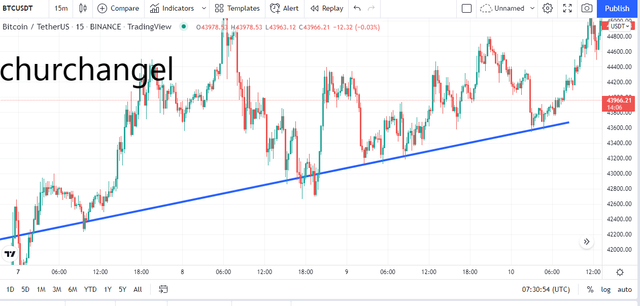
Our first chart would be on a 1-day time frame
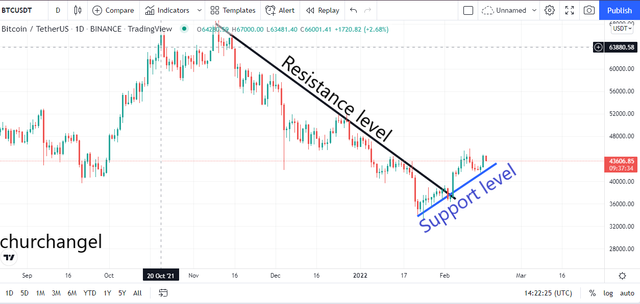
From the longer time frame, we can see that our asset's pair was in a previous downtrend, but at 34,652 a trend reversal was observed to have occurred, the new trend looks to be constantly reacting with the support level and bouncing back off, our new trend is in a current bullish trend so whatever overall decision on entry we are going to take we won't enter or trade against the trend.
Moving on to a shorter time frame of 4-hours
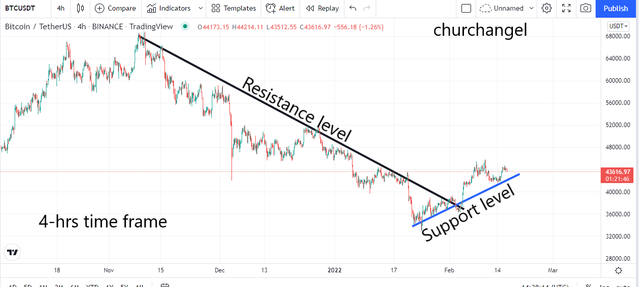
Moving on to the lower timeframe we can see that the support and resistance level is still holing up and more interactions are being observed with the time frame, using the third and lower time frame of 1 hr and 15 mins
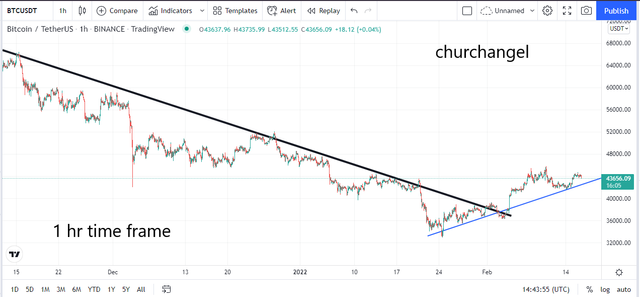
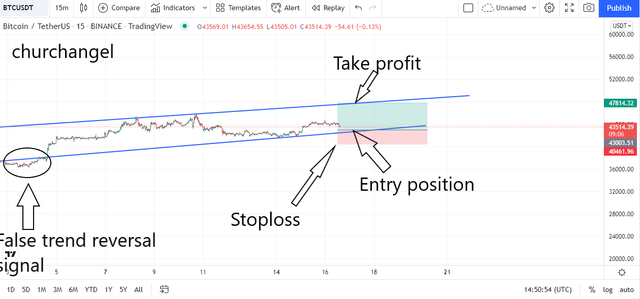
Using the smaller timeframe we can see that our assets price has reacted on multiple occasions with our support line, we can use a much more larger time frame to map out our exit but our entry should be fixed on the next reaction the price has with the support line.
QUESTION 6
Carry out a multi-timeframe analysis on any crypto pair identifying support and resistance levels. Execute a buy or sell order using any demo account. (Explain your entry and exit strategies. Also, show proof of transaction).
For the sake of this course, I will be using the TradingView Paper trading demo account to trade on a MANA/USDT Pair.
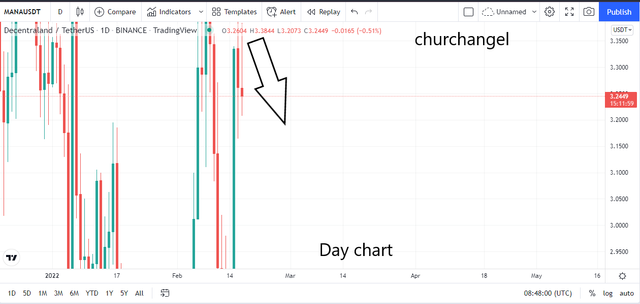
My first chart analysis would be taken on a 1-day time frame
Tradingview
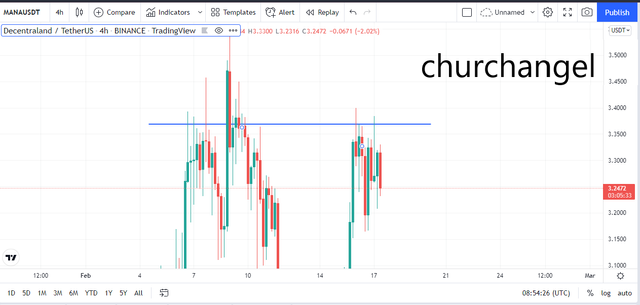
Second was on a 4hr time frame
Tradingview
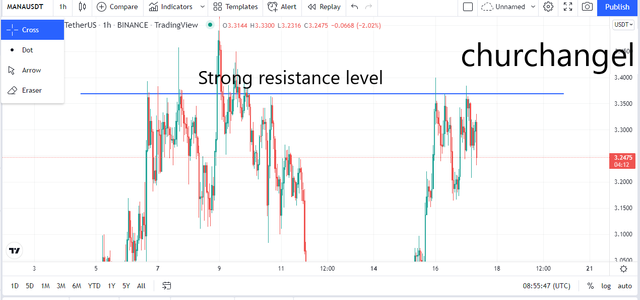
3rd analysis was on a 1 hr time frame
Tradingview
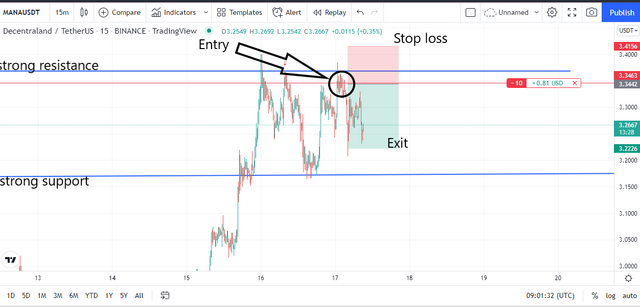
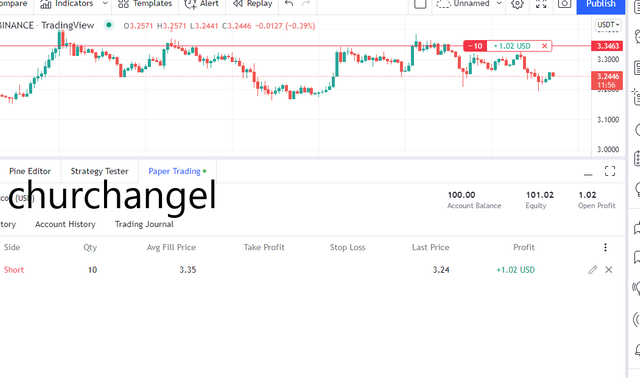
Final chart analysis was done on a 15mins chart. where a decisive entry was made
Tradingview
Using multi-timeframe analysis we could tell from our first chart that our asset was previously in a strong uptrend and later experienced a reverse in trend direction, a downtrend followed and this information could only have been gotten as a result of moving further back in the chart analysis by observing the day timeframe.
From the 4hr time frame and one hour an initial resistance level was spotted and was later confirmed to be a strong resistance level in the 1 hour time frame, now knwing that our trend was a bearish one and we are always advised not to trade against a trend, I observed for another contact with the resistance line and awaited a confirmation from the price action before making my entry in the 15 mins timeframe
In the 15mins time frame, interaction with the resistance line was spotted and an entry was made, a support line was drawn across the chart to map out an exit position, my entry was made after confirmation in was nade in my resistance line, using a TP to SL ration of 2:1 I entered my trade and currently making a profit of $1.02
CONCLUSION
Although the Price action is fundamental to all traders during technical analysis i would strong advise against trading solely with just it, a combination of Price action with other indicators would easily make a traders success rate go alil bit higher, combining Price action, indicators multi time frame analysis will all the more increase ones chances of entering a correct trade.
cc: @reminiscence01