[ Crypto Trading with Moving Average ]-Steemit Crypto Academy | S6W2 | Homework Post for @shemul21
Q1: Moving average explanation

Moving average is a technical indicator that helps traders detect trends and set prices of cryptocurrency.
A moving average is a series of prices or values that are displayed on a chart by repeatedly measuring the prices that occurred between two points in time.
It’s a very common and valuable tool for traders, because it allows them to quickly detect if a trend is gaining momentum or not.
Moving average lines are used as a base for trading cryptocurrencies, by starting a position at one point and waiting until a particular period of time.
The moving average is very popular among traders, and the most famous case of using it is to trade cryptocurrencies in time.
The reason to use moving average as a trading strategy is the volatility of these cryptocurrencies.
Cryptocurrencies are very volatile due to their volatility and are difficult to predict because they change in real time. The way to trade them is to reduce risk by always being at the right time.
Moving average narrows trend lines and guides a trader when price is above or below the movement. This type of technique is essential for the trader and a must-have skill.
In the real time market, it is difficult to set a market trend with true accuracy, and with this technique, a trader is using signals from the past to determine the trend.
You have to look for the moving averages in the previous analysis and review it for more accurate indications on where the market is heading. The moving averages help narrow the trend to the present moment and let you determine how the market will move in the future.
Q2: What Are The Different Types of Moving Average? Differentiate Between Them.

By using the moving average for trading traders can easily set price lines and hit the buy and sell button.
Top strategies to use in order to use the moving average
There are many strategies and techniques to combine with moving average when trading cryptocurrency and only few of them are actually considered good, but to do that you must understand the three types of moving averages.
- SIMPlE MOVING AVERAGE
- EXPONENTIAL MOVING AVERAGE
- WEIGHTED MOVING AVERAGE
Simple Moving average:
The calculation of simple moving average (SMA) is done by adding the closing price of the Candlestick for the given time periods, say for 20 days, and then dividing it by that time period- i.e 20.
Moving average helps to smooth out the 'noise' by filtering out random price movements. SMA carries it's calculation based on past data, so, usually a lagging indicator.
If the time period is long it gives more room for a greater lag.
Example 20-day SMA will have a lesser lag than the 200-day SMA. While Shorter SMAs are used for short-term trading, Longer SMAs are used for long-term trade
The simple moving average importance of moving averages indicates that during a prolonged market pullback, these technical levels can be a good sign of a rally continuation.
The reason for this is that while the moving averages are correlated, it's unlikely that the current moving averages are a good predictor of the longer-term market trend (as opposed to shorter-term trends).
As a result, the context of how the moving averages work on the daily chart, along with how they function on the weekly chart, is critical for interpreting the importance of these technical levels.
Exponential Moving Average
Exponential moving averages are a concept in investing in which the long-term moving average of an asset is used to smooth out the swings in its price.
Its form is often illustrated by the difference between the actual price and the smoothed price.
Generally, when the time period is finite, the first exponential moving average (EMA) is used.
(This will occur if the moving average does not have an infinite time period, because it will be truncated to a small number of periods.)
The Weighted Moving Average (WMA) is a type of moving average method of price analysis that is utilized in technical analysis. Its aim is to identify turning points, trend lines, or trends. It uses a system of zeros and ones to count the periods where the closing price is equal to or less than some chosen moving average. It is the average closing price for each day of the trading week in the last 3 months. For example, if the last 3 trading days of the week are Monday, Wednesday, and Friday, the average will be taken to be the Monday, Wednesday, and Friday of the week.
Weighted Moving Average
Using the WMA method of technical analysis, we find that, for example, the index closed below the 50 day moving average last Wednesday, signaling the trendline had been rifted. Based on the above, we concluded that the trendline had indeed broken and the index was heading lower.
The number of days the chosen moving average is below the WMA will be the closing price of the period (according to the calculations for the previous period), while the number of days above the moving average will be the closing price of the period (according to the calculations for the current period).
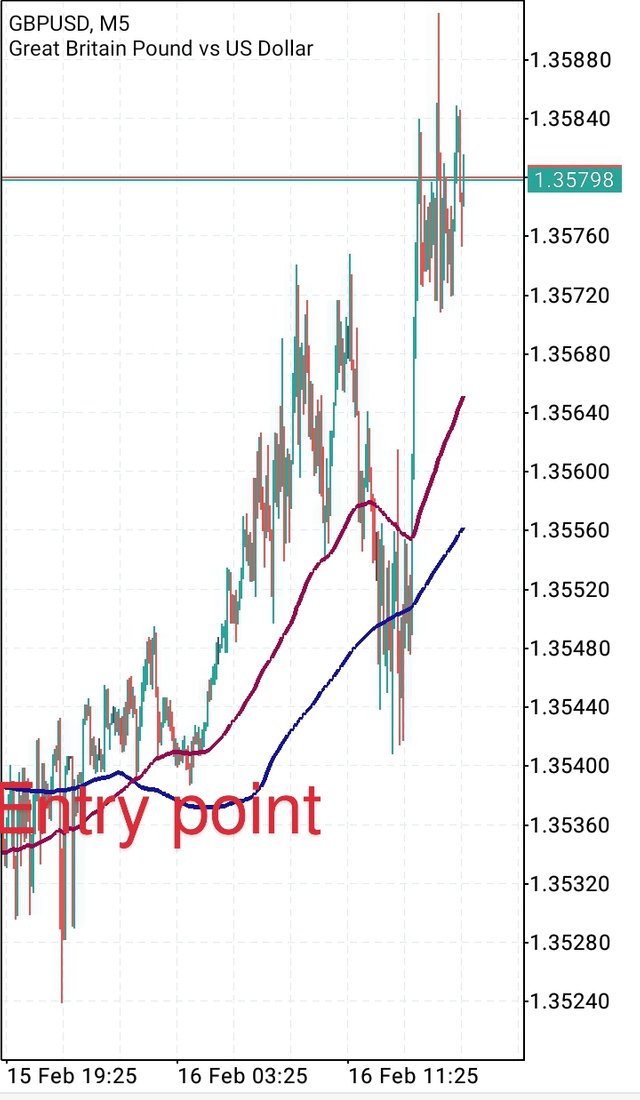
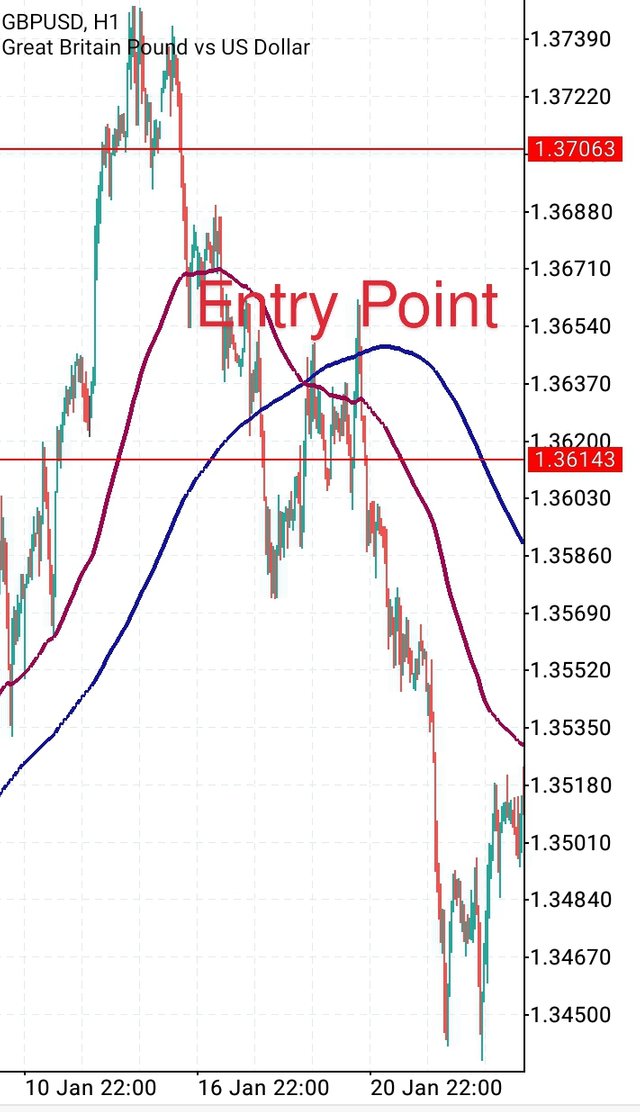
Q3: Identify Entry and Exit Points Using Moving Average. (Demonstrate with Screenshots)


Close the buyposition with any profit.
If a moving average line crosses a line, it represents a buy opportunity and a trader can start a position.
If the moving average lines moves outside of the range, it means that a period of good performance has come to an end and a sell position is open.

Close the sell position with any profit.
Moving average crossing at a crucial price, will be called a breakout.
Q4: What do you understand by Crossover? Explain in Your Own Words.

Moving average crossover system
The next level of technical analysis is a moving average crossover. This consists of two simple moving averages. The first moving average is the 15day Simple moving average. This is set to 15day, but updates every day to allow you to see how the trend changes.
The second moving average is the 200day moving average. This is set to 200. This is updated every day as well. This moving average will also update on a daily basis.
The goal is to understand moving average crossover and the difference between the two period moving averages.
15days simple moving average is important, it records the short-term trading but a multiple 200day difference signifies a longer-term change in trend.
- If a line is drawn directly between the moving averages, this is a buy signal.
- The key to trading using a moving average crossover is that if the two moving averages cross, this is not a buy signal, and you should sell the stock.
3)The spread between the moving averages should be such that your stop loss won't hit by more than 5% in either direction.
Q5: Explain The Limitations of Moving Average.

Moving average as a lagging indicator: Simply looking at the price momentum of each currency pair over a set period of time tells you very little as to where currencies are likely to move over the longer term.
Moving average takes in account the past data of a given crytpocurrency to tell the future.
The moving average is not a guarantee that your position is going to be play as expected.
It filters out the noise in the market
6 Conclusion

From the discussions above, moving average has presented to us the more room to gain from cryptocurrency trading.
Moving average is a technical indicator which filters out the noise in the market. It gives a better solution for traders to open a position, when combine with other indicators the trader gains more the advantage to trade. Thanks for reading throughProfessor @shemul21

