Support and Resistance Breakouts - Steemit Crypto Academy |S6W3| - Homework Post for Professor @pelon53
Hello everyone, this is week 3 of season 6 of the steemit crypto academy. This week's lecture was delivered by professor @pelon53 and the topic for discussion is on Support and Resistance breakouts in technical analysis. After going through this course and understanding it properly, I decided to try my hands on the given task.


1. Explain in detail the advantages of locating support and resistance on a chart before trading.
Let's begin with the explanation of support and resistance. The level at which the price of an asset finds liquidity and is represented graphically is known as the support and resistance levels. The liquidity levels are the money flowing into and out of the market and this affects the price to make a certain reaction at some point.
When the support and resistance are represented graphically on the chart, they serve as the area at the top or bottom where the prices bounce off and then take a certain direction.
Screenshot from Tradingview
Locating support and resistance levels is very relevant because these are the areas that show where more money enters the market or where more money leaves the market the most, and this makes the market react and then cause the price to take a certain direction.
This means that when we are able to locate the right support and resistance areas on the chart, it helps us to be able to identify good entry and exit points in the market.
Identifying a good support area means that we have identified a good entry point because the trend is likely to move upward after bouncing off the support area whilst on the other hand identifying the resistance area means we have identified a good exit point due to the fact that the price is likely to make a downtrend after bouncing off the resistance area.
The support and resistance areas also help us know whether the price trend is a continuation one or it is on a reversal movement. This also helps us to make good trading decisions in the market.
These are some of the reasons why support and resistance are very important when making trading decisions.

2. Explain in your own words the breakout of support and resistance, show screenshots for a resistance breakout, use another indicator as a filter.
We all know the basic operation of the support and resistance is built on the idea that the price will move in an opposite direction when it touches the support or resistance zone. However this doesn't always happen and there are usually some exceptions to this principle. The price can move in any direction after touching the support or resistance level depending on the buying or selling pressure at that particular time.
When the price reaches the resistance level and there is still high buying pressure, the price breaks the resistance level and the upward trend continues. Similarly, when the price touches the support level but there is still high selling pressure in the market, the price breaks the support level and the downward trend continues.
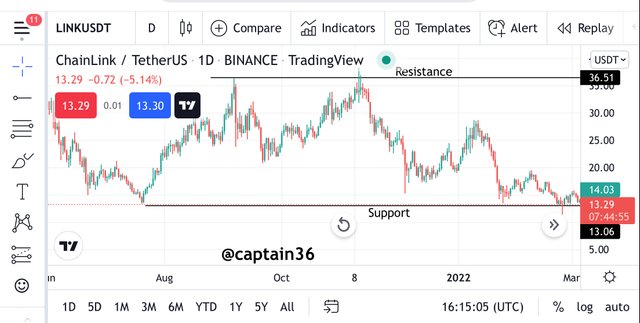
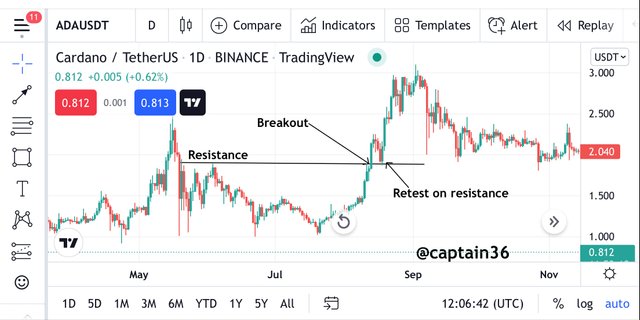
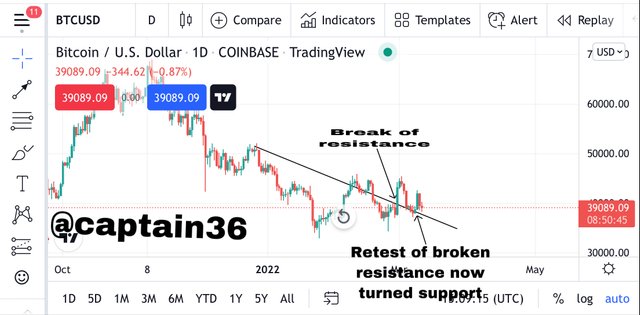
Resistance Breakout
When the price reaches the resistance level, it is said that this is the highest selling area. The selling pressure is always high and the price of the asset begins to dip when it touches the resistance level. But in some cases, even after the price touches the resistance level the buying pressure continues to increase and for this reason there is a breakout at the resistance level and the price still keeps moving upward. When this happens, the traders can decide to take a buy position after the resistance breakout. The chart below is an illustration of the resistance breakout.
Screenshot from Tradingview
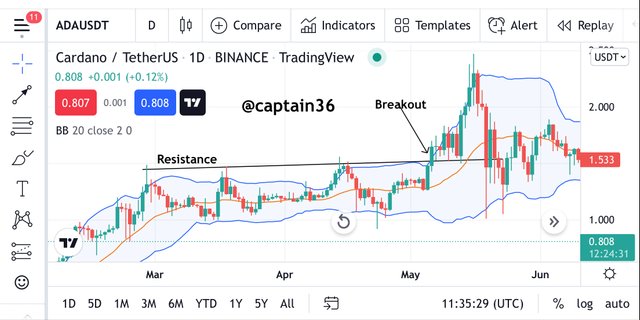
Looking at the chart above, I decided to add the Bollinger band which served as a filter to the breakout. This indicator is very delicate because it is used to identify how volatile the price of an asset is. The Bollinger band consists of the upper band and the lower band. These two parts of the indicator provide dynamic support and resistance for the price. As seen in the chart above, the candlestick breaks the band. When this happens we can say there was a breakout. The breakout that happens on the price chart is also visible on the Bollinger band and the resistance breakout is clearly visible on the Bollinger band. This resistance breakout happens when the candlestick breaks the upper band of the Bollinger band.

3. Show and explain support breakout, use additional indicator as a filter, show screenshots.
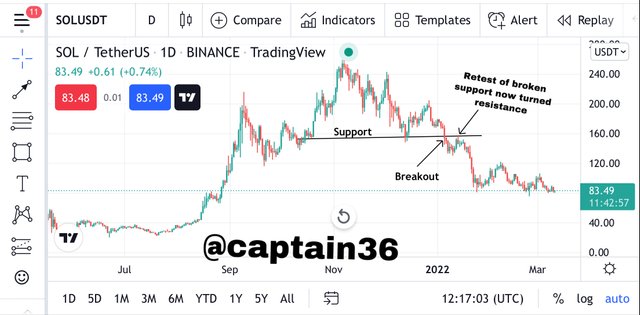
When looking at the support breakout, the high supply in the market results in the fall of the price. In this situation it means that the supply in the market exceeds the demand in the market and this results in the free fall of the price of the asset. When the selling pressure is high and the price keeps falling, it reaches a point where the buy pressure begins to increase again and a support is formed at this point. Usually the price bounces off the support level and begins to make an uptrend.
But in some situations, the supply still exceeds the demand and the price breaks the support level and continues with the downtrend. At this point we realize that the price reverses momentarily and then continues to make a downtrend. This shows that the support level has been broken and this is referred to as the Support Breakout.
When we look at the graph, we notice that the price breaks the support level and falls below that level. This is an indication that the supply still exceeds the demand at the support level. An example is illustrated in the chart below.
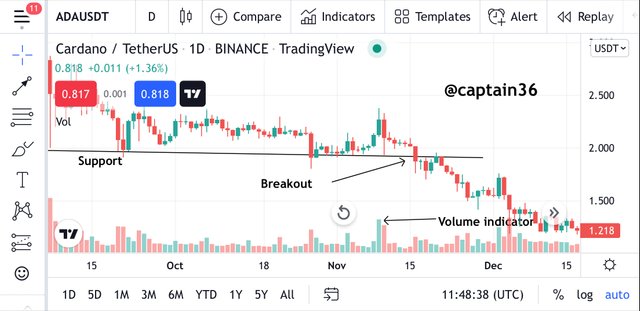
Screenshot from Tradingview
In this section I decided to use the volume indicator as the filter. We could see that when a support breakout happens, there is an increase in selling volume and this is an indication that the supply in the market at that time is far more than the demand in the market. This makes the price keep falling down.

4. Explain what a false breakout is and how to avoid trading at that time. Show screenshots.
At some point in the market, we can see that the price breaks a certain support or resistance level but the price is seen to return to it's normal zone after the break. This phenomenon is known as the false breakout. This usually occurs when the Whales in the market play the market to generate liquidity in the market that favors them. These false signals are very possible so traders must be patient when they identify signals to avoid being caught out by these false breakouts.
When traders get caught by these false breakouts, they lose plenty of funds due to loss in the market. For this reason traders must be careful when the price reaches the support or resistance level because it is very difficult to tell as to whether the price will bounce off after touching these levels or there will be a breakout. Due to this, the best way to utilize support and resistance levels is the use of these levels for the take profit and stop loss.
The chart below is an illustration of a false breakout.
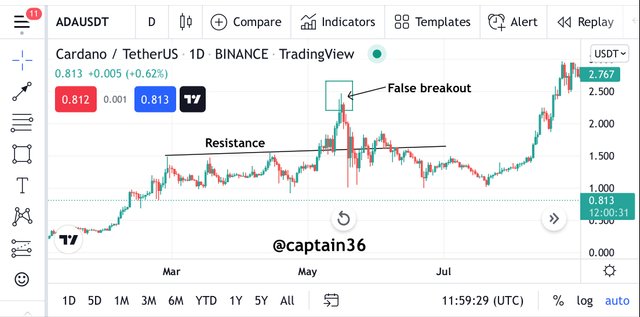
Screenshot from Tradingview
Looking at the chart above, we can see that there was a false breakout at the support level. The resistance level became the support initially. We could see from the chart that the price broke the support level and was on an uptrend. Normally we did expect that the uptrend continued after the support level was broken, but in this case the price reversed again and then began to make a downtrend. So the traders that placed their order after the breakout must open a stop loss to avoid them losing a lot of funds as a result of the reversal of the price. Those who didn't open a stop loss will then lose most of their funds due to this false breakout.
Avoiding False Breakout
There is definitely a way of playing around these breakouts and avoiding them. We basically have to wait for the price to retest at the break level again before we enter the market. When a price retest at the level of the breakout before moving in the direction of the breakout again, it shows us that the breakout is legit and then we can make a decision in the market.
Similar thing applies to the resistance level. When the price breaks the resistance level, it comes back to retest at the same level which now serves as the support and then continues in an upward direction. After this traders can decide to enter the market when they see a bullish candlestick. This can be seen in the chart below.
Screenshot from Tradingview
The same thing is expected for the support level. When there is a breakout at the support level, the price is expected to come back a retest at the same level that is now the resistance level. After this, when the price continues to make a downward trend, it is a signal for traders to leave the market as the downtrend will continue taking place. This is demonstrated in the chart below.
Screenshot from Tradingview

5. On a demo account, execute a trade when there is a resistance breakout, do your analysis. Screenshots are required.
To start with the resistance level, I will do a demo trade on tradingview to analyze some selected crypto pairs. I will use paper trading to execute the trade.
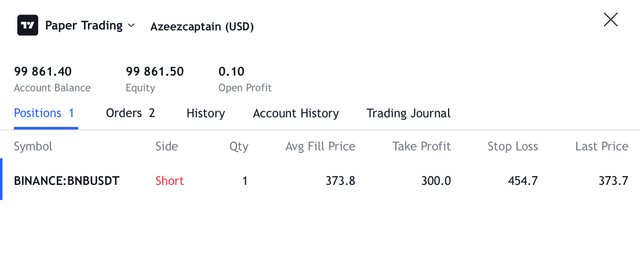
BNB/USDT
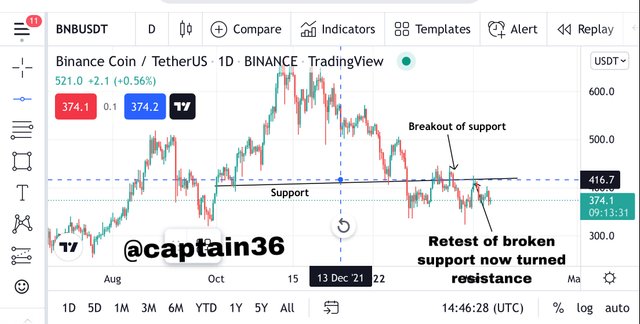
Screenshot from Tradingview
In this trade I chose the BNB/USDT pair. As seen in the chart above, we can see that the support level was broken at $416.7. I then had to wait for the price to come back and retest at the same level which will serve as the resistance which will serve as a proof that the breakout I noticed is legit but not false. But looking at the chart above, the price after it retested at the new resistance level broke down and made a downtrend. So before this happened I placed a stop loss at the top of the support level that was broken and then placed a sell order. This trade can be seen in the screenshots below.
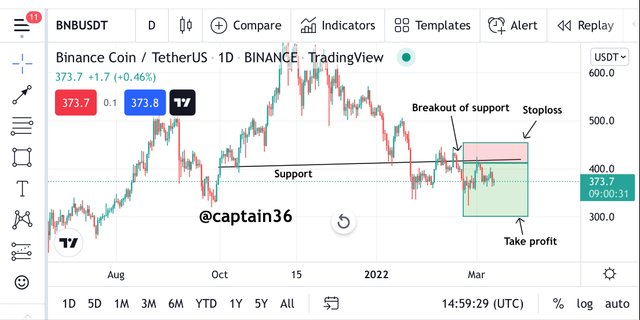
Screenshot from Tradingview

6. On a demo account, execute a trade when there is a break of support, do your analysis. Screenshots are required.
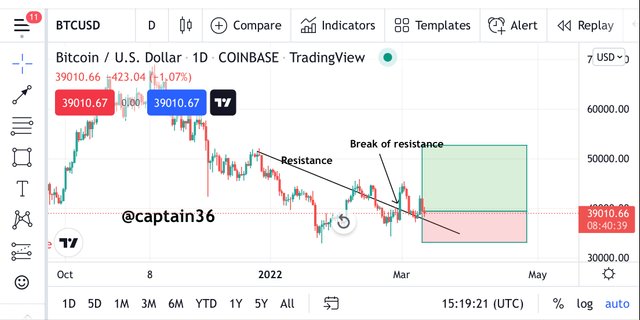
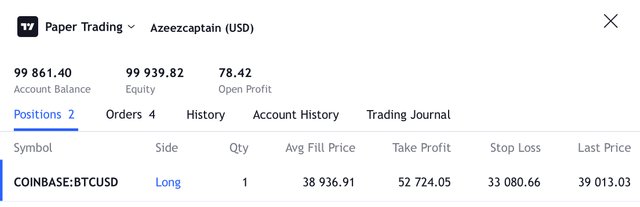
BTC/USD
Screenshot from Tradingview
Looking at the chart above, we can see clearly that the price testing the resistance level has happened continuously and consistently. When there is this kind of consistency, it is a signal that there will be a breakout and traders get ready for it. Looking at this chart the breakout actually happened at the resistance level but it later retested at the same level which now acts as the support level. This was proof that the breakout is legit so I went on to place a buy signal immediately I saw the price moving up again. I then placed my take profit at the top resistance and placed my stop loss close to the resistance that was broken. The trade places can be seen in the screenshots below.
Screenshot from Tradingview

Conclusion
As we have learnt from the above discussions, the support and resistance levels are very important in trading and they help a lot of traders make the right decisions in the market.
But on the other side of it there are false signals that can be generated and traders must be aware of these signals because they could make them lose a lot of funds in the market if care is not taken. So it is important to carry proper technical analysis before making any investments.
Thank you once again professor @pelon53 for this detailed lecture.