[Psychology of Trends Cycle] - Crypto Academy / S6W4- Homework Post for @reminiscence01
Hello everyone, this is week 4 season 6 of the steemit crypto academy. This week’s lecture was delivered by professor @reminiscence01 and the topic for discussion was on Psychology of Trend Cycle. After going through and understanding this lecture properly, I decided to try my hands on the given task.


1. Explain your Understanding of the Dow Jones Theory. Do you think Dow Jones Theory is Important in technical analysis
The Dow theory is a theory that believes that the market is always on a trend. The theory has the notion that at any phase of the market, the market is either on an uptrend or a downtrend.
According to the Dow theory, supply and demand are the factors that control the market. We witness more indices value when the market is on an uptrend or on a downtrend. according to the Dow theory. The market volume also affects the market as well.
According to the Dow theory, the market can also be in two states. These states are known as the accumulation and distribution phases. The trader's ability to determine whether a market is in the accumulation phase or in the distribution phase will help them to be able to make the right trading decisions in the market. The accumulation phase is where the market appears to be at rest but in reality it is gathering momentum in order to be able to make a strong trend. The distribution phase is where the market makes a downtrend or an uptrend.
Do you think Dow Jones theory is important in technical analysis
In my personal opinion, the Dow theory is very relevant in technical analysis. When a trader understands the Dow theory, he can use it to predict the trend in a market.
Traders who understand the Dow theory can identify the current state of the market at any phase. The traders are able to understand the market after reading the trend due to their knowledge on Dow theory.

2. In your own words, explain the psychology behind the Accumulation and Distribution phases of the market. (Screenshots required).
The phases of the market that can be seen during the formation of an uptrend and downtrend are known as the Accumulation and Distribution phases. Let's discuss these two phases in this section.
Accumulation Phase
We are aware that mostly when many traders begin to sell an asset, the price of the asset starts to fall meaning the asset is on a downtrend. When this happens, the whales in the market also start to take buy positions in the market and this move will ensure that the price will start to make a bullish trend again.
When the traders also notice this action by the whales in the market, they also start to take buy positions in the market again and this ensures that the price of the asset will start to make an uptrend again. The action of the whales as well as the decision of the small traders to enter the market creates a lot of volume in the market and a bullish trend takes place at this point.
Based on this, we can conclude that the accumulation phase is the phase where a lot of buyers are entering the market hence increasing the buying pressure in the market. Due to this, immediately after the accumulation phase, we can see a strong bullish trend in the market. This is demonstrated in the chart below.
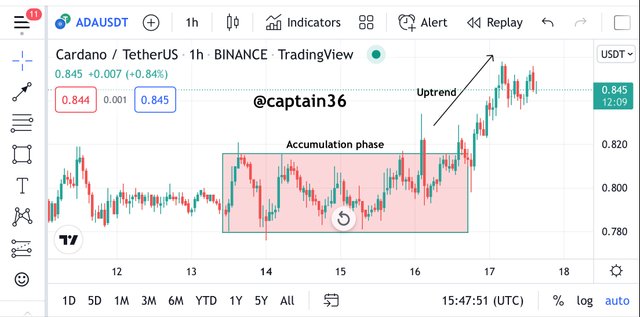
Screenshot from: Tradingview
Looking at the chart above, we can see clearly that the price began to make a strong bullish trend immediately after the accumulation phase. The accumulation phase has been highlighted in the chart above.
When the whales in the market at some point decide to take a sell position and take their profit, we will see that the price begins to fall again but not all the times that a complete downtrend will be seen. The price can accumulate again at this point and then continue to have an uptrend again. This process is known as reaccumulation phase.
Distribution Phase
There is always a zone where the price is always in a ranging zone and then begins a downtrend after that zone. This zone is known as the distribution phase.
When a bullish trend comes to an end, the distribution phase sets in and then a downtrend follows immediately after the distribution phase. This distribution starts after an uptrend, which is due to the fact that the whales in the market have decided to exit the market and that point by taking a sell position.
The whales decision to exit the market will cause a lot of selling pressure in the market. As a result a downtrend begins immediately after the distribution phase.
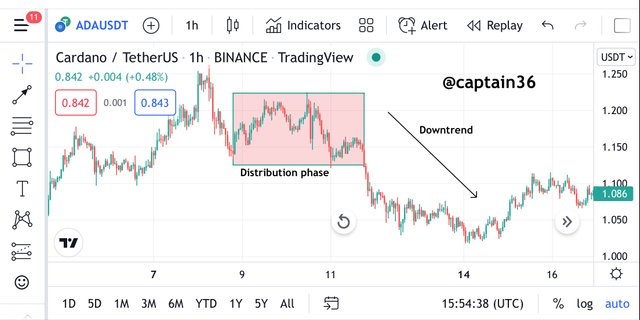
Screenshot from: Tradingview
Looking at the chart above, we can see clearly that the price began to make a strong bearish trend immediately after the distribution phase. The distribution phase has been highlighted in the chart above.
When the whales in the market at some point decide to take a buy position in the market, we will see that the price begins to rise again but not all the time that a complete uptrend will be seen. The price can distribute again at this point and then continue to have a downtrend again. This process is known as redistribution phase.

3. Explain the 3 phases of the market and how they can be identified on the chart.
After what we learnt from the Dow theory, we always expect that the market is always on an uptrend or a downtrend. When the market is not on an uptrend or on a downtrend, then the market is in a ranging phase. This phase is referred to as the sideways phase. When the market is on an upward movement, it is referred to as a bullish trend and when the market is on a downward movement, it is referred to as a bearish trend. When the price is on a sideways phase, the price usually bounces between the support and resistance levels.
Bullish phase
The price in the market is at a bullish phase when we can observe a lot of higher highs. At this point there is high buying pressure in the market so the price keeps rising in this phase. This phase is an indication that there are a lot of buyers in the market which increases the demand in the market hence causing the price to continue making a bullish trend.
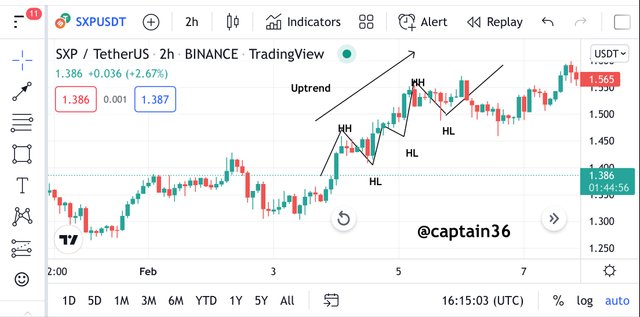
Screenshot from: Tradingview
Bearish Phase
The price in the market is at a bearish phase when we can observe a lot of lower lows at this phase. At this point there is high selling pressure in the market so the price keeps falling in this phase. This phase is an indication that there are a lot of sellers in the market which increases the supply in the market hence causing the price to continue making a bearish trend.
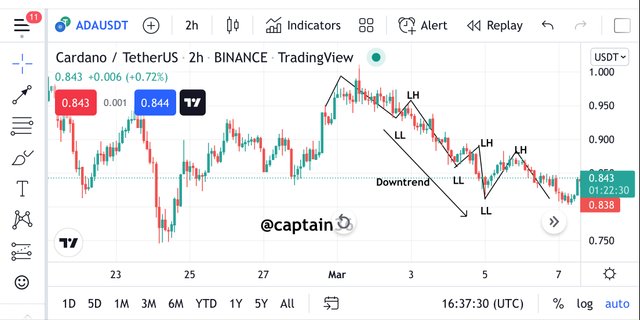
Screenshot from: Tradingview
Ranging Phase
The ranging phase is a zone in the market where the market is still in either the accumulation phase or the distribution phase. The market is usually at a ranging phase when the market just finished a downtrend or an uptrend and then prepares to make another trend after that. During the ranging phase, we could see that the price keeps bouncing between the support and resistance level. This will take place for some time before an eventual breakout happens for a particular trend to start again.
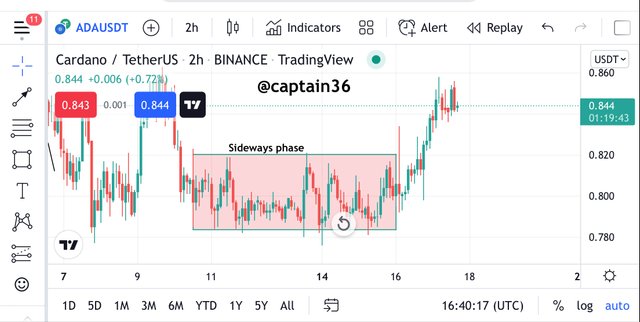
Screenshot from: Tradingview

4. Explain the importance of the Volume indicator. How does the volume confirm a trend? Do this for the 3 phases of the market (Screenshots required).
The volume indicator is an indicator that can be used in technical analysis to measure the supply and demand in the market at a particular time. This indicator measures the volatility of the market as well.
The volume bars on the chart are used to determine how volatile the market is. The volume bars rise very high when the supply or the demand is very high in the market.
We can predict the direction of the market after we have been able to measure the buying and selling pressure in the market. The selling and buying pressure gives us a fair idea about the direction of the price.
The presence of a trend can be confirmed by the use of the volume. When the volume bar rises and the volume in the market keeps rising, we can say that there is high buying pressure hence we expect a bullish trend. Likely when the volume in the red bars increases, we can say that the selling pressure is high and a bearish trend is expected to take place.
The market is then said to be in a sideways face when the volume in the market is not increasing and then the volatility is very low. This phase can either be the accumulation or distribution phase.
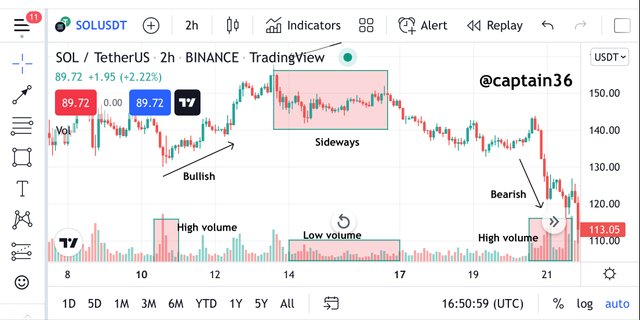
Screenshot from: Tradingview
Looking at the chart above, it can be seen clearly that when there is an uptrend or a downtrend in the market, the volume bars rises but when the market is in a sideways phase, the volume is very low.

5. Explain the trade criteria for the three phases of the market. (show screenshots)
The 3 market phases have different trade criteria. The bullish has its own trade criteria same as the bearish phase and the ranging phase. They all have their unique trade criteria.
Bullish Phase
For us to know that the market is on a bullish trend, we have to ensure that there are higher highs that can be seen in the market. These are the signals that will confirm to us that the market is on an uptrend.
When the price makes a breakout, let's wait until the price retest the original breakout point so we can enter the market.
Now after taking a buy position, you will set your risk reward ratio at 1:1 or 1:2 RR.
This is demonstrated in the chart below.
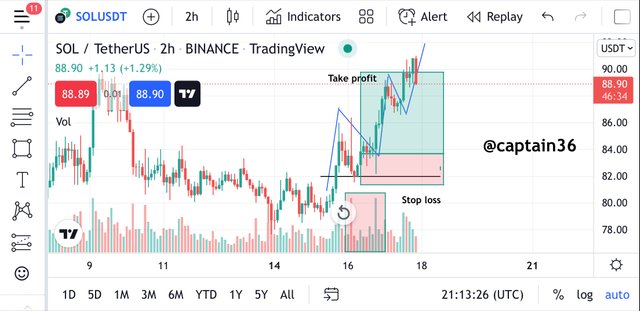
Screenshot from: Tradingview
Bearish Phase
For us to know that the market is on a bearish trend, we have to ensure that there are lower lows that can be seen in the market. These are the signals that will confirm to us that the market is on a downtrend.
When the price makes a breakout, let's wait until the price retest the original breakout point so we can make an entry in the market.
Now after taking a sell position, you will set your risk reward ratio at 1:1 or 1:1 RR to ensure proper risk management.
This is demonstrated in the chart below.
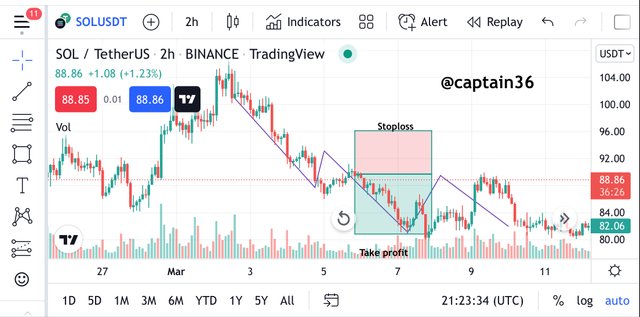
Screenshot from: Tradingview
Sideways Phase
In this sideways phase, the price keeps bouncing between the support and resistance levels. During this sideways phase, the volume in the market is low as well.
After the Ranging period, when the price retest the support level can place a buy order. Similarly, when the price retest the resistance level after the ranging phase, we can place our sell order.
Then we can place our stop loss and take profit accordingly. This is demonstrated in the chart below.
Screenshot from: Tradingview

6. With the Trade criteria discussed in the previous question, open a demo trade for both Buy/Sell positions.
Buy Position
BTCSTUSDT
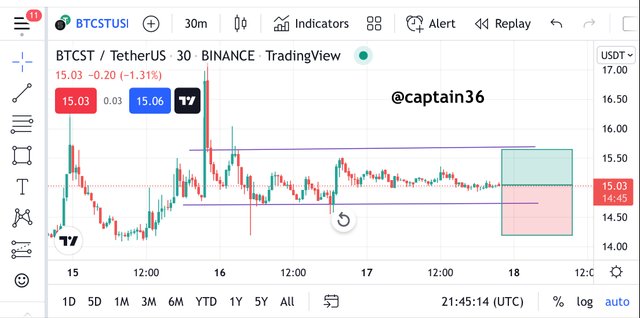
Looking at the chart below, we can conclude that the market is on an uptrend due to the fact that we can see a lot of higher highs and higher lows in the market. We can also see that there is high volume in the market which goes on to confirm the bullish trend.
When we realized that the price made a low and retest at the support level, a bullish engulfing started forming after that and for this reason I placed my buy order. I entered the market at the price of $15.03, then placed a stoploss at $14.19 and then placed the take profit at $15.65.
This is demonstrated in the chart below.
Screenshot from: Tradingview
The demo trade placed using the trading view paper trading can be seen below;
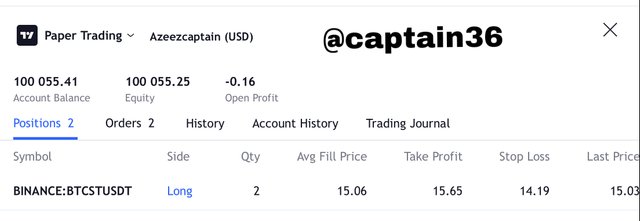
Screenshot from: Tradingview
Sell Position
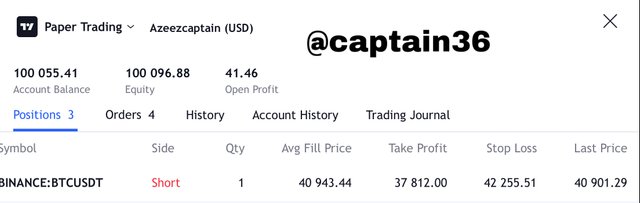
BTCUSDT
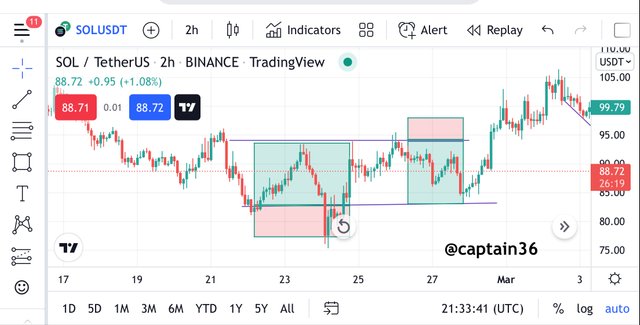
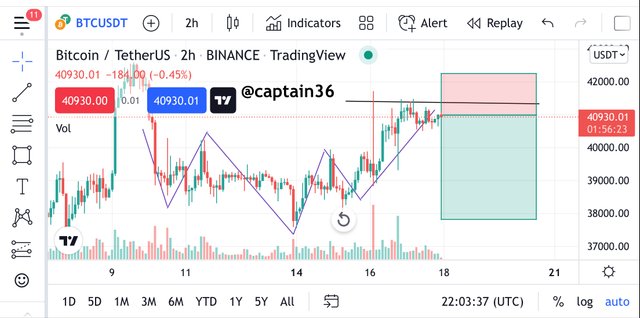
The chart below indicates that the market was in a sideways face and we can see clearly that the prices were bouncing between the support and resistance levels.
Then I waited for the price to touch the resistance level so I opened my sell order. I placed the order at a price of $95.7. I placed the stoploss above the resistance level at a price of $96.4. Then finally placed the take profit at $94.6. The take profit was placed around the support level. This is demonstrated in the chart below.
Screenshot from: Tradingview
The demo trade was placed using the trading view paper trading as seen in the chart below.
Screenshot from: Tradingview

Conclusion
This lecture was used to discuss the psychology of Trend Cycles. The importance of studying the trend cycle have been highlighted above.
The phases in the market help traders to identify trends in the market. So traders understanding these phases will help them to be able to take the right trading positions in the market.
Thanks once again professor @reminiscence01
Hello @captain36 , I’m glad you participated in the 4th week Season 6 at the Steemit Crypto Academy. Your grades in this Homework task are as follows:
Observations:
This is incorrect.
Recommendation / Feedback:
Thank you for participating in this homework task.