Crypto Trading Strategy with Triangular Moving Average (TRIMA) - Crypto Academy |S6W4| - Homework Post for Professor @fredquantum
Hello everyone, this is week 4 of season 6 of the steemit crypto academy. This week's lecture was delivered by professor @fredquantum and the topic for discussion is on Crypto Trading Strategy with TRIMA Indicator. After taking this lesson and understanding it properly, I decided to try my hands on the given task.


1. what is your understanding of the TRIMA indicator?
For us to be able determine the direction of a price in a market, we can use a trend-based indicator such as the moving averages. We can use the past prices specifically the average closing prices within a certain to calculate for moving averages. A dynamic line is formed by the use of the moving averages and this assists in identifying the direction of a trend. However, the simple averages easily react to noise in the market and this is a shortcoming of it. It is also a lagging indicator so it identifies signals late as well which will make traders miss out on some relevant signals.
These shortcomings of the simple moving averages is the reason why the TRIMA indicator was invented. The TRIMA indicated is an upgrade of the simple moving averages which has much more weight and is able to track more accurate signals in the market. The difference between the TRIMA indicator and the simple moving averages is that the TRIMA indicator is able to filter out unnecessary fluctuations in the market and this is because the TRIMA indicator is double-smoothed. This ensures that the TRIMA indicator tracks more accurate signals compared to the simple moving averages.
The above stated reason makes the TRIMA indicator a much better indicator as it is able to track good signals in the inspite of the volatile nature of the market. The TRIMA indicator is able to filter out the unnecessary fluctuations in the market due to its advanced features.

2. Setup a crypto chart with TRIMA. How is the calculation of TRIMA done? Give an illustration. (Screenshots required).
We can set up the TRIMA indicator when we open any crypto chart on the Tradingview site. We will discuss the TRIMA indicator addition in this section.
After we open the Tradingview chart, we will click on the indicator option which can be found at the top of the chart. After that a search bar will pop up so we will enter TRIMA. This can be seen on the chart below.
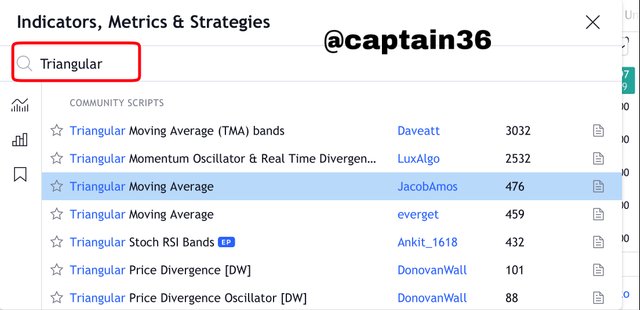
Screenshot from: Tradingview
Then the TRIMA indicator will appear so we click on it to add it to the chart.
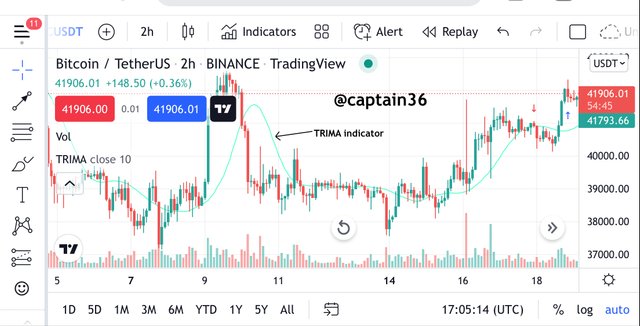
Screenshot from: Tradingview
This TRIMA indicator can be configured. To do this, we click on the indicator and choose the settings option. We can then configure the indicator to suit our choice of trading.
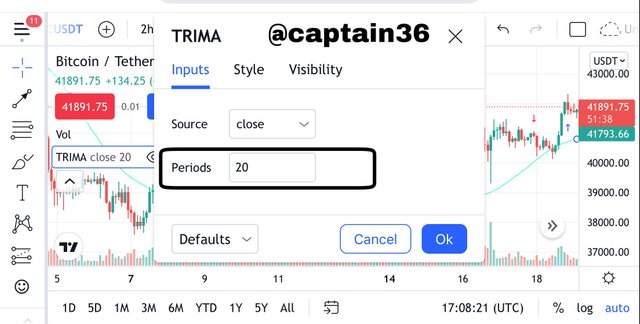
Screenshot from: Tradingview
Like seen on the chart above, the TRIMA indicator has 9 as its default period. But this period can be changed to suit the choice of the trader at any time. The short periods such as the 9 are good for short term trading. When engaging in a long term trade, we can use a higher period such as 21, 23, 25 etc. The higher period does not cause much noise in the market as compared to the short periods.
Calculation of TRIMA indicator
The Simple Moving Average(SMA) is used for the calculation of the TRIMA indicator. Like other indicators, this one also relies on past data points for its calculation.
The first step in calculating the TRIMA indicators is looking for the SMA for a specific period. We then go on to average these SMAs in order to get the figure for the TRIMA.
SMA calculation
Let's first define the parameters needed for the calculation.
Let;
P = asset price
n = total periods taken into consideration
Pn = last price
(P1-P4) = Prices of the asset in four different periods
After knowing the parameters, the formula below is used to calculate the SMA.
SMA = (P1+P2+P3+P4+.......Pn)/n
After determining the SMA of the prices over a given period of time with the formula above, we can then go on to calculate the TRIMA. We can do this by taking the average of the SMA and then we will arrive at the TRIMA value.
The formula for taking the average of the SMA to get the TRIMA value is shown below.
TRIMA = (SMA1 + SMA2 + SMA3 + SMA4.....+SMAn)/n
After following this procedure and applying the formula above, we will end up getting the TRIMA value.
Illustration of TRIMA calculation
Let's take the following values as the SMAs for BTC. The values are 7 in number and they are as follows; 2800, 2946, 3765, 4875, 2560, 3590, 2780. We can obtain the TRIMA value by following the calculations below;
TRIMA = (2800 + 2946 + 3765 + 4875 + 2560 + 3590 + 2780) / 7
TRIMA = 23316 / 7
TRIMA = 3330.857

3. Identify uptrend and downtrend market conditions using TRIMA on separate charts.
For traders to be able to carry out effective trading, they have to have the ability to be able to determine the trend of prices in the market. This is very relevant to ensure good trading skills. To determine the Trend in a market, the TRIMA indicator is one of the trend-based indicators that can carry out this procedure effectively and efficiently. Due to the advanced features of the TRIMA indicator, it is able to give very accurate signals in the market more than the simple moving averages. We can set good timeframes and periods to increase the efficiency of the TRIMA indicator. Traders that engage in short term trading can choose a short timeframe whilst traders that engage in long trades can choose a high time frame. Like I said earlier the high timeframe is able to filter out unnecessary fluctuations in the market in order to get accurate signals.
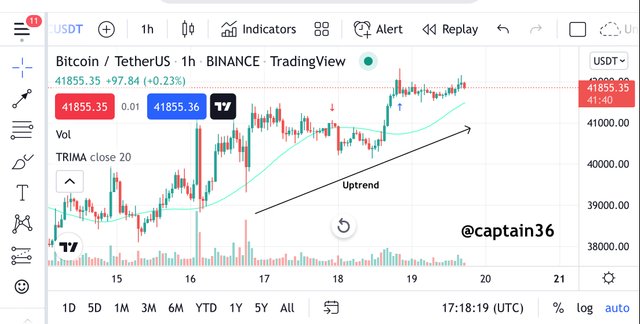
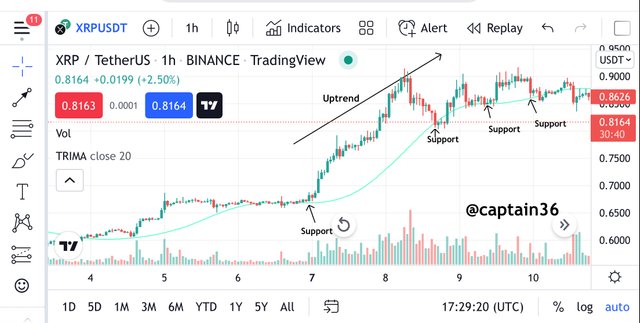
Uptrend
When there is an uptrend in the market, we can see that the price is trending above the TRIMA indicator. This can be seen in the below chart. When there is an uptrend, it is clear that we will see a lot of Higher highs and Higher lows in the chart.
Screenshot from: Tradingview
Looking at the chart above, we can see that when the price was about to make an uptrend, it broke the TRIMA indicator and moved above it leaving the TRIMA indicator to serve as a dynamic support to the price. When there is going to be a trend reversal in a bearish direction, we can see that the price breaks the TRIMA indicator and moves downward again.
Downtrend
When there is a downtrend in the market, we can see that the price is trending below the TRIMA indicator. This can be seen in the below chart. When there is a downtrend, it is clear that we will see a lot of lower highs and lower lows in the chart.
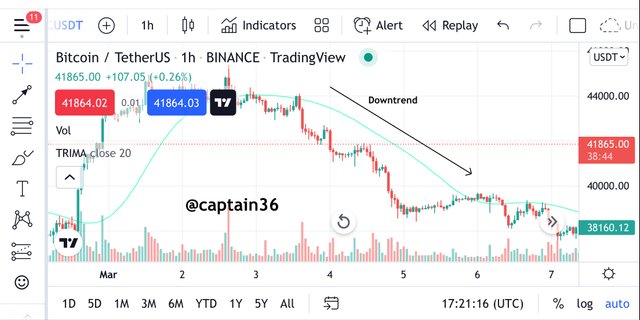
Screenshot from: Tradingview
Looking at the chart above, we can see that when the price was about to make a downtrend, it broke the TRIMA indicator and moved below it leaving the TRIMA indicator to serve as a dynamic resistance to the price. When there is going to be a trend reversal in a bullish direction, we can see that the price breaks the TRIMA indicator and moves upward again.

4. With your knowledge of dynamic support and resistance, show TRIMA acting like one. And show TRIMA movement in a consolidating market. (Screenshots required).
The aspects in the market where there is usually a concentrated buying pressure or selling pressure is usually referred to as the support and resistance levels. Making a decision of taking buy positions or sell positions is easier for traders when they are able to correctly identify these support and resistance levels. In the case of the normal support and resistance, horizontal lines can be drawn to represent these levels. But in the case of the dynamic support and resistance, these horizontals are not drawn to represent them. The points of the dynamic support and resistance are plotted in order to suit the current direction of the market.
There are different technical analysis tools that can be used for dynamic support and resistance. Some of these include indicators such as Heikin Ashi, Bollinger bands, moving averages etc. Other tools such as trend lines and channels can also be used as dynamic support and resistance.
Like some of the indicators serving as the dynamic support and resistance, the TRIMA indicator can also serve as the dynamic support and resistance for the price. The TRIMA indicator serves as the dynamic support when the price is in a bullish trend. This happens when the price breaks the TRIMA indicator and begins to trend above the TRIMA indicator. This observation can be used to place a buy order in the market. The chart below demonstrates the TRIMA indicator serving as the dynamic support.
Screenshot from: Tradingview
Looking at the chart above, the price bounces off whenever it touches the TRIMA indicator. The TRIMA indicator also serves as the dynamic support and the price trends above the TRIMA indicator.
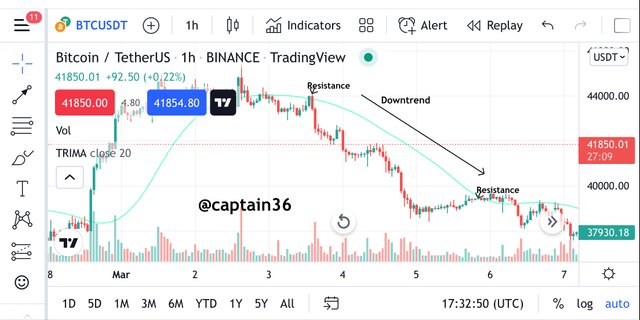
Likewise, the TRIMA indicator serves as the dynamic resistance when the price is in a bearish trend. This happens when the price breaks the TRIMA indicator and begins to trend below the TRIMA indicator. This observation can be used to place a sell order in the market. The chart below demonstrates the TRIMA indicator serving as the dynamic resistance.
Screenshot from: Tradingview
Looking at the chart above, the price bounces off whenever it touches the TRIMA indicator. The TRIMA indicator also serves as the dynamic resistance and the price trends below the TRIMA indicator.
Movement of TRIMA indicator in a consolidating market
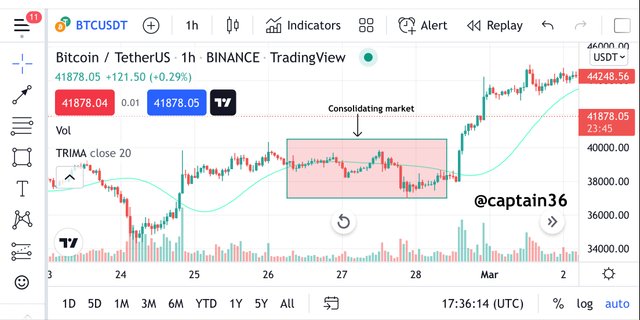
A market is said to be in a consolidating phase when the market is ranging and then keeps bouncing between the support and resistance levels. During this period, the market is not making a bullish trend nor making a bearish trend. This is due to the fact that the market is less volatile at this stage. So when the market is in this phase, the TRIMA indicator is neither below the price nor above the price. The TRIMA indicator will be located inside the price because the price is balanced at that phase and is not making a bullish or bearish trend. This is demonstrated in the chart below.
Screenshot from: Tradingview
Looking at the chart above, the TRIMA indicator can be seen inside the price. The price is not on a bullish or bearish trend. When this trend is about to make a breakout when it can see that the indicator will then be seen below or above the price.

5. Combine two TRIMAs and indicate how to identify buy/sell positions through crossovers. Note: Use another period combination other than the one used in the lecture, explain your choice of the period. (Screenshots required).
We can combine two TRIMA indicators in a trading crossover strategy. What we ensure is that the two TRIMA indicators have different periods when combining them. Usually we set one TRIMA indicator to have a short period and set the other to have a longer period. The one with the short period is usually more reactive to trend than the one with the long period.
Traders combine these two indicators in order to locate good trading opportunities in the market. This helps traders to identify a good entry and exit points in the market. In this section I will be combining two indicators with a period of 20 and 50 respectively.
Buy TRIMA Crossover
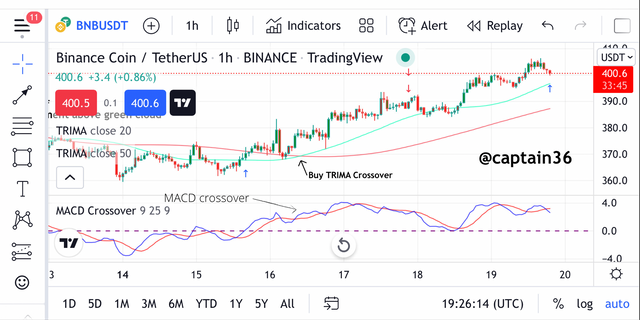
A market is said to be in a bullish trend when the TRIMA with the short period moves about the TRIMA with the long period. In this case when the 20 period TRIMA moves above the 50 period TRIMA, we can conclude that the market is in a bullish phase and a buy order could be placed. This is demonstrated in the chart below.
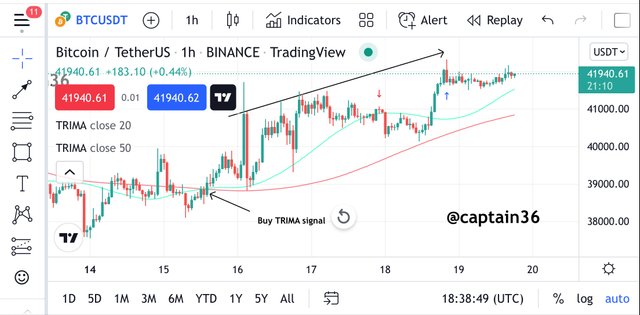
Screenshot from: Tradingview
Looking at the chart above, we could see clearly that the 20 period TRIMA moved above the 50 period TRIMA. This was an indication that the buyers were dominating the market and for that reason the market was on an uptrend. The bullish trend continued for some time and we could see that there is a constant formation of higher highs and higher lows in the chart. The TRIMA indicator continued to serve as the dynamic support to the price which is above the TRIMA indicator.
Sell TRIMA Crossover
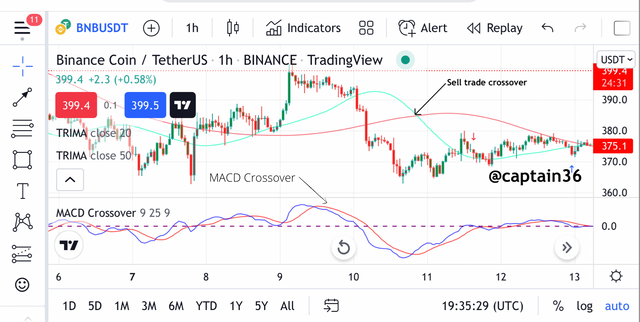
A market is said to be in a bearish trend when the TRIMA with the long period moves about the TRIMA with the short period. In this case when the 50 period TRIMA moves above the 20 period TRIMA, we can conclude that the market is in a bearish phase and a sell order could be placed. This is demonstrated in the chart below.
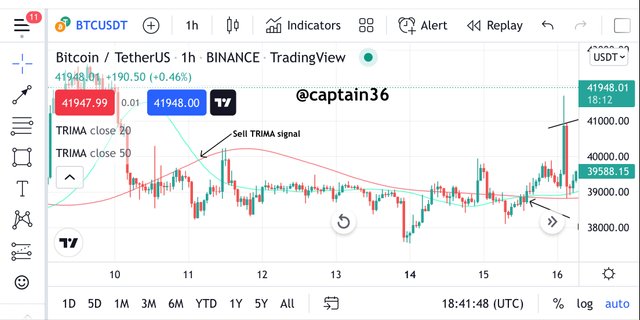
Screenshot from: Tradingview
Looking at the chart above, we could see clearly that the 50 period TRIMA moved above the 20 period TRIMA. This was an indication that the sellers were dominating the market and for that reason the market was on a downtrend. The bearish trend continued for some time and we could see that there is a constant formation of lower highs and lower lows in the chart. The TRIMA indicator continued to serve as the dynamic resistance to the price which is below the TRIMA indicator.

6. What are the conditions that must be satisfied to trade reversals using TRIMA combining RSI? Show the chart analysis. What other momentum indicators can be used to confirm TRIMA crossovers? Show examples on the chart. (Screenshots required).
Trend Reversal Using TRIMA indicator
Before traders can execute reversal trading by the use of the TRIMA indicator, some procedures must be followed. Some of the necessary conditions need to carry out the TRIMA crossover strategy are discussed below;
Bullish Tend Reversal
Two TRIMA indicators will be added to the chart. Each TRIMA indicator will be set to a different period.
Then after this we will anticipate that the TRIMA with the short period moves above the TRIMA with the long period. That is a signal that the buyers are dominating the market and there's a likely bullish trend.
When this scenario happens, then we anticipate that the price breaks above the TRIMA indicator. After this the TRIMA serves as a dynamic support and this confirms a bullish trend.
As the price approaches the resistance level, we can exit the market. We have to set the stop loss and the take profit as shown in the chart below.
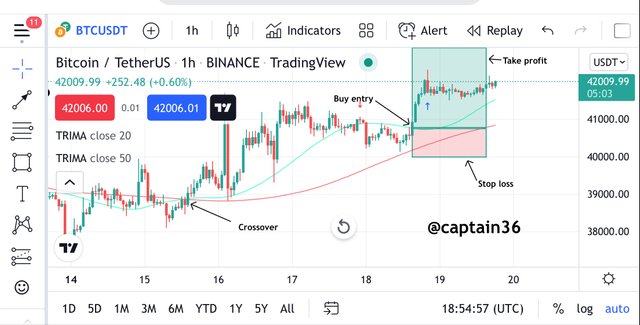
Screenshot from: Tradingview
Looking at the chart above, the price broke the TRIMA indicator and made an uptrend which is a signal of buyers dominating the market. We could also see that the TRIMA indicator with a short period crossed above the TRIMA indicator with the long period. After these observations we can place our buy order and then place the take profit close to the resistance and the stop loss placed under the previous low.
Bearish Trend Reversal
Two TRIMA indicators will be added to the chart. Each TRIMA indicator will be set to a different period.
Then after this we will anticipate that the TRIMA with the long period moves above the TRIMA with the short period. That is a signal that the sellers are dominating the market and there's a likely bearish trend.
When this scenario happens, then we anticipate that the price breaks below the TRIMA indicator. After this the TRIMA serves as a dynamic resistance and this confirms a bearish trend.
As the price approaches the support level, we can exit the market. We have to set the stop loss and the take profit as shown in the chart below.
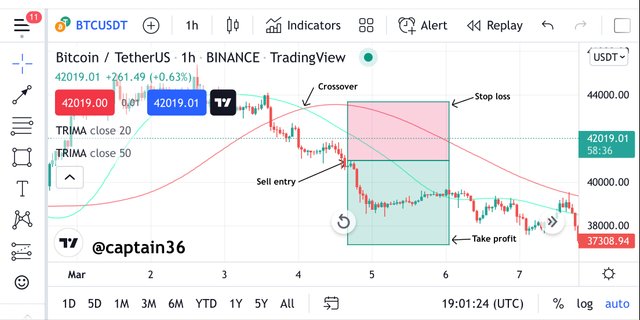
Screenshot from: Tradingview
Looking at the chart above, the price broke the TRIMA indicator and made a downtrend which is a signal of sellers dominating the market. We could also see that the TRIMA indicator with a long period crossed above the TRIMA indicator with the short period. After these observations we can place our sell order and then place the take profit close to the support and the stop loss placed under the previous high.
Confirming Trend Reversals with MACD and TRIMA indicator combined
The MACD indicator operates with momentum. Two EMAs are combined to form the MACD indicator. The two EMAs combined are of different periods. One of the EMAs has a slow period whilst the other is set to a fast period. There is said to be a trend reversal when the fast period EMA crossover and move below or above the slow period EMA.
In this section, I will be adding the TRIMA indicator as well as the slow period and fast period EMAs. The action of the TRIMA indicator will be confirmed by the crossover of the MACD indicator. This is demonstrated in the chart below.
Screenshot from: Tradingview
Looking at the chart above, we can see that in the case of the TRIMA indicator, the slow period TRIMA crossed over the fast period TRIMA which signals a bullish trend. The action was confirmed by the MACD indicator when the EMA slow period EMA crossed over the fast period EMA. The agreement between the two indicators shows that there is a bullish trend and we can place our buy order.
Screenshot from: Tradingview
Looking at the chart above, we can see that in the case of the TRIMA indicator, the slow period TRIMA crossed below the fast period TRIMA which signals a bearish trend. The action was confirmed by the MACD indicator when the slow period EMA crossed below the fast period EMA. The agreement between the two indicators shows that there is a bearish trend and we can place our sell order.

7. Place a Demo and Real trade using the TRIMA reversal trading strategy (combine RSI). Ideally, bullish and bearish reversals. Utilize lower time frames with proper risk management. (Screenshots required).
Demo Trade TRACUSDT
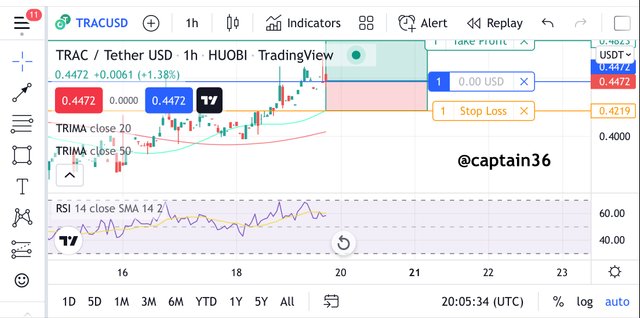
Screenshot from: Tradingview
Looking at the chart above, we can see that the TRIMA indicator with the short period has crossed above the TRIMA indicator with the long period. In this case the 20 period TRIMA moved above the 50 PERIOD TRIMA which signals and uptrend. We can also see that the RSI indicator moved below the 30 mark which indicates an oversold. The agreement in signals between the two indicators means a bullish trend is very likely.
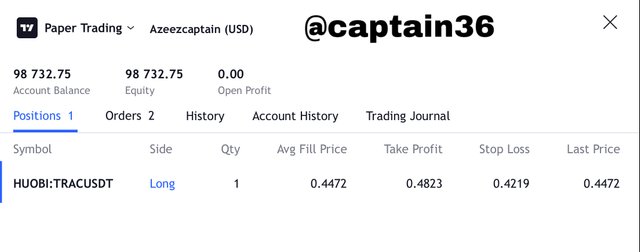
I then placed my buy order after all these signals. The trade was executed at $0.4472. The stop loss was set at $0.4219 and the take profit set at $0.4823. I also set the risk reward ratio of 1:2 RR. The paper trading is shown in the screenshot below.
Screenshot from: Tradingview
Real Trade AVAXUSDT
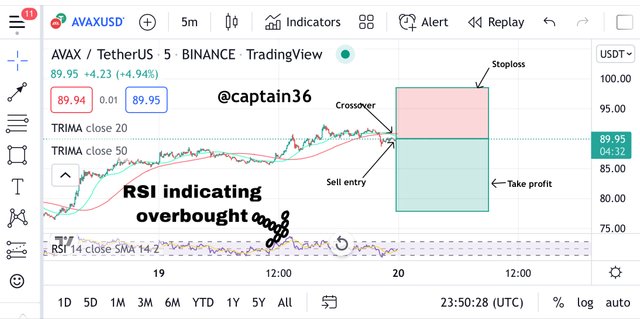
Screenshot from: Tradingview
Looking at the chart above, we can see that the TRIMA indicator with the short period has crossed below the TRIMA indicator with the long period. In this case the 20 period TRIMA moved below the 50 PERIOD TRIMA which signals a downtrend. We can also see that the RSI indicator moved above the 70 mark which indicates an overbought. The agreement in signals between the two indicators means a bearish trend is very likely.
I then placed my sell order in my Huobi pro exchange account after all these signals. The trade on Huobi pro is shown in the screenshot below.
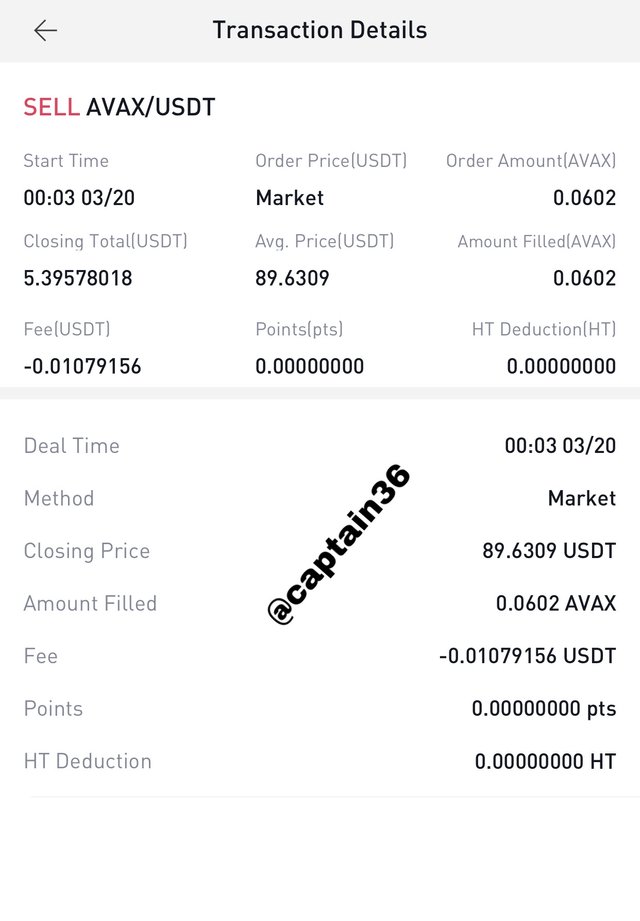
Screenshot from: Huobi pro

8. What are the advantages and disadvantages of TRIMA Indicator?
Like any other indicator, the TRIMA indicator has its own merits and demerits. We will be discussing both aspects of the TRIMA indicator in this section. Let's start with the advantages.
Advantages
The TRIMA indicator is able to filter out unnecessary fluctuations in the market because it is able to smooth the price.
Two TRIMA indicators set to different periods can be combined to generate trade signals. This will help traders to be able to take better trade positions in the market.
The TRIMA indicator gives more accurate signals as compared to the simple moving averages. So using the TRIMA indicator helps traders to avoid fake signals and then make the best trading decisions.
The TRIMA indicator can also be used to determine trend reversals in the market. The crossing over of the long period TRIMA and the short period TRIMA shows both bullish and bearish trend reversals.
Disadvantages
One of the shortcomings of the TRIMA indicator is that it is a lagging indicator. Due to this the TRIMA indicator is likely to miss out on some signals and this might show fake signals to traders.
This indicator only gives good results when it is combined with other indicators. IT can't give good results when it is used alone unless it is combined with other indicators such as the MACD, RSI etc.

Conclusion
The TRIMA indicator is one of the indicators that can be used to identify the trend in a market. It is similar to the SMA but it is a more advanced one that is able to filter out the noise in the market when it smooth the price. That is why the TRIMA indicator is preferred to the SMA in determining the trend in a market.
This TRIMA indicator can also serve as a dynamic support and resistance for a price in a market. The TRIMA indicator performs very well when it is combined with other indicators. This helps it to give the best signals to traders so they can avoid fakeouts in the market.
Thank you once again professor @fredquantum for this detailed lecture.